Monday, June 17, 2013

The Real Story Of The Cyprus Debt Crisis (Part 1)

by Charles Hugh-Smith

I am privileged to present a comprehensive yet succinct two-part account of the banking/debt crisis in Cyprus, prepared by a knowledgeable resident of that nation. Why do the debt crisis in Cyprus and the subsequent "bail-in" confiscation of bank depositors' money matter? They matter for two reasons:

1. The banking/debt crisis in Cyprus shares many characteristics with other banking/debt crises.

2. The official Eurozone resolution of the crisis--the "bail-in" confiscation of 60% of bank depositors' cash in an involuntary exchange for shares in the bank (which are unlikely to have any future value)--may provide a template for future official resolutions of other banking/debt crises.

In other words, since the banking/debt crisis in Cyprus is hardly unique, we can anticipate the resolution (confiscation of deposits) may be applied elsewhere.

Readers may recall that the initial resolution in Cyprus called for all depositors to accept a "haircut" (the harmless-sounding vernacular for confiscation). This triggered widespread outrage, and was soon amended to exempt the first 100,000 euros on deposit. 60% of the remaining "uninsured" deposits would be confiscated and involuntarily exchanged for bank shares, in two tranches of 37.5% and 22.5%: Bank of Cyprus starts process of turning uninsured deposits into stocks (April 29, 2013)

In sum, it's extremely important to understand the real story of the Cyprus Debt Crisis to be able to sort out which features of the situation may be considered unique and which ones are shared by other banking/debt crises.

We are fortunate to have this on-the-ground account by a longtime resident of Cyprus, John H. Morgan. Here is Part 1 of his report.


The story of The Republic of Cyprus’ descent into bankruptcy is a Greek tragedy of epic proportions.


The Cyprus Political Crisis post-1974

In July 1974, in the face of an airborne invasion backed by the armour of NATO member Turkey, 200,000 Greek Cypriot citizens ran from their homes with only the clothes on their backs. The Greek Cypriot armour and infantry were no match for the second largest standing army in NATO, equal in size to the British and French forces combined. The Greek Cypriots were easily routed. The victors conducted summary executions of thousands of their prisoners and threw some of the bodies down wells to hide their crimes.

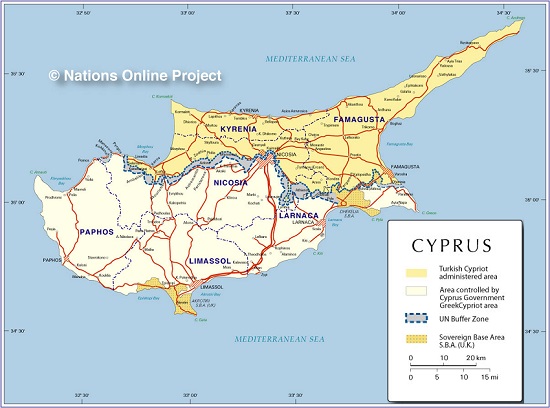
History, geography and economy of Cyprus (Wikipedia)
37% of the island of Cyprus was taken; 50,000 Turkish Cypriots fled north and took shelter in the homes abandoned by the Greek Cypriots; 200,000 Greek Cypriot refugees fled south and were housed in tents, in the same way that hundreds of thousands of Syrian refugees are now sheltered by the Turkish Government in 2013.
Yet so began the housing boom in Cyprus. Refugees in the Turkish-occupied North had the pick of thousands of abandoned homes. Refugees in the South had to build their own. The Cyprus Government parcelled out plots of government land. The banks would not give mortgages on state land so the Cyprus Government stepped in and funded the construction industry.
Political opportunism was not far off. During his election campaign Former President Glafcos Clerides allegedly promised to give Greek Cypriot refugees temporary title to thousands of Turkish Cypriot homes and land. Once he was elected, the programme was halted. He handed out 8,000 Government jobs to party cronies in his 10 years as President, perhaps by way of consolation.
Patronage, cronyism and clientelism have been the hallmark of government control in both the South and occupied-North of Cyprus. Since the Turkish occupation, employment in the State sector in Cyprus has been used to reward party loyalty (and to incentivise elections). The civil service in the free Republic of Cyprus has grown from 18,000 workers in 1978 (costing €36 million in annual salaries and benefits), to 70,000 workers in 2012 (costing taxpayers and business €2.8 billion per year).
One in six workers out of a total workforce of 440,000 are employed in the public sector. The government controls an empire of 63 Semi-Government Organisations (SGOs) plus the Cyprus National Guard, an army of conscripts headed by a permanent officer corps. Officials in charge of the SGOs are appointed by party affiliation. SGOs are monopolies and can set their own tariffs.
State teachers have become the highest paid in Europe, with top teachers earning almost three times (282%) the salaries of their counterparts across Europe. In January 2013, state teachers went on strike because they were required to work one extra lesson per week, 40 minutes. Electricity prices skyrocketed to the second highest in Europe, to fund the pensions of the broader state sector. Between 2009 and 2011, the price of domestic electricity doubled. A clerk in government with a High School Certificate could earn the same salary as a Professor in a private university.
In December 2012, the pension funds of the Telecommunications, Electricity and Ports Authorities were raided to pay State workers their 13th cheques. In May 2013, the workers of the Ports Authority downed tools because their 14th cheque was reduced by half.
All political parties have been complicit in the transfer of wealth from the private sector to the public sector. In 2009, 98 shipping containers of Iranian armaments on their way to Syria, were intercepted by the US Navy. On 11 July, 2011, they exploded while being stored at the Cyprus naval base. The island’s main power station was destroyed and 13 lives were lost. Insurance companies paid out the first claims within weeks. The Cypriot Parliament charged the taxpayers €99 million to cover claims for “Public Liability”. The item was slipped in as the last entry of the 2013 State Budget.
The DIKO Party is the government’s coalition partner (and coalition partner of most of the previous governments). While in power from 2003 to 2008, is alleged to have amassed €18 million of Party funds by endorsing a contract to buy two additional Airbus planes for the loss-making Cyprus Airways.
In 2007, the DIKO government asked parliament to approve the construction of a multi-billion Euro offshore floating Liquefied Natural Gas (LNG) terminal. The gas was meant to be used to power the Vassilikos Power station (destroyed in July 2011, as mentioned above). Parliament questioned why such a massive construction was needed when a few storage tanks would suffice. The government failed to tell the nation that trillions of cubic feet of gas had been discovered offshore. Politicians had set up a front company to take a cut of the billions of Euros taxpayers would contribute to build the plant and to ensure they received an annual dividend from the profits of selling millions of cubic feet of LNG to Europe.
Government debt has been compounded because Cypriots generally avoid paying taxes. Indeed, there are only 52 tax inspectors in the whole country. In her report to Parliament in April 2013, the Auditor-General noted that Cypriots owed their government €1.6 billion in back-taxes and fines, enough to pay off all Eurobond debt due in 2013. She pointed out that failure to collect taxes meant that €300 million of State revenue had been irretrievably lost.
At the end of December 2012, ex-President Christofias vacated the rotating Presidency of the European Council. For 6 months work, he would receive an EU pension estimated at €10,000 per month, courtesy of European taxpayers. For his 17 years as an MP and 5 years as President of the Republic of Cyprus, he would receive a State pension of €22,000 per month, a brand new BMW limousine costing €43,000, a driver, a secretary and 15 body-guards, courtesy of Cypriot taxpayers.
Just one month before Cypriot Presidential elections of February 2013, the Trade Union-backed Communist regime of ex-President Christofias was assiduously appointing party apparatchiks to all key State posts, such as to the Central Bank of Cyprus and the newly-formed State Hydrocarbons Company (theoretically a private company). This guaranteed that the looting and pillage of the Cyprus economy could continue, long after President Christofias had left power.
**********************************************************

The Cyprus Banking Crisis

Corruption was also endemic in the Russian Federation after the fall of the Soviet Union. The chaotic privatisation during the Yeltsin years from 1992 to 1999, made a selected few Russians very wealthy. Many of the new Russian oligarchs wanted to safeguard their money and moved their operations to Cyprus. The country offered a low tax regime. Few questions were asked. The island became a favoured tourism and business destination. The debt overhang which had accrued from rebuilding the Cyprus economy became manageable. There was a plentiful supply of homes and offices, a legacy of rebuilding the devastated island.
In 2004, the Republic of Cyprus joined the European Union. A new wave of investors brought great wealth to the island. House prices in the United Kingdom had been heavily inflated owing to short supply and easy credit. 60,000 Britons chose to buy affordable second homes or retirement homes in Cyprus. Between 2004 and 2007, fueled by a housing bubble, the Cyprus economy grew at 4% per year. At the end of 2007, the State Budget was showing a 3.5% surplus. Public debt was less than 60% of GDP. Cyprus qualified to join the Eurozone.
In 2006, attracted by the huge wealth deposited in Cyprus Banks by British and Russian investors, an innovative salesman managed to sell two insolvent Greek banks to the island’s second largest lender, Cyprus Popular Bank. He became chairman of the enlarged bank, which was named Marfin Popular Bank or Laiki Bank.
After Cyprus joined the European Monetary Union in January 2008, he was able to move €5.1 billion of Cyprus bank deposits to a company he set up in Athens. He used equity in his new company as collateral. This substantially weakened the balance sheet of Laiki Bank. €500 million was lent to a Greek Monastery to buy shares in his company. The Vatopedi monks swapped state land they laid claim to, for prime real estate in Athens. Greek politicians facilitated the deals in return for kick-backs. The scandal brought down the Greek government in 2009.
To cover their capital shortfalls, Cypriot banks invested in Greek Government Bonds which offered very high interest rates. Cypriot banks were also heavily exposed to the Greek property and commercial markets. When the local banks could no longer finance Cypriot Government spending, the Christofias government "borrowed" the €7 billion which had been built up by the Social Security Fund.
The Greek Government applied for a financial bailout in 2010. Cypriot banks held €5.3 billion of Greek Sovereign Debt and a total of €23 billion of Greek assets. Cypriot banks suffered heavy losses in the Greek financial meltdown. Laiki Bank alone endured a €2.4 billion write-down on the value of its Greek Government Bonds. The 80% “haircut” on bonds was proposed by German Chancellor Merkel and French President Sarkozy to make Greece’s debt burden manageable. Other losses by Cypriot banks were estimated at 25% of their total Greek loan book.
The country’s largest bank, Bank of Cyprus, had been affected by a €2 billion write-down of Greek Government Bonds during the Greek PSI, but its directors had made provisions. One of the provisions, used by both BoC and Laiki Bank, was to offer €1.8 billion of Contingent Convertible Bonds to the public. This was preceded by intense marketing.
Sixty thousand customers transferred funds from low-yielding deposits to take advantage of the promised high-yield bonds. In the end, their money was converted to worthless bank equity. The depositors claimed they had been tricked. There were public protests. When auditors reviewed the records of BoC during its subsequent restructuring, 28,000 computer files relating to the purchase of Greek Government Bonds had been deleted by special software.
The Cypriot Banks applied to the Central Bank of Cyprus for support. The state nationalised Laiki Bank and injected €1.8 billion (10% of GDP). The state was then shut out of the international bond markets.
Laiki Bank was technically insolvent. There were rumours that the bank would default. Depositors had already withdrawn €3.3 billion of deposits by July 2012. The Central Bank of Cyprus propped up the ailing bank with billions of Euros of Emergency Liquidity Assistance (ELA).

In July 2012, the Christofias government turned to the rest of Europe for a bailout. President Christofias tried to dictate conditions to the Troika of lenders, the European Commission (EC), the International Monetary Fund (IMF) and the European Central Bank (ECB). He wished to avoid the political cost of signing the Memorandum of Understanding. This called for massive restructuring of the economy of Cyprus in return for a bailout. He had decided to pass the problem on to the next President.
Up until January 2013, a month before the Cypriot Presidential elections, German Finance Minister, Wolfgang Schäuble, denied aid to Cyprus by insisting that Cyprus did not qualify for European financial support. All the while, the Cypriot commercial banks were bleeding heavily in the Greek economic meltdown and were posting their best Greek assets as collateral for emergency funding from the Central Bank.
Furthermore, Schäuble told German voters, Cyprus should not receive German-guaranteed loans as it was an offshore tax haven and Germans would not want to risk their money to bail out wealthy Russians who had hidden their ill-gotten gains in Cyprus. (In a report commissioned by the Troika of lenders, European fraud agency Moneyval and Deloitte Financial of Italy reported a widespread lack of due-diligence, but could find little direct evidence to support such claims.)
Summary of Main Financial Report by Moneyval and Deloitte

See the original article >>

What The Fed Is Looking At

by Tyler Durden

A sense among investors that the global economy is unraveling has injected tremendous volatility into the markets. As Bloomberg's Rich Yamarone notes, if the global equity market decline is not a “Sell in May” event, but the beginning of a great unwinding, then the economy, skating on thin ice, may be even more susceptible to recession. However, most of the US equity disconnect from the reality of weak data (and other markets) can be laid at the feet of the Fed's ever-generous monetary policy. However, given all of this 'weakness' - or missing of Fed benchmarks that we discuss below - that the Fed is well aware of, we ask again, why would so many members have been out discussing 'Taper' if it were not due to their concerns of broken markets and bubble conditions.

Via Bloomberg,

The World Bank reduced its global economic forecast to 2.2 percent in 2013 – from a previous 2.4 percent estimate, and lower than the 2.3 percent performance in 2012.

From an economics perspective it was just a matter of time before conditions began to break down; gains in equity indexes to record highs amid sluggish economic performance were simply unsustainable. The bifurcation between the CRB index and the S&P 500 first appeared in December 2012. The S&P 500 now looks as if it will rejoin the commodity benchmark.

In the U.S. continued signs of frailty have surfaced, perhaps underscoring the likelihood of an economic slump. Detroit is on the brink of bankruptcy, and several top tier indicators are flashing warning signs. Economists polled by Bloomberg forecast U.S. GDP to increase a lowly 1.9 percent in 2013, after a 2.2 percent gain in 2012.

Last week’s economic tea leaves revealed that job openings declined in April and retail sales advanced 0.6 percent in May. Retail sales excluding autos were only 0.3 percent higher. The total business inventory-to-sales ratio increased to 1.31 months – the highest level since October 2009 (1.32) when the U.S. economy was in the initial stages of recovery from the Great Recession.

Import prices were decidedly deflationary as the overall figure fell 0.6 percent last month, and were 1.9 percent lower than in May 2012. All of the associated core measures (ex food, energy, etc.) were also contracting on a year-over-year basis.

Deflationary pressures may also be seen in the wholesale channel. Core intermediate producer prices, a closely followed barometer for potential inflationary or deflationary pressures, fell 0.3 percent in May and was 0.2 percent lower than a year ago. This is not an economically compromising level, but it should keep the Fed from tapering its accommodative monetary policy.

The final major economic release last week was the Fed’s industrial production report for May. The second quarter is off to a very slow start as total production was unchanged in May and contracted 0.4 percent in April. Industrial production peaked in mid-2010 (8.5 percent versus 1.61 percent today), and the regional Fed manufacturing indexes are all in contractionary territory.

Electricity output has fallen in each of the last five weeks (on a year-over-year basis), and shipments of nondefense capital goods excluding aircraft plunged 1.5 percent in April – all in all, a messy beginning to the second quarter.

So once again we ask - given all of this 'weakness' or missing of Fed benchmarks- that the Fed is well aware of, why would so many members have been out discussing 'Taper' if it were not due to their concerns of broken markets and bubble conditions. We fear an equity market positioned far too enthusiastically given the risks of a disappointing Fed.

See the original article >>

The Limits to Panic

by Bjørn Lomborg

COPENHAGEN – We often hear how the world as we know it will end, usually through ecological collapse. Indeed, more than 40 years after the Club of Rome released the mother of all apocalyptic forecasts, The Limits to Growth, its basic ideas are still with us. But time has not been kind.

This illustration is by Pedro Molina and comes from <a href="http://www.newsart.com">NewsArt.com</a>, and is the property of the NewsArt organization and of its artist. Reproducing this image is a violation of copyright law.

Illustration by Pedro Molina

The Limits to Growth warned humanity in 1972 that devastating collapse was just around the corner. But, while we have seen financial panics since then, there have been no real shortages or productive breakdowns. Instead, the resources generated by human ingenuity remain far ahead of human consumption.

But the report’s fundamental legacy remains: we have inherited a tendency to obsess over misguided remedies for largely trivial problems, while often ignoring big problems and sensible remedies.

In the early 1970’s, the flush of technological optimism was over, the Vietnam War was a disaster, societies were in turmoil, and economies were stagnating. Rachel Carson’s 1962 book Silent Spring had raised fears about pollution and launched the modern environmental movement; Paul Ehrlich’s 1968 title The Population Bomb said it all. The first Earth Day, in 1970, was deeply pessimistic.

The genius of The Limits to Growth was to fuse these worries with fears of running out of stuff. We were doomed, because too many people would consume too much. Even if our ingenuity bought us some time, we would end up killing the planet and ourselves with pollution. The only hope was to stop economic growth itself, cut consumption, recycle, and force people to have fewer children, stabilizing society at a significantly poorer level.

That message still resonates today, though it was spectacularly wrong. For example, the authors of The Limits to Growth predicted that before 2013, the world would have run out of aluminum, copper, gold, lead, mercury, molybdenum, natural gas, oil, silver, tin, tungsten, and zinc.

Instead, despite recent increases, commodity prices have generally fallen to about a third of their level 150 years ago. Technological innovations have replaced mercury in batteries, dental fillings, and thermometers: mercury consumption is down 98% and, by 2000, the price was down 90%. More broadly, since 1946, supplies of copper, aluminum, iron, and zinc have outstripped consumption, owing to the discovery of additional reserves and new technologies to extract them economically.

Similarly, oil and natural gas were to run out in 1990 and 1992, respectively; today, reserves of both are larger than they were in 1970, although we consume dramatically more. Within the past six years, shale gas alone has doubled potential gas resources in the United States and halved the price.

As for economic collapse, the Intergovernmental Panel on Climate Change estimates that global GDP per capita will increase 14-fold over this century and 24-fold in the developing world.

The Limits of Growth got it so wrong because its authors overlooked the greatest resource of all: our own resourcefulness. Population growth has been slowing since the late 1960’s. Food supply has not collapsed (1.5 billion hectares of arable land are being used, but another 2.7 billion hectares are in reserve). Malnourishment has dropped by more than half, from 35% of the world’s population to under 16%.

Nor are we choking on pollution. Whereas the Club of Rome imagined an idyllic past with no particulate air pollution and happy farmers, and a future strangled by belching smokestacks, reality is entirely the reverse.

In 1900, when the global human population was 1.5 billion, almost three million people – roughly one in 500 – died each year from air pollution, mostly from wretched indoor air. Today, the risk has receded to one death per 2,000 people. While pollution still kills more people than malaria does, the mortality rate is falling, not rising.

Nonetheless, the mindset nurtured by The Limits to Growth continues to shape popular and elite thinking.

Consider recycling, which is often just a feel-good gesture with little environmental benefit and significant cost. Paper, for example, typically comes from sustainable forests, not rainforests. The processing and government subsidies associated with recycling yield lower-quality paper to save a resource that is not threatened.

Likewise, fears of over-population framed self-destructive policies, such as China’s one-child policy and forced sterilization in India. And, while pesticides and other pollutants were seen to kill off perhaps half of humanity, well-regulated pesticides cause about 20 deaths each year in the US, whereas they have significant upsides in creating cheaper and more plentiful food.

Indeed, reliance solely on organic farming – a movement inspired by the pesticide fear – would cost more than $100 billion annually in the US. At 16% lower efficiency, current output would require another 65 million acres of farmland – an area more than half the size of California. Higher prices would reduce consumption of fruits and vegetables, causing myriad adverse health effects (including tens of thousands of additional cancer deaths per year).

Obsession with doom-and-gloom scenarios distracts us from the real global threats. Poverty is one of the greatest killers of all, while easily curable diseases still claim 15 million lives every year – 25% of all deaths.

The solution is economic growth. When lifted out of poverty, most people can afford to avoid infectious diseases. China has pulled more than 680 million people out of poverty in the last three decades, leading a worldwide poverty decline of almost a billion people. This has created massive improvements in health, longevity, and quality of life.

The four decades since The Limits of Growth have shown that we need more of it, not less. An expansion of trade, with estimated benefits exceeding $100 trillion annually toward the end of the century, would do thousands of times more good than timid feel-good policies that result from fear-mongering. But that requires abandoning an anti-growth mentality and using our enormous potential to create a brighter future.

See the original article >>

Cotton mixed as buyers wait for pullbacks

By Jack Scoville

COTTON

General Comments: Futures were mixed, with a lot of spreading and position liquidation noted as July deliveries start today. But, the USDA reports from last week kept the buyers interested on setbacks. Traders talk of reduced production potentially due to the poor weather seen until recently in the Delta and Southeast and still reported in parts of Texas. Trends are up. Ideas of good weather for U.S. crops are still around. Traders are worried about Chinese demand, but there is talk that overall demand increased in the last week. The weather has improved, but it is still too dry in Texas and drier weather is needed for the Delta and Southeast. Dry conditions are forecast for the Delta and Southeast, and dry and warm weather is expected in Texas. Weather for Cotton appears good in India, Pakistan and China.

Overnight News: The Delta and Southeast will see some showers this week. Temperatures will average above normal. Texas will get dry weather. Temperatures will average above normal. The USDA spot price is now 87.10 ct/lb. ICE said that certified Cotton stocks are now 0.543 million bales, from 0.539 million yesterday.

Chart Trends: Trends in Cotton are up with no objectives. Support is at 89.60, 88.20, and 87.55 October, with resistance of 90.80, 91.40, and 92.00 October.

FCOJ

General Comments: Futures closed higher in consolidation trading to end the week. USDA lowered production of Oranges in Florida, but decreased production had been expected. Traders are wrestling with more reports of losses from greening disease on the one side and beneficial rains that have hit the state on the other. Greening disease and what it might mean to production prospects continues to be a primary support item and will be for several years. Temperatures are warm in the state, but there are showers reported somewhere in the state every day now. The Valencia harvest is continuing. Brazil is seeing near to above normal temperatures and dry weather.

Overnight News: Florida weather forecasts call for light showers. Temperatures will average near to above normal.

Chart Trends: Trends in FCOJ are mixed. Support is at 148.00, 145.00, and 144.00 July, with resistance at 154.00, 156.00, and 159.00 July.

COFFEE

General Comments: Futures were lower in New York on speculative selling tied to ideas of big Brazil and Colombia production. London was higher on some short covering to end the week, but remains in down trends due to ideas of big supplies from producers, mostly from Vietnam. London futures appear oversold as well. Arabica cash markets remain quiet right now and roasters in the US are showing little interest in buying. Buying interest could appear with this latest move lower. There is talk of increasing offers of Robusta from producers as they apparently did not sell when prices were much higher. Most sellers, including Brazil, are quiet and are waiting for futures to move higher. Buyers are interested on cheap differentials. Brazil weather is forecast to show dry conditions, but no cold weather. There are some forecasts for cold weather to develop in Brazil at the end of next week. Current crop development is still good this year in Brazil. Central America crops are seeing good rains now. Colombia is reported to have good conditions.

Overnight News: Certified stocks are little changed today and are about 2.746 million bags. The ICO composite price is now 116.22 ct/lb. Brazil should get dry weather except for some showers in the southwest on Sunday. Temperatures will average near to above normal. Colombia should get scattered showers, and Central America and Mexico should get showers. Temperatures should average near to above normal.

Chart Trends: Trends in New York are down with objectives of 116.00 July. Support is at 121.00, 119.00, and 116.00 July, and resistance is at 125.00, 127.00, and 130.00 July. Trends in London are down with objectives of 1765 July. Support is at 1770, 1740, and 1710 July, and resistance is at 1810, 1845, and 1865 July. Trends in Sao Paulo are down with no objectives. Support is at 147.00, 144.00, and 140.00 September, and resistance is at 155.00, 159.00, and 161.50 September.

SUGAR

General Comments: Futures closed sharply higher on what appeared to be short covering from speculators. Everyone talks about the big supplies, but reports of renewed demand interest helped rally the market today. July was higher as short speculators start to pull out of positions before the contract stops trading at the end of the month. There was no other real news for the market. The price action overall remains weak and implies that further losses are coming down the road due to coming Brazil supplies. Traders remain bearish on ideas of big supplies, especially from Brazil. Traders in Brazil expect big production as the weather is good. Demand is said to be strong from North Africa and the Middle East, but starting to fade now as needs are getting covered.

Overnight News: Showers are expected in Brazil. Temperatures should average near to above normal.

Chart Trends: Trends in New York are mixed. Support is at 1680, 1665, and 1650 October, and resistance is at 1730, 1760, and 1790 October. Trends in London are mixed. Support is at 469.00, 465.00, and 463.00 October, and resistance is at 477.00, 480.00, and 487.00 October.

COCOA

General Comments: Futures closed lower on what appeared to be a lot of speculative long liquidation. There was not a lot of news for the market, and price action reflected this. It looks like the buying was based on the charts as New York futures could not move to new lows and in fact have held at an important area on the charts. But, ideas of weak demand after the recent big rally kept some selling interest around. The weather is good in West Africa, with more moderate temperatures and some rains. The mid-crop harvest is moving to completion, and less than expected production along with smaller beans is reported. Malaysia and Indonesia crops appear to be in good condition and weather is called favorable.

Overnight News: Scattered showers are expected in West Africa. Temperatures will average near to above normal. Malaysia and Indonesia should see episodes of isolated showers. Temperatures should average near normal. Brazil will get mostly dry conditions and warm temperatures. ICE certified stocks are lower today at 5.084 million bags.

Chart Trends: Trends in New York are mixed to down with objectives of 2210 July. Support is at 2240, 2220, and 2190 July, with resistance at 2300, 2340, and 2380 July. Trends in London are down with objectives of 1405 July. Support is at 1460, 1430, and 1420 July, with resistance at 1490, 1500, and 1520 July.

See the original article >>

Funds cut gold positions as Paulson’s loss widens

By Elizabeth Campbell

Hedge funds cut wagers on a gold rally for the first time in three weeks on mounting speculation central banks will curb record stimulus and as this year’s slump in bullion spurred losses for billionaire John Paulson.

The funds and other large speculators lowered their net-long position by 4.1% to 54,779 futures and options by June 11, U.S. Commodity Futures Trading Commission data show. Net-bullish wagers across 18 U.S.-traded commodities rose 0.1%. Bearish copper bets more than doubled as the metal had its longest slump since November. Cocoa holdings advanced to the highest since 2008 before the biggest weekly slide since January.

The Bank of Japan left a lending program unchanged on June 11 and refrained from expanding its toolkit for tackling volatility in bonds. Federal Reserve policy makers meeting this week may discuss slowing $85 billion of monthly debt purchases amid signs of a sustained economic recovery. Gold surged 70% as the Fed bought $2.3 trillion of debt from December 2008 through June 2011. Paulson’s Gold Fund tumbled 13% in May, extending this year’s loss to 54%.

“There’s definitely a concern that if the Fed starts to remove the monthly purchases, that’s certainly signaling a strengthening in conditions, and that puts a bid into the dollar and certainly at the margin hurts gold,” said Ted Harper, a fund manager at Frost Investment Advisors LLC in Houston, who helps manage more than $9 billion of assets. Paulson’s “returns are emblematic of the difficult environment that gold investors have been facing,” he said.

Bear Market

Gold futures tumbled into a bear market in April and are now down 17% since the start of the year at $1,384.70 an ounce, heading for the first annual decline since 2000. Bullish bets slumped 78% from a record in August 2011 and the metal is 28% below its all-time high of $1,923.70 reached in September 2011. Prices advanced 0.3% last week.

The Standard & Poor’s GSCI Spot Index of 24 commodities rose less than 0.1% last week, while the UBS Bloomberg CMCI gauge of 27 raw materials lost 0.8%. The MSCI All- Country World Index of equities fell 0.7% and the dollar was down 1.2% against six major trading partners. A Bank of America Corp. index shows Treasuries returned 0.3%.

Asset Purchases

Fed Chairman Ben S. Bernanke said last month the central bank could curtail its bond purchases if the U.S. employment outlook shows a sustainable improvement. Policy makers will trim purchases to $65 billion a month in October, the median of 59 economist estimates compiled by Bloomberg this month shows.

Gold traders turned bearish for the first time in a month, with 18 analysts surveyed by Bloomberg anticipating declining prices this week. Fourteen were bullish and four neutral, the largest proportion of bears since May 17.

Assets in global exchange-traded products backed by bullion fell 20% this year as some investors lost faith in the metal as store of value. U.S. consumer prices climbed 1.1% in the 12 months through April, according to a measure watched by the Fed that excludes food and fuel. That matches the smallest increase since records began in 1960. The World Bank raised its 2013 U.S. growth forecast to 2% on June 12, from a January prediction of 1.9%.

Paulson & Co.

Paulson & Co. said it has no intention of closing down its Gold Fund even after this year’s losses, according to a letter to investors obtained by Bloomberg News. The company recommended investors stay invested as valuations provide “significant upside.” Paulson is the biggest investor in the SPDR Gold Trust, the largest bullion ETP.

St. Louis Fed President James Bullard said June 10 that inflation below the central bank’s 2% target may warrant prolonging bond buying. The International Monetary Fund sees the Fed maintaining large monthly bond purchases until at least the end of this year and urged the central bank to carefully manage its exit plan to avoid disrupting financial markets in its annual assessment of the U.S. economy released June 14.

“If quantitative easing does continue for too long, that could certainly lead to inflation,” said Christopher Burton, a fund manager at Credit Suisse Asset Management in New York who helps oversee $10.8 billion in commodity related assets. That “would generally correspond to higher commodity prices,” he said.

Total outflows from commodity funds were $315 million in the week ended June 12, according to Ian Wilson, a managing director for Cambridge, Massachusetts-based EPFR Global, which tracks money flows. Investors withdrew $277 million from gold funds, according to EPFR.

Goldman Sachs

Gold will continue to slide over the medium term on a “re- acceleration” in U.S. growth and a further unwinding of ETF positions, Goldman Sachs Group Inc. said in a report June 12. The bank sees the metal trading at $1,345 in 12 months.

Bullish bets on crude climbed 9.5% to 232,273 contracts, the highest since March 27, 2012, CFTC data show. Crude prices added 1.9% last week, the second consecutive gain. Palladium holdings climbed for a fifth week, the longest streak since February. Prices in New York slumped 3.9% last week, the most since April.

Investors increased their net-short position in copper to 18,772 contracts, from 6,626 a week earlier, CFTC data show. Prices fell for a fifth week, the longest slump since Nov. 9. Supplies will outpace demand by 162,000 metric tons this year, from a surplus of 41,000 tons in 2012, Barclays Plc said June 14.

Farm Bets

A measure of net-long positions across 11 agricultural products climbed 5.9% to 321,537 futures and options, as soybean and cotton holdings gained. The S&P’s Agriculture Index of eight commodities dropped 6.3% last week, the biggest slide since September 2011.

Bullish corn positions fell 9.3% to 82,517 contracts, a three-week low, the CFTC data show. Prices lost 4.6% last week. U.S. production will jump 30% this year and more than double inventories before the harvest in 2014, government data showed June 12. Soybeans dropped 2.4% last week and July wheat futures declined 2.2%.

“There is a glut of supply,” said Stanley Crouch, who helps oversee $2 billion as chief investment officer at New York-based Aegis Capital Corp. “There’s still pretty slack demand. We’re going to have to grow our way into more demand. You’re not going to see the shortages that were feared.”

See the original article >>

Germany's Accidental Empire

By: Andrew_McKillop

THE HOLY ROMAN EMPIRE
Historians say the Holy Roman Empire was founded on Christmas Day 800 AD but its maximum power and reach was from about 1200 – 1750 AD, weakened by “turf wars” with the Ottoman Empire in the east and rivalry with Louis XIV of France in the west, Louis XIV being the cousin of the last great Holy Roman Emperor, Louis I of Hungary.

Usually not placed on the high ground by historian explaining the fall or dissolution of the Empire, its arcane and complex money and finance system, or systems also weakened it. For its core area – including today's Germany, Holland, Poland and Austria – the operating money systems were the Thaler-using, Guilden-using and Merck-using regions, but monetary control was woeful. Historians explain that while the 3 basic currencies remained stable in their correlation – and to a large extent in their international exchange rates – an immense chaos and instability held sway underneath this broad pattern. The coins issued by regional authorities of the Empire continuously changed in value. Some places had coherent systems of their own local minted coins, but others shared the coins of neighbouring territories or even the whole Empire.

Anyone thinking this sounds like the Eurozone and its north-south and east-west divides, is right.

Throughout the Empire, and beyond it, merchants and commercial activity spread the different moneys. Local authorities advised their citizens at what rates they should accept coins minted elsewhere, but top-down key events in the Empire's always troubled monetary history certainly include armed threat to the Empire from the Hussites – what can be called proto-Protestant zealots of eastern Europe. Prompted by Hussite threat, the Imperial Diet of 1422 held in Nuremberg created the Army of the Empire by demanding specific contingents of troops and payment for them from all parts of the Empire. After more than 12 years of war against the Hussites the Imperial Army put down their threat – but the Army was limited by how much money could be raised to pay for it. Regular high level meetings attempted to maintain funding, and therefore troop strength, but manning levels declined over the decades and then centuries. A special monetary unit – the Romermonat – was created to represent the monthly cost of maintaining the Imperial Army but this money unit, the Romermonat, suffered major inflation.

Today, European and international political commentators ask if Europe is now living in a modern German version of the Holy Empire, a German European empire?

HOLIER THAN THOU – AND LOW CARBON TOO
In multiple interviews requesting anonymity in return for speaking with media, for at least the past six months European Commission insiders paint a picture of intensely sharp divergences of opinions on German dominance of the European Union, the critically divisive effects of austerity policies, and the relevance of supposed “key uniting themes for Europe” ranging from the euro currency and the competitiveness fetish to the Holier Than Thou low carbon climate-energy policy of the Union.

But there is a first question.
How has Germany come to dominate the European Union?

The shock answer to this – but almost any honest German politician (therefore a tiny minority of German or any other politicians) will say so - this happened entirely by accident. Germany has created or acquired an ‘accidental empire’. Very logically there is no master plan; there is no intention to physically occupy Europe, and no abiding or core German interest in the Thaler-Guilden-Merck money system, presently bundled together and called “the euro”.

The Romermonat for a standing, unified, all-European Army of sufficient size to count on the world scene has been calculated – and is too high. The accidental German Empire does not have a military basis, so the talk about a re-militarized ‘Fourth Reich’ is simple anti-German hysteria mongering, reducing the empire to exactly what it is – an economic empire in dire straits. But this again does not especially concern Germany – it is not in dire straits even if the large majority of all other EU27 member states are in crisis – sometimes what looks like terminal economic crisis. For extremely powerful historical reasons, almost “race memory”, Germans have a horror of weak money, national debt, and debt disaster. Despite this, they are in the midst of one.

Germany lived its own monetary and economic catastrophe, all alone in 1922-1923 and the role of war debt and reparations payments until 1933 have a sombre place in the national psyche. Although this is a long way back, Germans have a low tolerance threshold for bad management of national finances. This leads to non-German accusations of the country being arrogant or smug – or Holier Than Thou.

In Germany and other parts of the not-so-holy European empire, forebodings and anticipation of a European catastrophe, with frankly stated fears that the Eurozone and even the European Union might break down or fly asunder, have caused the landscape of power in Europe to change fundamentally. Real and imaginary crises swirl across the TV screens of Europe, starting with the divide of Eurozone and non-Eurozone countries. These are drifting apart a lot faster than the world's tectonic plates. The example of the UK is especially tragi-comic. It is a member of the EU but not a member of the Eurozone and how “the zone” settles its own problems does not concern Britain, despite PM David Cameron trying to tell Europeans he is still “in charge of changing the European situation”. Non-Eurozone countries, not especially including or led by the UK, have tended to become strident about how much – that is how little – they intend to pay into any grand anti-crisis fund, or go on paying into current bail out operations. This split is also operating within the Eurozone countries, between the lender countries led by Germany, and debtor countries presently not led by anyone despite French pretentions that they have a credible “anti-austerity leadership policy”.

As a result, Germany the strongest economic country has become the most powerful EU state.

The question of whether austerity policies are dividing Europe does not need to be asked. The policy is economic suicide, only gives more and further ammunition to the Keynesians, and can easily provoke a breakdown of civil power and authority in the rising number of victim countries. This is of course very evident, but doing anything about it is not. Present austerity programmes are easy to call rank provocation because from a sociological point of view because they redistribute risk away from the banks, through the states, to the huge number of losers - the poor, the unemployed, the young and the elderly. This is an amazing new inequality layer added to the European economic empire's layer cake, but through only looking at it in national terms and categories the trees hide the forest.

PROTESTANT ETHIC – CATHOLIC ETHIC
Unremarked by most, the Eurozone-Rest of Europe divide is also religious. Nearly all the PIIGS countries of the Eurozone are deeply Catholic, while non-Eurozone countries and Germany are heavily dominated or influenced by Protestantism. At the same time there are two leading ideologies on austerity policies. The first one is the Angela Merkel consensus model, where decisions – even wrong decisions - always take a long time until some kind of consensus appears, also reinforcing the message that it is Germany which decides. To the extent this is a deliberate strategy, it can be interpreted as designed to send that message.

But this ignores why Germany takes so long to decide and unveils the second ideology. The Protestant Ethic dating from Martin Luther – a key player in the demise of the Holy Roman Empire's ideological unity – says that spending more money than you earn is not just a question of pragmatism, but also of underlying ethical values. Certainly since the time of the German sociologist – Max Weber – what can be called the sociological view embodied in the Protestant Ethic is also called 'pure economic rationality'. Holders of that economic orthodoxy see themselves as Protestant teachers instructing Catholic southern European countries on how to correctly manage their economies.

This has already created another ideological split because Protestant 'honest dealing' in no way squares with the robber baron ethics of the Cyprus bail-in, designed and operated with full German support. Worse still, the strategy does not seem to be working. Even more unsettling to Germans, they are cast as the lenders of last resort when TSHTF.

The ideological split cuts down a further layer by exposing the roles of chance versus planning. The Protestant Ethic is at the least risk averse. Even the mention of a term such as “the risk society” is shunned by any German politician wanting to be re-elected. At its simplest the reason for this is that the term ‘risk’ signifies that we know about and can cope with uncertainty, but “risk society” is a far more threatening and bigger concept evoking a situation where individuals and enterprises are not able to cope with “systemic” uncertainty and its unpredictable consequences. As German opinion polls show in the run-up to the Sept 2013 general elections, many voters fear that systemic risk is what the Eurozone – and even the Union – now means.

Risk aversion is castigated by a huge number of economists and political economists, especially American. For them, it is the denial of modernity. The history of western society and economic progress since the Industrial Revolution can be cast – at least until about the 1970s - as a long period during which there was plenty of room for experimentation. Errors were made, for sure, but modernity triumphed. Modern German political economists have a completely opposing view, saying that since the 1980s or before, and due to the success of modernity we now face consequences for which “there are no answers”, among them climate change and the urgent need for decarbonized energy.

FINANCIAL CRISIS – CARBON CRISIS
Climate change and the financial crisis are seen by an important segment of German intellectuals and political thinkers as fundamentally related. For them, the financial crisis is an example of the victory of a certain strand or interpretation of modernity, related to the still ongoing and unsuccessful remake of Western ideology since the fall of communism, where by default “the market” became the only solution for all problems. This neo-liberal solution said that the more we increase the role of the market, the better, but now we see that this model is failing and we don’t have any answers.

Drilling further down, for example to Goethe and Nietsche, the apocalypse streak in German culture jumps to the surface. Not making a distinction between a risk society, and a catastrophe society, can be explained by this. In a catastrophe society the motto is ‘always too late’, but in a risk society future catastrophes are anticipated in order to prevent them from happening. Unfortunately any imagined potential catastrophe is by definition not supposed to happen – the financial system could entirely collapse as the Eurozone unwinds, or several nuclear power plants could explode threatening the whole of Europe with fallout – but there is no way to experiment with this. Claiming the precautionary principle is paramount makes risk calculating impossible. We are supposed to anticipate something that “cannot happen”, which is an entirely new situation.

Staying in Germany and with the German psyche, Angela Merkel as recently as 2010 said she did not believe that Greece, Spain and other PIIGS countries posed a major risk to the Eurozone, or that nuclear power plants were risky, dangerous and expensive. In both cases, she made a “180 degree turn”, in the nuclear case a few weeks after the Fukushima disaster of March 2011.

The exact set of new responses, attitudes or values, policies and programmes that come out of the 180 degree turn do not -unfortunately- have to be the right and best ones. For sure, Merkel looked into the eyes of real or potential catastrophes and suddenly new things became possible. Already however, at most two years on from Angela's ideological coming out on Greece and nuclear power, the results are for the least ambivalent because they can be used different ways. Concerning the Eurozone crisis, they can be used to develop a new vision for Europe, or used to justify leaving the European Union. For nuclear power and Germany's Energiewende the supreme irony could be that Germany seeks to “Europeanize” the new debt racked up by de luxe energy transition.

Doing nothing until “consensus exists”, due to catastrophe, is for the least sloppy planning but we have to fear this behaviour is hard-wired into the human psyche, not only German society. But as German politicians are now able to say, and still hope to be re-elected, Europe was thrown together on a big pile of institutions, laws, and economic regulations coming faster and faster, but nobody asked what the European Union means for individuals. What do individuals gain from the European project? Answering that question is becoming the new and real challenge, over and above the thrilling fireside chat about catastrophes, but with frighteningly sure and certain panic whenever, or if ever a real catastrophe arrives.

See the original article >>

Western Governments Diffuse Gold Bull Market With Central Banks Supply

By: Andrew_McKillop

There has been considerable throughput of gold in western capital markets, with substantial buying from all round the world following the April price crash. The supply can only have come from two sources: the general public, or one or more governments. It really is that simple. Two months later the gold price has only partially recovered, so physical supplies have continued to be made available. Physical demand cannot have been entirely satisfied by ETF liquidations, confirming governments are involved. This article looks at the dynamics of the gold market around this event and the implications.

While the investing public in the western nations has been generally stunned following the April price smash, demand from Asia is running at record levels, illustrated in the chart below, which is of physical gold deliveries on the Shanghai Gold Exchange. (Thanks due to @KoosJansen for pointing me to the data on the SGE’s Chinese website).

The increase in deliveries for April and May was spectacular, totalling 460.5 tonnes, with the week ending 26 April alone seeing phenomenal deliveries of 117 tonnes. In addition, according to the Economic Times, India imported 142.5 tonnes in April and 162 tonnes in May, compared with an average monthly rate of 86 tonnes in Q1 2013. Therefore these two countries imported 765 tonnes of gold in two months, before considering any unofficial imports or their government purchases in foreign markets. The rest of Asia, from Turkey to Indonesia would certainly have stepped up their demand for gold as well, as did the western world itself for physical metal as opposed to paper entitlements.

The table below puts this into context.

A prefatory note about the statistics in this table: there is no single defined source of statistics on gold movements, and there are considerable variations in the same numbers reported by different organisations. The figures in the table above can only illustrate bullion flows. I have sourced the statistics from official sources where possible. The cash-for-gold business has had the easy pickings by now, so an assumption that this is about 600 tonnes per annum is I believe cautiously over-generous. It is based on a speech made by Jeffrey Rhodes of INTL Commodities DMCC to the LBMA in 2010, when he identified scrap supply as 583 tonnes in North America and Europe, whose central banks are in the gold suppression business. At that time, 1,091 tonnes were recycled in the East, including Turkey. Since the Chinese, Russian and other gold-producing governments of Central Asia retain most if not all of their domestically mined gold amounting to over 700 tonnes, there is less than 2,000 tonnes of free mine supply annually available for global markets, based on US Geological Survey figures.

Looking at the bottom line for 2012, there were only 87 tonnes of gold supply for the rest-of-the-world, after Asian and Russian central bank and global ETF purchases. In other words, there must have been a severe deficit overall, which can only have been covered by central bank sales.

About 150 tonnes of ETF gold were liquidated in Q1, providing temporary relief until the Cypriot crisis, when concerns over the security of large deposits in eurozone banks prompted a flight into physical gold, but interestingly, not into ETFs. This was because there were escalating systemic concerns over having physical gold and currency deposits with European banks, while at the same time portfolio investors were worried that the 12-year bull market might have ended.

From the point of view of the western central banks, as well as the bullion banks with short positions on Comex, in March the alarm bells must have been ringing loudly. Chinese demand was accelerating and there was an increasing likelihood that ETF liquidation would cease if the gold price stabilised. If that happened, as the table above clearly shows, an epic bear-squeeze would likely develop, fuelling a rush into gold and potentially bankrupting many of the bullion banks short in the futures markets and/or offering unallocated accounts on a fractional reserve basis.

Therefore, investors had to be dissuaded from buying gold, otherwise the ensuing crisis would not only cause a market failure that could spread to other derivatives (particularly silver), but it would come at the worst possible time, given the coincidental programme of monetary expansion currently being undertaken by all the major central banks.

The reasons for governments to intervene on the side of the bullion banks were therefore compelling. As one would expect, the intervention was well-timed: on Friday 12 April two large sell orders of 100 and 300 tonnes were placed on Comex, clearly designed to do maximum damage to the price, and setting it up for all remaining stops to be taken out the following Monday. Furthermore, central banks were prepared to supply physical gold to keep the price from recovering. We know this because lower prices generated a surge in private demand, not only in China and India, but from everywhere. The only possible supply, other than inadequate ETF liquidation, is from governments.

India and China have absorbed enough gold in the last two months of April and May to leave the rest of the world in a supply deficit, requiring matching sales of western government gold to continue to suppress the price.
The future

We now know for certain that government-controlled gold has been used to defuse a developing crisis in gold markets that had the potential to destabilise bullion banks, other derivative markets and ultimately the whole fiat currency system. We have seen the surge in demand for physical gold, which is the consequence of sharply lower prices. Realistically, the priority has been to ensure such a crisis is avoided, rather than for the price of gold to be continually suppressed.

The difficulty for the casual observer is compounded by the available information being one-sided. We are all painfully aware of both the losses inflicted on investors and their loss of faith in gold at a time when other investment media, such as stocks and bonds, have been doing well. Concealed from us is the real financial condition of the banks and governments themselves, which is the fundamental reason for owning gold. We are acutely aware of the sellers’ pain and only dimly aware of the buyers’ motivation.

Nervous western investors in a market of 160,000 tonnes are in truth a small part of the whole, particularly since gold has been migrating from the west to the east where it has been more valued ever since the 1970s oil crisis. More fundamentally we know that the stock of gold grows at about 1½% annually in line with global population growth. We also know that central banks everywhere are expanding their balance sheets at an accelerating rate. The disparity between the rate of growth for gold and paper currencies will certainly lead to increased tensions between precious metals and currencies generally, and it is this that will drive future demand for gold, not whether or not western investors think it is in a bull or bear market.

A second point about the market being 160,000 tonnes and not just the sum of mine and scrap supply is that the market is far bigger than western governments’ gold reserves. Gold held by them is officially about 19,000 tonnes, but it may well be only half that, or 5% of the aboveground stock, when unrecorded leasing and selling over the last 25 years are taken into account. The ability of central banks to contain a global surge in gold demand such as that which followed the April price-crash and continuing to this day is therefore limited.

But this is only a part of the story. There are the factors concealed from us, such as the buying opportunity given to gold-friendly governments and sovereign wealth funds, both with surplus dollars, as well as the appetite for gold from the growing ranks of the Russian and Asian mega-rich. There are factors known to the financially savvy, such as the growing instability of the Indian rupee and other emerging market currencies, the increasing systemic risks in eurozone banks with the threat posed to deposits, and the revenue shortfalls that force governments to raise money by printing their currencies at an increasing pace: all will impact the gold market in coming months.

These and other systemic problems are deteriorating. A potentially destabilising crisis in the gold market from runaway prices has been defused by allowing the bullion banks the space to square their books. There can be no other realistic objective in supplying government-owned gold into the market. As to the embarrassment of the gold price rising at a time of accelerating money printing – that will have to be accepted, presumably emphasising the official line, that the gold price is irrelevant to a modern economy.

See the original article >>

Gold Market - Pieces Of The Puzzle!

By: Robert_M_Williams

Over the last several weeks I’ve received a lot of e-mails asking about gold. Half want to know if they can buy gold and/or gold stocks here, and the other half are demanding a pronouncement as to whether or not the bull market in gold is over. After all, if you hear it on Bloomberg from Betty Liu it must be true! Personally I don’t like it when the mainstream media tries to make the news instead of simply reporting the news. Unfortunately, we’ve been conditioned to let the media do our thinking for us and that includes everything from who should be President to which stock we should buy. Edward R. Murrow must be turning over in his grave as he stares down and listens to what passes for news today.

I want first to deal with the question as to whether or not the bull market in gold is alive and well. In order to answer that we need to look at an historical chart showing the entire move up:

Here you can see that the primary trend remains intact in spite of the reaction (secondary trend) that has been going on since the September 6, 2011 all-time high of 1,923.70. Inversely that implies that the secondary trend has been declining for slightly more than twenty-one months, and that is the longest such decline since the bull market began way back in 1999. As it stands the reaction has retraced almost exactly 33.3% of the gains that go back to the aforementioned bottom.

The path and timing of the secondary trend is a bit more complicated. Here you have a closer look at the reaction:

You can see the last leg up that ran from 681.00 to the 1,923.70 all-time high as well as the current reaction that has retraced close to 50% of that last leg. The questions that face us now are:

  • Is the current reaction over and if not,
  • At what price will the bottom occur, and
  • When will the bottom occur?

I have been saying for more than two months that the 1,321.50 low posted on April 16th is not the low and we still have more downside to come. One very good reason is

wrapped up in this chart. This is a Point & Figure chart of gold and it shows a huge vacuum between what was critical support at 1,520.10 and current support at 1,087.50. I honestly didn’t think the support at 1,520.10 could be broken, but once it fell I had to look at the vacuum and accept that gold could fall all the way down to the 1,087.50 support from a 50% retracement of the entire bull market.

Given all that I’ve said, I do recognize the possibility that gold could stop at the 1,302.30 support from a 50% retracement of the last leg down, but I doubt it. I think that void must be filled and I believe it will happen on or about the second anniversary of the September 6, 2011 all-time high. Significant tops and bottoms quite often occur on a 90-day increment and the two-year interval falls within that parameter. If in fact gold was going to a slightly lower low at 1,302.30 it would more than likely occur well before the September 6th date, so that’s another reason I see gold going down to 1,087.50, i.e. it fits the most likely time frame. Finally, if we assume that the reaction will end in September it also fits that we need to see significantly more than the current 33% retracement given all the time that’s passed. The 33% is just too shallow.

I want to close with a look at the anti-gold also known to most of you as the US dollar. The greenback has been grinding higher for almost two years and recently began a reaction as you can see below:

The reaction is now close to the support from the historical low at 80.16 and I am looking for a bounce and one last run higher before it fizzles for good. That top could come in anywhere from decent resistance at 85.17 (not shown) and strong resistance at 87.25. An early September bottom in gold gives all of that time to happen.

In conclusion, there is nothing wrong with gold. The bull market is intact and we are currently in the final phase of a reaction. Without a doubt the reaction has run longer and cut deeper than we would have liked and our patience has been exacerbated by greed and visions of golden trees growing to the sky! Another leg down to a lower low will only serve to squeeze out the last of the investors hanging on by their fingernails, and it will create a black as night atmosphere where absolutely no one wants to hear about gold. That of course is what a true bottom looks like and that’s when you should be buying. If you want to know when to buy simply watch for Bloomberg’s Betty Liu nailing the coffin shut on the last gold bull!

This Point & Figure chart is the work of Jon S. Strebler and was published in Richard Russell’s Dow Theory Letters on April 9th. In my opinion it was a brilliant insight that no one else saw coming.

See the original article >>

Can Bernanke Keep the Rally Going?

by Graham Summers

The markets are rallying today because Bernanke and the Fed meet on Wednesday and will announce their new policies (if any).

Someone might want to explain to them that the Nikkei just collapsed in spite of Central Bank policy. The bank of Japan announced it would buy $1.4 trillion worth of assets (roughly 25% of Japan’s GDP) in early April. The Nikkei has already wiped out almost all of the gains since that time.

Still, US bulls continue to hope that Bernanke will engage in even more QE, despite the fact the Fed has an $85 billion per month QE policy in place already, which comes to over $1 trillion in QE per year.

Given that the Fed’s balance sheet is already over $3 trillion and will be over $4 trillion within 12 months, one has to wonder just what Bernanke can do. His best bet is to retire in January and let someone else try and manage the mess he created.

So let’s see what happens on Wednesday. The markets will likely rally until then on hopes of more juice from Bernanke. But if he should disappoint at all (read: not announce something more or at least strongly hint at doing so) then buckle up.

See the original article >>

The VIX and the Pre-FOMC + Post-FOMC Trades

by Bill Luby

Back in December 2008, in VIX Trends Around FOMC Announcement Days, I posted a chart of the average movements in the VIX in the ten trading day leading up to and following “Fed Days,” otherwise known as days in which the Federal Open Market Committee (FOMC) makes its policy statement announcement. Several long-time readers who recall that chart – and an earlier incarnation from VIX Price Movement Around FOMC Meetings – have recently asked for an updated version. With all eyes on the Fed’s statement and Ben Bernanke’s press conference on Wednesday, this seems like a good time to revisit how the VIX moves in the days leading up to and following FOMC announcements.

In the chart below, I have normalized VIX data going back to 1990 to make it easy to compare the mean daily changes in the VIX in the ten trading days preceding FOMC policy statement announcements as well as ten trading days following those announcements. The quick takeaway is that the data from the last five years has been consistent with the data as of 2008. There are still three dominant features in this chart:

  1. a pre-FOMC VIX ramp in which the VIX tends to move up sharply in the three days leading up to the FOMC announcement and trend up more gradually 1-2 weeks in advance of the announcement
  2. a sharp decline in the VIX averaging about 2.6% on the day of the FOMC announcement, with a gradual decline in the VIX of another 1.0% or so in the two days following the announcement
  3. a sharp rebound in the VIX that starts three days after the FOMC announcement and persists until nine trading days after the announcement

Over the course of the past five years, the pre-announcement ramp in the VIX has been steeper during the three days prior to the announcement and more gradual in the week or so prior to that period. Also, recent history has seen the post-announcement decline in the VIX extending two additional days to now span four days following the announcement.

Of course there is no reason to expect that patterns which have persisted for the past 33 years to magically reappear for each FOMC announcement going forward, but I do believe that the historical pattern does say something about human nature, uncertainty and perceptions of risk.

It is worth noting that the biggest one-day jump in the VIX on a Fed day dates from February 4, 1994, when Federal Reserve Chairman Alan Greenspan surprised the markets by announcing a 0.25% increase in the federal funds rate, helping to lift the VIX 41.9% on that day. For comparison purposes, the next largest Fed day VIX increase was a 15.1% gain on March 15, 2011. While another VIX pop may be in the cards, history says there is a 72% chance the VIX will decline on Wednesday and that the decline should average about 2.6% or about 0.44 based on the current level of the VIX.

What is the trade here? While many will undoubtedly try to guess the direction of Wednesday’s move, the three other trades with a historical bias include:

  1. an increase in the VIX in advance of Wednesday’s announcement
  2. a continuation of any decline in the VIX from Thursday to Monday
  3. a new uptrend in the VIX beginning on Monday or Tuesday and running through the beginning of July.

[source(s): CBOE, Yahoo, VIX and More

See the original article >>

Percent of indicators at bearish extremes drops off for S&P 500.

by Chris Kimble

CLICK ON CHART TO ENLARGE

Shared the sentiment chart above last week with Members, reflecting that the percentage of indicators at bearish extremes was declining a good bit of late despite a small decline in the S&P 500. It was info like this that caused me to harvest gains in our international short positions we had.

Ironic the level of percent of indicators at bearish extremes happens to be nearing where a few market lows have taken place over the past couple of years. Will it be different this time or has too many investors become too bearish too fast again?

See the original article >>

Market relationships offer insight into recent turns

By Jeff Greenblatt

This is a market of relationships. For a long time we had an inverse working with equities and the US Dollar. In May 2011 the SPX hit a high while the Greenback hit its low. Since then both are closer to the top of the ranges. If I showed you a weekly chart you’d see a lot of flat weeks for the Dollar where the stock market didn’t decline. For instance, from February to May 2012 the Dollar was mostly flat while the stock market was straight up and had one of that aborted correction.

So it is the Greenback and Aussie Dollar both are in recent tailspins. This can’t last since the Aussie Dollar represents the risk on trade. Then we have the ultimate inverse relationship where we used to have the Greenback moving in opposite directions against the Gold market. But recently the Dollar fell hard but Gold has been unable to rally. This is a concern for Gold bugs mostly because the Gold market and later the XAU have exhibited some of the best Gann symmetry we’ve seen in recent memory. But in the economy, if the Dollar gets hit doesn’t that mean inflation? If we are too have a serious bout of inflation, why isn’t Gold going through the roof? What do we make of this relationship?

But the most important relationship we’ve had recently is the level of fear in the overall market compared to the 50 day moving average in the SPX.

We have the end of February, April 18 and now on both the SPX and VIX. What you see are 3 peaks in the VIX which is the same approximate fear or should I say complacency level as the equity index hits the 50dma. It’s just a market that’s getting used to the same old, same old. The VIX can’t break thru and the SPX refuses to break down. This is a classic buy the dip mentality and it’s becoming ingrained.

Last week I mentioned the buy the dip mentality and wondered out loud how many times they can go to the well without getting burned. It’s all becoming too predictable, easy. For a time this is the way markets are supposed to work. You are supposed to have a little butterfly in the tummy as you buy the 50. But now it’s like we’ve reached the point of the Wal-Mart red light special. So I’m satisfied that I’m getting my answer. The takeaway here is even if this market goes to new highs; we’ve already had a retest of the 50 only days after the original. This is a freight train market that won’t reverse on a dime. Fine, it doesn’t have to. But we are starting to see the cracks in the armor. I don’t have to look at an ADX to see the trend weakening. All I have to do is see that we are not getting a clean break away from the 50 like in the past.

There are a couple of reasons for this. First of all, the housing sector has shown some serious cracks as well. This rally is not going to survive without a good HGX. It doesn’t have to lead to the upside but it certainly can’t lead to the downside. So there’s your big relationship. If we can’t have a neutral housing market we are not going to have a rally.

Then we have the situation in Europe which has been leading to the upside since December. When our markets were wondering what would happen with the fiscal cliff, Europe didn’t seem to care. But the FTSE had a serious hiccup last week. Look at the chart, where’s the bounce? We didn’t have one. It’s amazing the US markets did as well as they did while European markets were dead in the water. Now it appears we could have what amounts to a 3rd wave low so I suspect this could be a neutral to decent week all the way around but here’s the next problem. If we bounce to start the week it opens the door for an inversion high as we hit the seasonal change point by Thursday. I’m almost rather see a wipeout the early part of the week because it would increase the probability we can have a real low as June 21 hits. But when I look at the situation in the SPX and VIX, it’s just not very likely to happen.

Let’s project is a little forward on the FTSE. What we have here is a test of the 200dma already looming in the not too distant future. They haven’t respected the 50 very much, have they? We have that 50/200 cross already working and you can see the 50 line rolling over. That’s trouble in anyone’s book. What does that do for our bigger time windows in the fall? It’s too soon to tell but if we manage to stay flat in Europe the time window later in the year could be a major inflection point one way or the other.

So as they wrestle to determine whether the SPX 50 day crumbles now or on the next spin cycle fear levels are going to have to rise above resistance here as well to get to an acceptable point where we can have a true bottom and a new sustainable move. I just don’t see it right now.

Finally, the EUR-USD had interesting calculations as it hit our target trend line. It has backed off the high but is only going sideways in what could be a triangle. We still can’t rule out one more high. We have a Fed meeting on tap to go along with the seasonal change point. I believe we have the capability of still being all over the map. We could still end up with a new high but when all is said and done, the real takeaway to this entire market is Europe not confirming whatever decent action in the US last week and the SPX not coming off the 50 in a clean manner. It might take some serious patience but I think we are going to see implications from this action sooner as opposed to later and quite possibly right after the seasonal change point. Simply put, I think it’s time for a bigger correction.

See the original article >>

Stock Markets Risks Unacceptably High and Rising

By: Brian_Bloom

Post GFC, US corporate profits have been very likely rising for reasons that are more related to cost savings and margin increases than to real revenue growth. These cost savings have now worked their way through the system and future US corporate profit growth will be more dependent on price inflation and/or sales volume growth.

US balance of payments may improve as a result of improved energy exports but, because the country is now oriented to a service economy, any growth in export volumes of manufactured goods is unlikely to impact significantly on the economy as a whole. In any event, with the rest of the world in recession, the likelihood of a growth in export volumes is low. With government spending sequestered, an implication is that employment opportunities will have to be driven by private enterprise.


With the above in mind, the fact is that employment has not been growing as a percentage of population. At best, it seems that employment growth is likely to remain close to population growth.

It follows that any price increases at the corporate level are likely to be offset by falls in volume. Further, because real consumer wage rates have been flat to falling, and because over two thirds of the US economy is driven by consumer spending, overall growth in nominal corporate revenues seems likely to be benign.

Finally, the reality is that the main impact of Quantitative Easing has been to drive up investment asset prices. This served to underpin an improvement in consumer and business sentiment which, in turn, prevented an economic collapse. However, Price/Earnings ratios are now once again in the “overvalue” range. A continuation of QE will likely push the P/E ratios to “bubble” levels which will be extremely counterproductive.

Overall, therefore, because overvalue P/E ratios can typically only be justified by high profit growth rate expectations and because US corporate profit growth is likely (at best) to be flat for the foreseeable future, the US equity markets are now looking extremely vulnerable. An adjustment to “fair value” P/E ratios will imply at least a 20% fall in the US stock market assuming revenue volumes do not decline.

Unfortunately, given that QE served to underpin consumer confidence because of rising asset prices, it follows that falling assets prices will likely serve to undermine consumer confidence and to increase savings levels. The flip side of this is that corporate sales volumes (and profits) will be experiencing downward pressure. The above reasoning leads to the overall conclusion that the US equity markets have probably peaked and may fall significantly in the foreseeable future.

***********

The monthly chart below of the SPX (courtesy decisionpoint.com) gave a technical “buy” signal when it broke to a new high a few weeks ago. But the core question is whether the rise from the low of 800 since early 2009 was a result of the Quantitative Easing. If so, then the latest technical buy signal may be false.

Chart #1 – Monthly chart of S&P 500Industrial Index

There is a limit to how far corporate profits can rise as a consequence of financial engineering. At the end of the day, profits flow from a simple formula:

Revenue – costs = profits

There is no doubt that corporate profits have been rising in recent times but the question that needs to be addressed is: What has been driving this rise?

1. Has it been falling costs or rising revenues?

2. If rising revenues, has this been driven by price (and margin) increases or by volume increases?

Common sense dictates that if profits have been rising for any reason other than increased volumes of sales, then continuing profit increases will be unsustainable.

Employment Costs

Historically, manufacturing productivity in the US has been increasing because of increasing automation

Chart #2: US Production output vs Employment numbers

But the US is no longer a manufacturing oriented economy.

Chart #3: Goods vs Service Industry Employment in the US

Source: http://www.careergravity.com/goods-vs-service-industry-employment-trends-chart-of-the-week/

Employment in general in the US did not rise in May 2013 and the percentage of the population that is employed has generally been flat for the past 12 months.

Quotes:

· “Both the number of unemployed persons, at 11.8 million, and the unemployment rate, at 7.6 percent, were essentially unchanged in May.”

· “Total nonfarm payroll employment increased by 175,000 in May, with gains in professional and business services, food services and drinking places, and retail trade. Over the prior 12 months, employment growth averaged 172,000 per month.”

· “The employment-population ratio was unchanged in May at 58.6 percent and has shown little movement, on net, over the past year.”

(Source: http://www.lanereport.com/21880/2013/06/u-s-unemployment-rate-up-slightly-to-7-6-percent/ )

Importantly, labour costs are now back to where they were before the Global Financial Crisis.

Chart # 4: US Labour Costs 1982 - 2013

Source: http://www.tradingeconomics.com/united-states/labour-costs

Finally, there is an upward pressure on hourly labour rates – albeit fairly benign at present:

Quote:

· “In May, average hourly earnings for all employees on private nonfarm payrolls, at $23.89, changed little (+1 cent). Over the year, average hourly earnings have risen by 46 cents, or 2.0 percent. In May, average hourly earnings of private-sector production and nonsupervisory employees, at $20.08, changed little (+1 cent). (See tables B-3 and B-8.)”

(Source: http://www.lanereport.com/21880/2013/06/u-s-unemployment-rate-up-slightly-to-7-6-percent/ )

Interim Conclusion #1

Overall, corporate costs savings associated with lower labour costs post GFC has probably ended.

Cost of Capital

It seems clear from the chart below that interest rates have probably bottomed and that, therefore, corporate cost savings flowing from lower interest rates have probably ended.

Chart # 5: 30 Year Bond Yield

Source: Decisionpoint.com

Transport Costs

Corporate savings flowing from lower transportation costs post GFC have very likely ended, as can be seen from the following chart.

Source: http://www.forecast-chart.com/inflation-transportation-cost.html

Chart # 6: US Transport Cost Inflation

Energy Costs

Although energy costs per kW hour have been falling in real terms, because US industry has become increasingly service oriented, these falling costs are likely to be more beneficial to consumers than to US corporations.

Chart #7: Average Retail Price of Electricity in the US

(Source: http://www.eia.gov/totalenergy/data/annual/showtext.cfm?t=ptb0810 )

Occupation Costs

Commercial real estate prices have been rising, which implies that any post GFC costs savings in this area have now ended and, if business conditions improve, there will likely be an upward pressure on occupation costs.

Chart #8: US Commercial Real Estate Prices

Source: http://www.td.com/document/PDF/economics/special/USCommercialRealEstate.pdf

From a different perspective, it seems that any occupation cost benefits from falling domestic real estate prices have also worked their way through the system and consumer disposable incomes will be under pressure because of rising interest rates and rentals.

Chart #9: Domestic Real Estate Prices

Source: http://www.jparsons.net/housingbubble/

The chart below is noteworthy for the two spikes that have occurred post GFC. Although the savings rate is now just over 2%, the first spike took it to over 8% and the second took it to over 6%. The chart, overall, shows a “rounding bottom” formation, which implies that sentiment is turning. On balance, it seems that the US consumer – who has historically been the driver of sales volumes in the US economy – is now becoming conservative.

Chart #10: US Personal Savings Rates – 1982 – 2013.

Source: http://www.tradingeconomics.com/united-states/personal-savings

Finally, all the above needs to be seen in context of Price/Earnings ratios on the equity markets. The chart below shows that P/E ratios are in the overvalue range.

Chart 11: S&P Index relative to normal P/E Range

Source: DecisionPoint.com

Overall Conclusion

Flowing from Quantitative Easing, P/E ratios are in overvalued range which, in turn, suggests that investors have an exaggerated optimism regarding the future growth rate of corporate profitability. However, this optimism seems to be misplaced and US equity prices are vulnerable for three reasons in particular:

1. Because the US economy is service oriented and because export opportunities are limited by moribund offshore economies, and because government spending is now subject to sequester, US unemployment rates cannot be expected to fall significantly from current levels.

2. Average hourly pay rates have been flat and there is no reason to expect them to rise in real terms

3. There is evidence that consumers – who are the primary drivers of US economic activity - are becoming cautious about the future

Because QE had an artificially positive impact on the US economy, if share prices fall from this level this will very likely have an exaggerated negative impact on consumer confidence. In turn, this will place a downward pressure on corporate revenues and profits. In turn, it seems likely that we are facing downward pressure on Price/Earnings ratios.

Risks associated with equity investment seem unacceptably high and are rising.

See the original article >>

Fed and Flash PMIs Dominate the Week Ahead

by Marc to Market

The Federal Reserve meeting that concludes Wednesday is the most important event of the week. There are now few participants, if any, that expect the Fed to reduce its long-term asset purchases now or even next month. Many see the September as a more likely time frame and a recent poll found the median expectation for tapering to take place in October.

There are three aspects of the Fed's meeting that will garner attention. First is the statement itself. We suspect there will be little there to suggest change in QE. There are unlikely to be significant changes in the economic assessment. There may be some minor tweaks in the language. For example, the easing of price pressures may be noted in stronger terms that the last statement's recognition that inflation was "somewhat below" the FOMC's long-term objective.

Second, the Fed will provided updated forecasts. These may be more important than usual as it is part of the Fed's forward guidance. If the Fed is to taper off its asset purchases, ideally, it would be reflected in anticipation of quicker growth, a faster decline in unemployment, and/or high inflation. Yet, we expect little change in the forecasts, and, if anything, it may shave this year's growth forecast from the 2.3%-2.8% pace forecast in March. The unemployment rate was forecast at 7.3%-7.5% this year and in May it stood at 7.6%. We look for little change there. The core PCE deflator forecast was 1.5%-1.6%. In April it stood at 1.1%. There does seem to be scope for the Fed's forecasts to be shaved a bit.

Third, Bernanke will hold his post-meeting press conference. We expect his prepared remarks to avoid specifics about tapering, except to note that 1) tapering is not the same as tightening and 2) the Fed's decision is data dependent. We see the recent tapering talk as an effective exercise of forward guidance that succeeded in removing or at least diminishing the risk of asset bubbles being fueled by the Fed's continued purchases.

The ECB has also been engaged in a successful forward guidance exercise. The talk of being "open-minded" about a negative deposit rate appeared to have helped give the 25 bp refi rate cut greater impact insofar as it suggested the ECB can still do more. This week's main euro zone data will be the flash PMIs. They are expected to confirm an improving cyclical outlook.

The ECB also suggested it was looking at potential ways to help facilitate lending to small and medium sized businesses. Yet this increasing looks like something for the governments rather than the central bank. Before the weekend the four largest euro area members (Germany, France, Italy and Spain) agreed to look at mobilizing the European Investment Bank (EIB) that can channel funds through state development banks for SMEs.

Sterling is trading near four-month highs. It reports inflation figures this week and retail sales. They are both expected to tick up. CPI has been trending lower since late 2011, but is sticky in the 2.2%-2.7% range. Retail sales have been soft, declining five of the last seven months and three of the last four. Minutes from the MPC meeting early this month will be released, but given that Carney takes the reins in a couple of weeks probably denies the minutes of having much market impact.

The Reserve Bank of Australia also publishes the minutes from its recent meeting. While scope exists for additional easing, the market has moved away from a July cut. We anticipate an August rate cut and a rate cut in Q4.

In addition to the Federal Reserve's meeting, the Swiss National Bank and Norway's central bank meets this week. We expect both to announce no change in policy.

The G8 Summit kicks off today. The EU agreement before the weekend paves the way to launch a trans-Atlantic free trade talks. Moreover, with Europe moving away from its austerity thrust, this blunts a potential criticism. Ironically, the US, which has been critical of Europe's austerity emphasis, has the tightest fiscal policy within the G8 this year. Japan may come under pressure to implement structural reforms after Abe's "third arrow" was a bit of a dud, disappointing those who anticipated bolder action. However, it is politics, and especially responding to developments in Syria that may be the most divisive, though Russia seems isolated within the G8.

Japan reports May trade figures near midweek and another large trade deficit is expected. After improving on a seasonally adjusted basis in March and April, some widening is expected. While exports are likely to improve for the third consecutive month, import growth also continues. The weaker yen appears to be lifting the value of imports more than exports.

Among the emerging markets we note that India left rates steady today, as expected. Turkey's central bank meets tomorrow and no change is expected. South Africa reports CPI and current account figures on Wednesday. The flash Chinese PMI is due Thursday.

See the original article >>

Follow Us