By John Letzing
Thursday, July 21, 2011
Microsoft profit rises 30%
The Global Physical Gold & Silver Reserves Race is the New Nuclear Arms Race
The USA-USSR nuclear arms race has been replaced by the East-West battle to accumulate physical gold and physical silver reserves. While Western Central Banks and their puppet bullion banks have distracted and goaded private citizens with the invention of fraudulent bogus paper gold and paper silver derivative products, including ETFs more recently, and paper futures contracts for a much longer period of time, they themselves have been making sure to avoid the very fraudulent paper products they have invented and have been diving headfirst into real physical precious metals.
As Central Banks continue to significantly devalue all major global currencies through excessive creation of new supply out of thin air in a digital world where “new money” is never even printed into paper/cotton form but only is created as digital bytes that are sent across international borders, the private families that are the majority shareholders in the world’s most powerful Central Banks have engaged in heavy buying of physical gold in particular, and to a lesser degree, physical silver. In 2010, Central Banks as a group, became net buyers of physical gold after two decades as net sellers. EU Central Bankers became net buyers of physical gold for the first time during the 1st Quarter 2011 since their introduction of the heavily flawed Euro into circulation in January of 2002.
As of April 2011, China was, according to “officially reported” statistics, the sixth-largest official holder of gold, with 1,054.1 tonness, according to World Gold Council estimates. The U.S. was still reported to possess the largest gold reserves at 8,133.5 tonnes. However, all of you know by now that I believe all “officially reported” statistics, whether the statistic is GDP, unemployment, inflation, or gold reserves, to be a charade and mockery of the truth. To this day I am highly skeptical of the US reported reserves of 8,133.5 tonnes, especially since these reserves have neither been independently audited nor independently tested to ensure that they meet good-for-delivery bar status since Dwight D. Eisenhower was the US President in the 1950s. As for China’s “officially reported” holdings of only 1,054.1 tonnes, anyone that takes these reported stats at face value as the truth is a fool for any number of logical reasons. One, China reported that its “official” gold holdings were a constant 600 tonnes from 2003 to 2009 and then reported that it had increased its holdings to more than 1,000 tonnes overnight in 2009. Since China lied about its gold reserve holdings for more than 6 years, one cannot and should not assume that their “officially” announced 1,054.1 tonne level was truthful. Since China made that announcement in 2009, their “official” gold reserve level has not increased at all.
Anyone that believes that China has not accumulated more gold, and lots of it, since that time, does not understand the Chinese government and Chinese bankers. Chinese bankers have been studying the best ways to invest in gold and silver for many years now in preparation for this global monetary war and they realize that one of the best ways to invest in PMs is to own the real thing. Furthermore, there are multiple mechanisms by which China could be secretly increasing their gold reserves out of the scrutiny of the public eye. In 2008, China replaced South Africa as the largest gold producer in the world, but nobody really knows exactly how much gold China produces or how many proven/ probable reserves or how much measured/indicated resources they own. Thus, China could be increasing gold reserves significantly on in-house production alone. Certainly we know that China is increasing its silver reserves through a policy of decreasing its domestic silver exports and increasing its foreign silver imports.
For example, last month, China’s General Administration of Customs reported that its net imports of silver nearly quadrupled year-over-year in 2010 to more than 3,500 metric tons. Also of important note is the fact that in 2010, China exported 1,575 metric tons of silver, 58% less than in 2009, and imported 5,159 metric tons of the metal, 15% more than in 2009. This is a huge change if one realizes that from 2005 to 2010 China transitioned from a net exporter of 2,900 metric tonnes of silver to a net importer of 3,500 metric tonnes.
From 2005 to 2010, China increased its gold holdings in its State Administration of Foreign Exchange (SAFE) more than tenfold from a very small starting point of USD $4.2 billion to USD $48.1 billion. However, China could be increasing gold (and silver) reserves significantly through purchases in its Sovereign Wealth Fund - purchases that are not made available for public inspection or consumption. For China to publicly announce their buildup of gold and silver reserves that would drive up the price of the very commodity they wished to accumulate more of would be akin to then-Chancellor of the Exchequer Gordon Brown’s foolish decision to pre-announce in 1999 that the UK would be selling half of its gold reserves.
Also of important note are the following facts. China only recently deregulated gold in 2003 to allow gold prices in China to mirror international prices. The Shanghai Gold Exchange only opened in October of 2002. In late 2009, the Chinese started making gold and silver bullion easily accessible to its citizens through introducing physical sales of multiple size bars at its banks and China finally legalized ownership of 99.999% pure silver bullion. The Chinese typically have a tendency to buy PHYSICAL gold and PHYSICAL silver, not the fraudulent paper gold and paper silver derivatives invented by bankers to suppress the price of gold and silver. For the first time ever, Chinese citizens will be able to buy silver futures in Hong Kong this week and later in Shanghai; however, since the Chinese are fond of owning Physical metals, perhaps the majority of Chinese may settle these contracts with physical delivery. Furthermore, even when the option to buy gold and silver ETFs in China becomes a reality, the average Chinese citizen may shy away from these products due to his or her propensity for owning real gold and real silver.
For Asians in general, gold and silver have always been money. In Thailand, the word for money “ngen” is also the word for silver. In China, the word for bank combines the characters for “silver” and “movement”. In China not only is private demand strong AND relatively young, but even in India, private ownership of gold bullion bars was not legalized until 1990. Thus, the war between East and West over gold and silver will intensify in coming months and coming years. The objective of the East will be to release the gold and silver price from the clutches of Western price suppression schemes while the objective of the West will be to hoard gold in an attempt to prevent citizens of Western nations from owning the asset that will protect them the most from their currency devaluation schemes.
About the author: JS Kim is the Managing Director of SmartKnowledgeU. SmartKnowledgeU now offers monthly subscriptions to our premium investment newsletter, the Crisis Investment Opportunities newsletter, an investment newsletter that has returned well over a cumulative 200% (on all opened and closed positions) since its launch in June 2007 to present day. Follow us on Twitter here.
AT&T revenue, net subscribers beat Street
by Sinead Carew
AT&T, which is seeking approval to buy T-Mobile USA for $39 billion, added 331,000 net subscribers in the quarter compared with the average expectation for 91,000 from seven analysts contacted by Reuters.
Goldman On The Just Commenced Europarliament Summit: "Decision Time"
by Tyler Durden
For what it's worth, and probably not much, here is Goldman's Francisco Garzarelli on why it is "Decision Time or bust" for Europe. With the just commenced summit, the market has very high expectations of a favorable outcome. Should the proposed resolution end up being disappointing, and it likely will upon a close read between the lines as it can not possibly be anything more than merely another can kicking exercise, look for the EUR to tumble after this final relief rally.
From Goldman Sachs
News that Germany and France have reached an entente on how to provide further help to Greece has buoyed Euro-zone government bond markets. One of the benchmarks on which investors will judge today’s announcements from the European Council will be the losses inflicted on private holders of Greek debt. Crucially, however, the market reaction will depend on the extent to which the Euro area members are willing to share in each other’s sovereign credit risk without strict conditionality.
Final discussions are underway in Brussels on a second multi-annual financial support package for Greece, and “measures to improve the Euro area’s systemic capacity to resist contagion risk” (Eurogroup statement, 11 July).
Last night, Germany and France, the major holders of Greek debt, reportedly reached a common position that will be presented to the European Council for broader discussion. A press conference will be held at the end of a working session starting 3pm Brussels time.
We laid out our thoughts on the main issues facing markets in a note published at the start of the week. Here we summarize what we expect to come out of the meeting, and how markets could react.
- An increase in the EUR110bn package for Greece has been agreed. The baseline assumption is that it will be in the region of EUR100bn-EUR115bn, covering financing needs through mid-2014 (and allowing a buffer in the event of slippages). We expect funds (EUR20-30bn) to be earmarked to prop up the Greek banks, after third-party diagnostics of their balance sheets have been carried out (as in Ireland). The Euro-zone portion of the second package (assumed to be in the region of EUR70bn, net of EUR15bn-worth of privatization receipts and EUR30bn from PSI – see below) will likely be funded by the EFSF, rather than bilateral loans. Margins will likely be reduced from the 200-300bp over 3-mth Euribor today. The same terms would be extended to Ireland and Portugal. It is unclear if the IMF will contribute to this second package. For reference, the Fund’s current exposure is EUR30bn on SBA terms, of which EUR18bn have been disbursed. On the central assumption, the Euro-zone will have committed EUR150bn to Greece, of which EUR47bn have already been disbursed. Assuming the remainder of Greek bilateral loans are rolled into the EFSF, the latter would have committed up to EUR146bn to the three program countries out of a lending capacity of EUR440bn. The portion of this total amount backed by AAA countries still available (originally EUR255bn) would then be EUR109bn.
- Greece would still have a high debt burden, but liabilities would be more affordable and spread over a longer time horizon. The country’s new creditors would continue to have a large influence on the government’s cash flows, and this may increase the chances of front-loaded structural reforms being carried out (see the IMF’s 4th Review for details). The market float of Greek bonds (ex-bills) would also continue to decline, and by end-2013 it should have fallen to around 35% (net of ECB holdings). Similarly, the share of Greek bank funding via the ECB would increase to 30% of total liabilities, before declining as the banks' aggregate balance sheet shrinks. We have dubbed these dynamics ‘managed deleveraging’. If these magnitudes are confirmed, European policymakers will have made a clear choice – this time around, capital debt restructurings would be heavily piloted by the official sector. From 2013, sovereign debt instruments carrying Collective Action Clauses and homogeneous legal support should make crisis management more efficient.
- To provide political support for this process, private-sector involvement (PSI) remains a possibility, as a Franco-German ‘common position’ would also suggest. As we have written before, we do not expect this to change materially the debt dynamics (which will be primarily influenced by growth prospects). However, alongside privatization proceeds, PSI would reduce the bill for tax-payers by an estimated EUR30bn. We have long favoured purchases of Greek bonds by the EFSF, as such purchases could put a floor under recovery values, allowing investors to exit positions, and achieve a mild form of ‘bail-in’. Purchases could be carried out once or staggered over time. Voluntary maturity extensions, our central expectation for several months, could also be on the menu. PSI is likely to trigger ‘selective default’, at least temporarily, but the ECB could compromise on its collateral policy.
Secondary market purchases by the EFSF of Greek bonds would be an effective way to achieve PSI, in our view, but they ultimately still represent a form of liability management within a framework of conditionality on the country’s cash flows. Given the extension of sovereign tensions to larger high-rated sovereigns, namely Italy and Spain, the most crucial parts of today’s announcements will involve mechanisms to address systemic risk. These would need to be unconditional, ex ante risk-sharing solutions available to all EMU countries. The ‘wish list’ includes the introduction of ‘flexible credit lines’, such as those the IMF made available to Poland in 2009. Or, more ambitiously, secondary market purchases of government bonds outside program countries by a joint Debt Management entity (initially the EFSF). Eurozone-wide schemes to provide funding guarantees to banks (against a fee) that have passed stress tests would go a long way towards separating sovereign and financial risk. We expect steps in this broad direction to be taken and this will be the main benchmark against which to judge the outcome of today’s summit. Even if details are not completely fleshed out (there will be much discussion on the size of the facilities, accountability, etc.), any hint at such initiatives would be an important breakthrough. Any institution delivering unconditional risk-sharing would need deeper Euro-zone fiscal governance as a counterpart (the Pact for the Euro represents a step in this direction).
We said at the start of the week that Euro-zone bond markets would be volatile, caught between attractive valuations and expectations of a deal, and the uncertainties surrounding PSI. On light flows, some of the sell-off has reversed over the past 48 hours. If our baseline case above plays out, we would expect more upside and almost all of the widening in intra-EMU spreads seen since Moody’s downgrade of Portugal could be corrected.
We said at the start of the week that Euro-zone bond markets would be volatile, caught between attractive valuations and expectations of a deal, and the uncertainties surrounding PSI. On light flows, some of the sell-off has reversed over the past 48 hours. If our baseline case above plays out, we would expect more upside and almost all of the widening in intra-EMU spreads seen since Moody’s downgrade of Portugal could be corrected.
We doubt we will see more upside than that, at least for a while. It will take some time for the new policies to be articulated and implemented, and all decisions taken today will need to be put before national Parliaments, probably at the start of September. Moreover, concerns over the pace of global growth remain in the background weighing on weaker borrowers. Last but not least, investors have been heavily affected by recent events and thus may want to reduce risk in a recovering market.
A more sustained tightening of spreads awaits fresh inflows into the Euro-zone fixed income markets from investors outside the single currency area, primarily in Asia. This requires greater clarity on the Euro-zone’s evolving fiscal governance.
A more sustained tightening of spreads awaits fresh inflows into the Euro-zone fixed income markets from investors outside the single currency area, primarily in Asia. This requires greater clarity on the Euro-zone’s evolving fiscal governance.
Morgan Stanley swings to loss, but tops estimate
By Greg Morcroft
Morgan Stanley MS said on Thursday that it swung to a loss in its second quarter of $558 million, or 38 cents a share, compared to a profit of $1.58 billion, or $1.09 a share. Revenue at the firm in the second quarter was $9.28 billion compared to $7.96 billion a year ago. Analysts polled by FactSet Research had expected the company to lose 61 cents a share, on revenue of $8.04 billion.
Morning markets: weather premium keeps crop prices buoyant
by Agrimoney.com
Angela Merkel and Nicolas Sarkozy have hammered out a deal, but will the rest of the eurozone agree? And is it any good?
Top of the agenda for financial markets on Thursday (more important even than weekly US crop export sales data) is the crunch meeting of eurozone leaders to hammer another nail into the (fingers crossed) coffin of the Greek debt crisis, and prevent debt fears spreading further to the likes of Italy and Spain.
An eleventh-hour agreement between the German and French leaders, the key players, improves the chances of a deal, although with no details yet available the markets found it difficult to judge.
Talk is of a potential E71bn bail-out fund from global lenders, and of a E50bn tax on eurozone banks to raise cash for buying back Greek sovereign debt (of which some E350bn is outstanding).
Chinese cloud
Whatever, the uncertainty over the summit, plus America's failure to find a permanent solution to its debt ceiling, injected an air of caution into markets on Thursday.
Tokyo's Nikkei share index closed all of 0.04% higher.
But, at least from commodities' point of view, it fostered a strengthening in the euro, and weakness in the dollar, down 0.3% against a basket of currencies, providing some support to the appeal of dollar-denominated assets.
Which was helpful when HSBC data showing manufactured in China, a huge consumer of raw materials, shrinking this month for the first time in a year, throwing a cloud over the copper market.
Premium to hang around
Farm commodities were lower too in early deals, before finding some support from the dollar and weather models which, in some cases, still see well-above-normal temperatures hitting the Midwest again towards the end of the month – even if the European model has turned its back on such an idea.
"For corn, the current risk premium is likely to remain for at least a month, until the market can gauge what US corn yields look like," Australia & New Zealand Bank said.
"Anything but a well-below trend yield for US corn is likely to see prices for the December contract break quickly to $6.00 a bushel."
In fact, the lot was 0.3% higher at $6.79 ¾ a bushel as of 07:45 GMT (08:45 UK time), recovering from an early low of $6.68 a bushel reached as doubts over demand took a bite too.
"Asian imports have slowed due to the return of higher corn prices and many are already well stocked for the next few months," Lynette Tan at Phillip Futures said.
Sowing talk already
Wheat did even better, adding 0.6% to $7.01 a bushel for September, supported by weather concerns too.
"While it is still way too early to start talking about planting conditions for the US winter wheat crop, the weather pattern for the southern Plains just does not seem to want to change," said Dave Lehl at Benson Quinn Commodities, referring to the hot and dry pattern which has stuck around since last year.
In Europe, "excessive rains in parts of France and Germany help to create a quality concern mindset" although high-protein Minneapolis spring wheat for September gave back a little premium gained in the last session, adding 0.2% to $8.54 ¼ a bushel.
'Sellers are rare'
And, indeed, European prices have helped Chicago by proving resilient too in the face of bargain prices from the neighbouring former Soviet Union.
"Prices still remain firm because sellers are rare, waiting for harvests to resume," Agritel, the Paris-based consultancy, said, estimating that 57% of French wheat area remains to be harvested, equivalent to 62% of volumes.
"Weather forecasts show improvements for the week-end and next week which should allow farmers back in their fields."
Export talk
Still, for once soybeans stuck their neck out too, adding 0.5% to $13.84 ¾ a bushel for August delivery, and the same to $13.91 a bushel for November, eschewing their recent tendency for minimal moves.
Continued talk about a pick up in US exports improved sentiment.
"A 4m-bushel new crop soybean sale to an unknown destination yesterday, and China bought 8.1m bushels of new crop soybeans on Wednesday. Do they know something?" Mike Mawdsley at Market 1 asked.
"Interesting we are seeing purchases near the contract highs."
Data later
Not that these sales were in time to be included in the weekly US export sales data, due later, expected to show a soybean figure of 400,000-550,000 tonnes old crop and new, down from last week's 656,000 tonnes.
Grains are seen showing smaller sales too, thanks to higher prices, with corn's seen at 900,000-1.4m tonnes, down from 1.68m tonnes, and wheat's at 300,000-500,000 tonnes, compared with 519,000 tonnes last time.
Cotton's will be telling too, with another week of negative sales – cancellations have beaten new orders in seven out of the last nine weeks, new crop included – likely to prove a further depressant to prices.
Traders were not taking any chances, sending New York's December lot down 0.7% to 100 cents a pound exactly.
PepsiCo profit seen up on international growth
By Martinne Geller
PepsiCo Inc (PEP.N) is expected to report higher quarterly profit on Thursday, helped by growth in emerging markets.
The company sells variations of its Pepsi-Cola drinks, Frito-Lay snacks and Quaker oatmeal products in many countries around the world, which has helped insulate its results from a slowdown in North America.
Analysts on average are expecting the company to report second-quarter earnings of $1.21 per share on revenue of $16.4 billion, according to Thomson Reuters I/B/E/S.
Standard & Poor's Equity Research analyst Esther Kwon expects the same general trends for PepsiCo as those reported this week by rival Coca-Cola Co (KO.N), whose shares rose to a 12-year high after results beat expectations.
"North America is just bumping along. The real growth is driven by international," Kwon said in an interview. Even though Pepsi-Cola just dropped to the No. 3 brand of soft drink in the United States, behind Coca-Cola and Diet Coke, Kwon said "the real investment story is the ability for these companies to grow overseas."
She has a "buy" rating on Pepsi and a "strong buy" on Coke, which has a larger international footprint and stronger overall returns due to its concentration in beverages.
Analysts will be keen to hear PepsiCo's comments about raw material costs and U.S. price increases meant to offset some of the margin squeeze.
Consumer Edge Research analyst Bill Pecoriello said Coke's reiterated plan to raise prices by 3 to 4 percent in the rest of the year means that its net increases could be below those of Pepsi.
"PepsiCo will have to decide whether to settle for less pricing or meaningful share losses," Pecoriello wrote in a note.
Nokia posts $523 million loss, lower sales in Q2
by Yahoo! News
Mobile phone maker Nokia Corp. on Thursday posted a loss of euro368 million ($523 million) as sales slumped in the second quarter amid "greater than expected" challenges.
The result was down from a profit of euro227 million in the same period last year.
Nokia said its revenue fell 7 percent to euro9.3 billion from euro10.0 billion the previous year. It shipped 88.5 million mobile devices in April through June, down from 111 million a year ago and 108.5 million in the previous quarter.
"The challenges we are facing during our strategic transformation manifested in a greater than expected way" during the quarter, CEO Stephen Elop said. "However, even within the quarter, I believe our actions to mitigate the impact of these challenges have started to have a positive impact on the underlying health of our business."
Nokia's share was up 4.6 percent at euro4.26 on the Helsinki Stock Exchange immediately after the report.
Nokia said it was accelerating its cost-cutting plan to exceed the previously targeted savings of euro1 billion in 2013. The reductions would be achieved through cuts in staff and oustourced professionals, facility costs "and various improvements in efficiencies," the company said.
Nokia rose to the top position in the cell phone business in the late 1990s when it overtook Motorola. Although it struggled in the U.S., it dominated almost everywhere else, primarily through mass sales of low- and mid-priced mobile phones.
Now, Nokia is being squeezed in the low end market by Asian manufacturers like ZTE and in the high end by the makers of smartphones like the iPhone and Blackberry devices. Its global market share dropped below 30 percent earlier this year for the first time in more than a decade.
Nokia's share price has dropped nearly 50 percent this year, falling below euro4 this month.
The Espoo, Finland-based company hopes to regain momentum through a linkup with Microsoft, whose Windows Phone operating system will replace Nokia's Symbian software. Symbian has been losing ground to Google's popular Android platform. Nokia expects to launch its first Windows phones later this year.
Crude Oil, Gold Look to EU Summit and US Debt Debate for Guidance
by
Talking Points
- Crude Oil Looks to EU Summit Outcome for Direction Cues
- Gold Holds on to Safe-Haven Role Amid Macro-Level Jitters
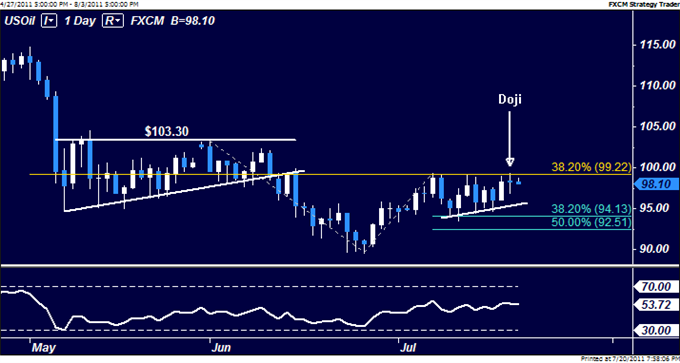
WTI Crude Oil (NY Close): $98.14 // +0.64 // +0.66%
Prices continue to track broad-based risk appetite trends, putting the spotlight on the EU leaders’ summit set to begin in Brussels. Sentiment got a bit of a boost overnight amid news of a Franco-German agreement on a plan for Greece ahead of the sit-down, but putting out the fire in the Mediterranean country in isolation seems hardly enough to calm investors.
Indeed, Greece is nearly an afterthought now that fears of real contagion in larger countries like Spain and Italy – both arguably too big to be bailed out via the existing EFSF rescue fund – are beginning to play out. With that in mind, the most important takeaway from today’s meeting will be the scalability of any Greek arrangement for other ailing countries. A one-off plan that addresses none of the vulnerabilities elsewhere in the region is likely to be met with disappointment by the markets, sinking confidence and – by extension – the WTI contract.
Later in the session, the earnings calendar and a second-tier set of US economic data releases will enter into the picture. A hefty 21 S&P 500 companies are set to report second-quarter results. So far, the ratio of positive surprises on headline profits readings to negative ones is outpacing the first quarter, suggesting the reporting seasons has broadly supportive implications for risk appetite, but disappointing news from Europe will almost certainly overshadow that. Meanwhile, July’s Philadelphia Fed business confidence survey is expected to post a bit of an improvement.
Technical considerations are broadly bearish. Prices put in a Doji candlestick below resistance at $99.22, the 38.2% Fibonacci retracement of the drop from the early May swing high, hinting a move lower may be ahead. The setup reinforces the likelihood of a forming Ascending Triangle chart pattern, arguing for bearish continuation. A break through triangle support at $95.50 initially exposes $94.13 and $92.51.
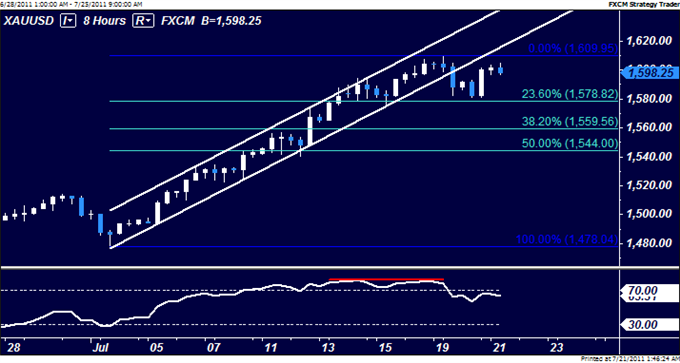
Spot Gold (NY Close): 1600.50 // +12.05 // 0.76%
Gold rebounded as the bipartisan “Gang of Six” deficit-reduction plan endorsed President Obama yesterday began to lose some its luster amid fears the tax hikes it included would not pass a vote in the House of Representatives. Fears that the initiative is too ambitious given the proximity of the August 2nd deadline to raise the debt ceiling also circulated across the newswires. Needless to say, this propped up safe-haven demand for yellow metal after yesterday’s selloff.
Looking ahead, the beginning of debate on the conservative “cut, cap and balance” deficit-reducing initiative that passed the House earlier this week is set to begin in the Senate, but Obama’s pledge to veto it even if it passes strong Democrat opposition means its fate from here is largely moot. With that in mind, uncertainty is back in play, with the tone of headlines crossing the wires on the issue largely in charge of where gold is heading over the near term.
Clearly, the outcome of the EU leaders’ summit is also of note. Prices have tracked closely with periphery Euro Zone credit-default swap (CDS) spreads, meaning a disappointing outcome from Brussels is likely to prove supportive for gold prices, and vice versa. Finally, a strong showing on the earnings front may dampen QE3 expectations, sapping demand for gold from investors looking of an inflation hedge, but this seems somewhat secondary given the macro-level issues playing out at present.
On the technical front, prices rebounded from support lines at $1578.82, the 23.6% Fibonacci retracement level, having taken out rising channel support that upheld the rally since the beginning of the month. The move appears corrective, with a push above the July 19 high at $1609.95 needed to neutralize near-term selling pressure. A resumption of bearish momentum that clears current support initially exposes $1559.56. Longer-term positioning remains broadly bullish.
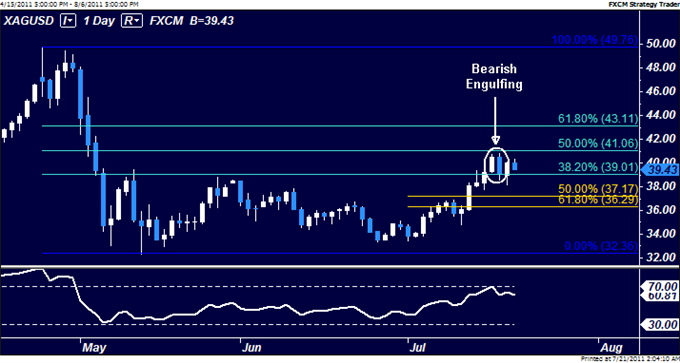
Spot Silver (NY Close): $40.04 // +0.98 // +2.50%
As before, the key drivers of silver price action continue to mirror those of gold, with the central focus on the EU leaders’ summit and the evolving US deficit-reduction impasse. Prices remain locked in consolidation below resistance at $41.06, but the presence of a Bearish Engulfing candlestick pattern suggests the path of least resistance favors the downside. A break below initial support at $39.01 exposes downside targets at $37.17 and $36.29.
Global slowdown signs strengthen, debt crisis weighs
By Jonathan Cable
The surveys were published just before European leaders meet for a crisis summit to hash out a second bailout of Greece and allay fears a debt default by Athens will poison access to the bond market for bigger states.
In the latest sign economic growth is dwindling, Markit's Eurozone Purchasing Managers' Indexes showed growth in the 17-nation bloc's factory sector came to a standstill in July while its dominant service sector grew at its slowest rate in 22 months.
"The large fall in the flash euro zone PMI in July provides further signs that the debt crisis may be starting to take a heavy toll on the economic recovery in the region," said Ben May at Capital Economics.
The debt crisis, which has so far pushed Greece, Ireland and Portugal into bailouts, shows no signs of losing momentum, raising fears in recent weeks that it will engulf Italy and Spain as well.
But France and Germany reached a joint stance on a second bailout for Greece late on Wednesday, ahead of Thursday's summit in Brussels, that would supplement a 110 billion euro ($156 billion)rescue plan for Greece launched in May last year.
It is expected to include fresh emergency loans to Athens from euro zone governments and the International Monetary Fund, and possibly a range of other austerity measures that have already put the brakes on growth across the region.
The flash services PMI sank to 51.4 this month from 53.7 in June, its lowest level since September 2009 and falling far short of expectations for 53.0 but has been above the 50 mark that divides growth from contraction for nearly two years.
The flash manufacturing PMI fell to 50.4 from 52.0 in June, its lowest reading since September 2009 and missing consensus expectations in a Reuters poll for 51.5.
"There is no doubt that the free fall in the PMIs of the last three months comes as a negative surprise. We believe that external factors remain predominant, in particular the ongoing softening in the global factory cycle, as shown by further signs of weakness in China this morning," said Marco Valli at UniCredit.
China's factory sector contracted for the first time in a year in July and at its fastest pace since March 2009 as monetary policy tightening and slack global demand weighed on the economy, according to HSBC'S Chinese PMI.
PRODUCTION PLUMMETS
Output in the euro zone's manufacturing sector, which drove a large part of the recovery in the bloc, shrank for the first time in two years, with the index falling to 49.5 from 52.5, its lowest since July 2009.
Factories also saw new orders falling for the second month running, with the index sliding to 47.6 from 49.8, its lowest reading since June 2009.
"We have orders in contractionary territory which tells you that the European economy is losing momentum at a time when the resolution to the crisis is going to be heavily dependent on a strong Germany," said Peter Dixon at Commerzbank.
An earlier release from Germany, Europe's largest economy, showed its composite PMI staging the biggest one month fall since late 2008, slumping to 52.2 from June's 56.3.
The picture was little better in France, where the composite index fell to a 23-month low of 52.8 from June's 54.9.
The glum indexes meant the euro zone composite PMI, a broader measure of the private sector which combines the services and manufacturing data, collapsed to 50.8 from 53.3, well below forecasts for 52.6.
The composite index is often used as a guide to growth and Markit said if the PMIs remained at current levels there would be no economic growth in the third quarter, and without the tepid growth seen in Germany and France the euro zone index would have been negative.
Economists polled by Reuters this month predicted euro zone growth of 0.4 percent this quarter.
DEBT DEFYING
But in the face of the intensifying debt crisis and an onslaught of downbeat data the ECB raised interest rates earlier month for the second time this year, and signaled another hike is likely later in the year.
Economists expect the ECB to raise rates one more time this year, to 1.75 percent, followed by another hike in the first three months of 2012 to fight inflation.
Service sector firms increased prices faster than last month, with the output price index rising to 53.0 in July from June's 52.4, matching April's 33-month high.
In one bright spot for policymakers businesses continued to take on new workers, and at a slightly faster rate than in June, with the composite employment index rising to 52.2 from June's 8-month low of 52.0.
Individual Investor: Trade Like a Pro
by Jeff Miller
It has been well documented that individual investors trail the market averages when it comes to investment performance. The "buy and hold" concept has little respect these days, but most individual investors do even worse.
There are many reasons for this, but bad market timing heads the list. As many regular readers know, I have been working on a book aimed at helping individual investors. Part of my approach is explaining how professionals think about problems. Here is one example.
There are many reasons for this, but bad market timing heads the list. As many regular readers know, I have been working on a book aimed at helping individual investors. Part of my approach is explaining how professionals think about problems. Here is one example.
Follow up:The Concept of Upside Risk
There is a concept well known to financial professionals, but rarely considered by the individual investor. It is the concept of upside risk. Briefly put, it means you have a position that will be a loser if prices move higher. Here are a few examples:
- The most obvious case is the hedge fund manager who is “short” a stock. This means that his fund profits when the stock goes down and loses when it goes up. His risk is to the upside.
- Mutual fund managers try to beat a specific benchmark. When they are partly out of the market, or in very conservative investments, their risk is to the upside.
- When a stock analyst writes a professional report recommending a stock, she lists all of the factors that could be problems for the company. When the analyst recommends against owning a stock, she lists all of the things that might be better than expected. The risk is to the upside.
This is an indispensible concept for the individual investor. It starts with analyzing your personal situation
The Key Investor Question: What is Your Risk?
The average investor thinks only about the downside. Because of our natural human instincts, well established in the psychological studies of behavioral finance, we all focus on what we might lose. This can have a paralyzing effect.
Meanwhile, there is a constant barrage of news about problems. This is the grist for the daily media reports.
Professionals cut through this news. They have a specific market plan, balancing risk with reward. Most individual investors do not have a strong plan -- one with a specific target and a process to reach the goal. They often make the mistake of treating their investments like a poker game where they are “all in” -- or all out.
The Acid Test
If you have all the money you need for your future, you should be preserving capital. I understand that interest rates are low, but security is important. Be cautious!
Most of us are not in that happy position. We need to create wealth, not just to preserve wealth.
If you have significant future needs, and you do not own any stocks, you have upside risk.
To appreciate the risk you should ask yourself what will you do if the market goes to 15,000? To 20,000? When will you decide to buy? If you do not have a plan, it means that you will miss out in achieving your goals.
Every portfolio needs a balanced asset allocation. The right answer is different for each investor.
Key Takeaway
The professional investor views risk in terms of upside and downside. The amateur looks only at the downside. He fails to ask decisively when there is opportunity and chases the market at peaks. There is no better time to invest than when there are many well-known and well-documented worries. A bad time to invest is when no one is worried.
This is very difficult to understand, and even harder to implement.
This is very difficult to understand, and even harder to implement.
Brussels Summit: France and Germany Agree Deal as Leaders Meet to Save The Euro
By Thomas Costello
There is growing optimism in Europe that a deal can be struck to save the euro and the Greek economy after France and Germany came to an agreement over the plans. It was believed that both Angela Merkel and Nicolas Sarkozy would be entering the talks opposed on crucial areas in how to save the Greek economy but it now seems as though both parties will enter the talks united.
The Brussels summit is the tenth time Eurozone leaders have met in the past eighteen months and todays talks will no doubt be the most crucial to the stability of the Eurozone. Ahead of the crunch meeting, leaders will attempt to resolve the Greek debt crisis and prevent further contagion to other Eurozone economies.
Germany had previously insisted that Greek leaders should be forced to take losses as part of any further bailout package. However, after seven hours of talks in Berlin, Chancellor Merkel and President Sarkozy have agreed a compromise on Greek losses. The complex new bailout package will be presented at the meeting with the fundamental issue still remaining who will pay for any further bail out.
Greece was granted a €110bn (£97bn) bailout in May last year, since then its debt has soared to €340b. It needs a second bailout to keep afloat until 2014. France wants to impose a levy on Eurozone banks which would raise around £10bn a year. Germany are believed to oppose such measures because it would penalise banks not exposed in Greece and would take time to establish. However, the levy would encourage private creditor involvement, something Angela Merkel is keen on.
The seriousness of the situation across the Eurozone has been spelt out by European Commission President Jose Manuel Barroso. He said on Wednesday: "Nobody should be under any illusion; the situation is very serious. 'It requires a response. Otherwise, the negative consequences will be felt in all corners of Europe and beyond."
The Governor of the Bank of England, Sir Mervyn King, has said that the crisis in the Eurozone posed the most serious and immediate risk to the U.K.'s financial system.
17 government leaders will attend the Brussels summit today plus heads of the ECB (European Central Bank), European Commission and Christine Lagarde.
See the original article >>
USDA’s Chief Economist: Strong but Volatile Crop Prices Ahead
By: Ed Clark
Producers should expect a continuation of highly volatile crop prices over the next several years, but relatively strong prices due in large part to strong export demand, and, of course, ethanol use. That’s the message from Joseph Glauber, chief economist of USDA.
Furthermore, corn stocks will be rebuilt from current very low levels as high prices will stimulate production worldwide, but it will take about two or three years. "It’s hard to rebuild stocks overnight." He sees corn prices $4-plus five to 10 years out and higher than that if energy prices remain high with farm costs so tied to energy.
Glauber spoke at a meeting on recognizing the risks in global agriculture sponsored by Federal Reserve Bank of Kansas City.
Glauber added in response to a question from AgWeb that it’s difficult to be precise in predicting when stocks will be rebuilt because so much depends on yields and demand. But that said, the last 60 years suggests that high prices stimulate more production and the eventual rebuilding on stocks. "It’s hard to argue against that," he states.
Acknowledging that some believe the land price boom is a bubble, Glauber nonetheless does not expect a crash in values, as land reflects underlying fundamentals, "even with $4 corn," although run-ups of 20% that have occurred in two Federal Reserve Districts "are certainly not sustainable." Some softening of values is possible if commodity prices come down somewhat.
Glauber also says that he does not believe that non-ag investment in commodity markets is driving prices overall after reading several studies on the impact of funds on prices. "Over the longer term, fundamentals rule these markets," he says. Looking at an individual day, however, it can appear that outside investment has a bearing on market movement, he adds.
One reason Glauber is optimistic for agriculture over the next few years is the outlook for strong exports, which are now at record levels. However, the growth in U.S. market share may be reduced, which is to be expected with prices at such high levels. "About 60% of soybean exports in the world go to China. We’re looking for that maintaining if not increasing." India also is emerging as a strong customer, he notes.
While most of U.S. exports to China have been soybeans, he sees the possibility for increases in corn exports, too, as China is increasing its non-food-usage of corn. China is also increasing its feed use due to higher levels of poultry and pork production. Remarkable on corn exports to China is that until recently, the nation was a substantial exporter of corn.
One hurdle for all major crops is the need to double production over the long term to meet increasing demand, particularly in developing nations for higher diets of animal protein. "The challenge will be coming up with the production."
Furthermore, Glauber adds, unlike the commodity boom in the early 1970s, there are few additional acres in the U.S. that can be brought into production. The only acres available are in the Conservation Reserve Program (CRP), and it’s debatable how many of those acres should be brought back into production because of environmental sensitivity, he says.
One important factor making U.S. agricultural so competitive worldwide, Glauber says, is the inexpensive dollar relative to other currencies, and he sees nothing to reverse that in the short term. That’s important, because crop prices in Brazil have not seen the rate of increase that they have in the U.S. because of the relative value of the dollars versus the Brazilian real.
On U.S. soybeans, he says that demand has been growing at an incredible rate of 4.4%, "and I don’t see any letting up."
In the near term for cotton, Glauber predicts "a record amount of abandonment of acres in West Texas," due to the extreme drought. Texas is the No. 1 cotton producing state. He also notes that both China and India are strong U.S. cotton customers.
Fund managers reverse withdrawal from commodities
by Agrimoney.com
Fund managers have called time on a withdrawal of cash in commodities, amid improved hopes for global economic growth, and reduced concerns for China.
The proportion of asset allocators overweight in commodities, minus those with smaller-than-orthodox positions, rose to 13% this month, after declines in May and June, a survey for Bank of America Merrill Lynch showed.
The rebound, from a reading of 6% last month, tallies with a revival in farm commodity prices from a liquidation heading into early July which drove Chicago wheat prices to their lowest for nearly a year.
However, it defied decreased expectations for rises raw material prices identified in the survey, which found only 6% of fund managers viewing commodity price inflation as the biggest economic threat.
In April, commodity prices were viewed as the biggest danger, a position taken now by European sovereign debt, named as risk number one by 64% of investors.
China sentiment
Nonetheless, the 265 asset allocators surveyed, managing nearly $800bn between them, were more sanguine on prospects for world economic growth, with a net 19% seeing the global economy strengthening over the next year, up from 10% in May.
And concerns over growth in China – a huge buyer of raw materials, including cotton and soybeans - have eased too.
A net 24% of Asian and emerging market fund managers see Chinese expansion slowing, down from 40% last month.
The rise in allocations of cash to commodity investments came at the expense of bonds, with investors also slashing positions in eurozone equities and, in particular, banks.
"Investors have acted decisively in response to recent developments in EU sovereign funding. The question is whether eurozone equities have been oversold," Gary Baker, head of European equities strategy at the bank, said.
See the original article >>
Weather isn't the only decider for corn prices
by Agrimoney.com
Has corn's rally run out of steam?
The grain's upswing on forecasts for hot weather, an uptick which brought Chicago's best-traded December contract 7.5% gains last week, has certainly slowed. On Wednesday, the lot fell for the second time in three sessions.
It could be that the contract has peaked for now, and could even be in for a tumble which lasts into harvest if weather forecasts change for the better.
But that doesn't mean that bears hold all the cards.
Losses containable so far?
Sure, weather damage as currently assessed does not look serious enough to warrant a fresh crack at record prices.
Corn's prospects have suffered from a hot weather blow in a sensitive spot – pollination. But the maths suggests that's well covered by current price moves.
Plug in a figure of 156 bushels per acre - the midpoint of the range of between 152 bushels per acre and 161 bushels per acre that Agrimoney.com has heard about – and the harvest comes in at 13.2bn bushels, using the US Department of Agriculture's latest acreage forecast.
While that's 230m bushels fewer than USDA officials are currently expecting, a noteworthy amount when inventories are thin, it is not enough to get the balance sheet back to where prices were in the run up to last month's high.
It's not even enough to reverse even the extra 2011 corn production the USDA factored into its latest crop data, last week, let alone the increased number for stocks left over from last year's harvest.
The acreage question
However, that's not all investors have to factor in.
Further scorching weather might cut yield forecasts nearer to 150 bushels per acre, and lift prices further.
But so would a drop in the number of acres planted - which is still a possibility even if it appears to have dropped off investors' radars for now.
Bulls could have two bites at this cherry.
The first is a cut to the official estimate for US corn sown.
The critics who attacked the USDA's upgraded figure of 92.3m acres may yet be proven right when revised data are released next month. After all, in North Dakota alone, as Rabobank pointed out, a downgrade of only 2.3m acres total sowings appeared conservative when set against separate survey data showing more than 6m acres unplanted.
Lost crop
The second is the estimate for abandonment.
The USDA currently sees 7.4m acres, or 8.0%, of US corn not making it to harvest. That figure may prove optimistic given the flooding which has claimed huge areas around the Mississippi, Missouri and Ohio rivers.
Indeed, larger losses are hardly uncommon. Half the harvests over the last decade have seen abandonment reach at least 9%, with a 10% rate "not out of the question" for this year, Australia & New Zealand Bank said.
Yield x area
Plug more aggressive estimates on these scores into the balance sheet for US corn and it is not difficult to get more worrying ideas of corn supplies.
Using a 10% abandonment rate alone takes the lost production to more than 500m bushels.
Sure, investors need to watch the how productive harvested corn crops will be. But they shouldn't forget the question about how much was sown in the first place, and how much of that will get lost along the way.
Where the DJIA Would Be with AAPL Instead of CSCO
by Bespoke Investment Group
With Apple (AAPL) getting close to $400 today and giving Exxon Mobil a run for its money as the largest company in the world, many are once again wondering why Apple isn't in the Dow Jones Industrial Average (DJIA)? While we can't answer that question, we can tell you what might have been.
Back in June 2009, DJIA removed General Motors from the index and added shares of Cisco (CSCO). While CSCO was one of the largest companies in the country at the time and certainly was a viable candidate for inclusion in the index, the case for AAPL was just as -- if not even more -- compelling. After all, just as there used to be a General Motors car in nearly every driveway, there is now an AAPL product in practically every American household.
Below is a price chart of the Dow since the beginning of 2007 compared to how it would have done if AAPL were added instead of CSCO. Below that we also show the percentage spread between where the DJIA would currently be with APPL instead of CSCO. Because AAPL has done much better than CSCO and the fact that the DJIA is a price weighted index, had AAPL been added instead of CSCO back in June 2009, the index would be more than 10% higher than it is now. At a level of 13,928, it would be within 2% of its all-time high of 14,164.

See the original article >>
Subscribe to:
Comments (Atom)