Sunday, March 13, 2011

+ 23.87 % YTD For Our Galaxy Combined Portfolio Systems

Anche nel mese di Marzo il nostro Galaxy Combined Portfolio Systems sta ottenendo ottimi risultati, che portano a 23.87% il risultato complessivo dello stesso da inizio 2011. I risultati storici di Galaxy Portfolio System sono disponibili ai seguenti link: http://www.box.net/shared/static/nz7u0ztnbp.xls, http://box.net/shared/b9cg6kfa6s. I risultati dei singoli trading systems sono a disposizione al seguente link: http://www.box.net/shared/5vajnzc4cp

Also in March our Galaxy Combined Portfolio Systems is getting good results, bringing to 23.87 % the overall results since the beginning of 2011. Historical results of Galaxy Combined Portfolio System are available at the following links: http://www.box.net/shared/static/nz7u0ztnbp.xls, http://box.net/shared/b9cg6kfa6s. Historical results of single trading systems are available at the following link: http://www.box.net/shared/5vajnzc4cp

Equity of Survivor System, Ninja System, Super Commodity System
Survivor Ninja Super Commodity images


Galaxy Combined Portfolio Systems
Galaxy


Galaxy Combined Portfolio Systems Equity Daily and Monthly
Galaxy Trades Galaxy Time Galaxy Mensile

Material in this post does not constitute investment advice or a recommendation and do not constitute solicitation to public savings. Operate with any financial instrument is safe, even higher if working on derivatives. Be sure to operate only with capital that you can lose. Past performance of the methods described on this blog do not constitute any guarantee for future earnings. The reader should be held responsible for the risks of their investments and for making use of the information contained in the pages of this blog. Trading Weeks should not be considered in any way responsible for any financial losses suffered by the user of the information contained on this blog.

Gold trading this year for professional traders only, experts warn

by SGGP

As gold remains very volatile this year, Dau Tu Tai Chinh Newspaper has interviewed experts about the market trend and their advices about how to trade the precious metal during a fluctuated market.  

Huynh Trung Khanh, Vice Chairman of the Vietnam Gold Business Association

As a former consultant of the World Gold Council in Vietnam, I have three advices to local gold investors.
First, investors should keep close eyes on the global economic news through financial media including Bloomberg and CNBC in order to predict the gold price in short terms. The exchange rate of the US dollar and other strong currencies around the world and the crude oil price are among the factors affecting the precious metal’s price.

Second, they need to learn how to acknowledge the technical-chart analysis of the gold prices, comprising of Relative Strength Index (RSI), Moving Average Convergence-Divergence (MACD) and Ichimoku.
These indicators will help investors set up the support and the resistant levels of gold price trend, enabling them to make appropriate decisions in trading gold.

The last advice is that investors have to fully comply with their take-profit and stop-loss levels. For example, they should place selling orders instantly when the gold price drops US$5 per ounce to cut losses, or take profits when the price moved up by $15 per ounce.

They should also rely on the daily trading band to set the two levels. Investors should be very cautious before making any decisions to avoid heavy losses as the gold prices are volatile. 

Nguyen Thanh Long, General Director of Vietnam Import Export Bank

Gold prices fluctuating with big trading bands in the last two years showed the instability of the global finance and monetary.

No one can predict the yellow metal’s price trend now. I think now only professional and experienced traders should trade gold. 

It is a tradition for Vietnamese people to own gold mini bars, which they expect to help them cope with difficult times. The gold price here is affected by people sentiment. If the economy shows some signs of instability, they’ll keep gold at home. Inflation climbs up high, people will also rush to buy gold. 

Earlier there was just a few of gold traders. Many people now are willing to invest in the precious metal as they are lured by big profits from trading gold. 

There are losses and wins in trading gold. The price has never been unchanged in a long time. It goes up and down, creating profit-taking opportunities to professional investors and also trapping inexperienced and impatient ones.

Le Hung Dung, Chairman of Saigon Jewelry Holding Company

The factor making big impacts on the gold price this year is the US’s public debt. Last year, the public debt was $13.8 trillion and the gold price was $1,350 per ounce. 

The former is expected to increase to $15.3 trillion this year, making the precious metal’s price to rise to $1,500 per ounce. Next year, the public debt will likely to reach $16.5 trillion and the gold price is predicted to jump to $1,663.

Financial experts said a huge amount of dollars coming from the second quantitative easing nicknamed “QE2” of the US Federal Reserve would be expected to raise inflation in the US and the other markets that the amount flowing into.

Therefore, there will be a big gap in interest rate between the US and other countries, making gold prices continue to move up further. Statistics in 2010 show the gold price rose 37 percent as the dollar was devalued 26 percent.

Using Gold and Silver to Evaluate the Direction of the Economy

by David I. Templeton

Given what seems like a parabolic increase in gold and silver prices, many investors are attracted to these metals as investment opportunities. We have a difficult time evaluating whether these metals are overvalued or undervalued. The difficulty arises from the fact these metals do not generate any cash flow. We value investments we make for our client accounts based in large part on the cash flows generated by particular investments. Consequently, at this point in time we do not have a direct allocation to either gold or silver for our client accounts.

On the other hand, we do evaluate gold and silver prices as they are an important input into our analysis of the future direction of economic growth. Gold tends to be a safe haven investment for investors with events like those occurring in the Middle East impacting the price of gold. During times of improving economic activity though, silver tends to outperform gold due to silver's wider industrial use compared to gold; hence, driving up the price of silver. Since mid-2010 silver has outperformed gold. The first chart below shows gold and silver prices along with the gold/silver ratio. In the second chart, the gold/silver ratio is plotted with U.S. industrial production.
Click charts to enlarge:
From The Blog of HORAN Capital Advisors

As of March 11, the gold/silver ratio stood at 39.3 and this is below the support level of 43 that has held since February 1998. Additionally, the above chart that includes industrial production shows a declining ratio along with improved industrial production activity. For investors then, if they want to use gold and silver prices as an input in their economic forecast, evaluating the gold/silver ratio can be a useful indicator to track.

It May Be Time To Buy U.S. Treasury Bonds Again!


Slowing economic growth is usually a positive for bonds.

Bonds are bought as a safe haven when global stock markets are in corrections. 

My technical indicators have reversed from a timely sell signal on bonds last November to a buy signal.

Bill Gross, founder and manager of PIMCO’s giant Total Return fund, said this week that he is negative on U.S. debt and has dumped all U.S. treasury bonds from his fund. And even that may be a buy signal.

On slowing global economic growth, reports this week from China, the world’s 2nd largest economy, and Japan, the world’s 3rd largest economy, were discouraging.

Japan’s economic growth for the 4th quarter of last year was revised downward to a negative 1.3%. It will not be improved by the devastating earthquake and Tsunami.

China’s economy has been sitting on a real-estate bubble for some time, with 64 million empty housing units created by speculators taking advantage of easy money policies and rising real estate prices. The Chinese government has been aggressively tightening policies and raising interest rates to cool off its economy and ward off rising inflation, with little effect so far. That has raised global concerns that China will have to tighten so much to prevent an inflationary spiral that it will bring its economy in for a hard landing, into a recession. Those fears gained credibility when China shocked global markets with the report Thursday that its economy experienced a surprise trade deficit in February, as the cost of imports, influenced by surging commodity prices, exceeded the value of its exports.

Meanwhile, the world’s largest economy, that of the U.S. is not free of concerns. After months of improving economic conditions, reports this week were of an unexpected 15% increase in the U.S. trade-deficit, a sizable decline in consumer confidence, and oil prices that have spiked up to the level reached in October, 2007 ($96 a barrel), when the U.S. economy began slowing into what became the ‘Great Recession’ of 2007-2009.

Bonds are also attractive as a safe haven in stock market corrections, and many important global stock markets, including China, Brazil, Hong Kong, and India, topped out in November and have been down 12% to 17% in corrections since. The major markets in Europe, which had been holding up well along with the U.S. market, have been down 11 of the last 15 trading sessions, now down about 5% from their levels of three weeks ago.

Our technical indicators, which triggered a timely sell signal for bonds in November reversed to a buy signal a few weeks ago, and indicate that money is flowing back into bonds.

Yes, Bill Gross, known as ‘the bond king’, the famed founder and manager of PIMCO’s $237 billion Total Return Fund, received a lot of media attention this week when he revealed that he had dumped all the fund’s holdings in U.S. treasury bonds as of February 28.

But even that could be a buy signal. Bonds have had an uncanny way of often moving opposite to Gross’s public prognostications.

For instance, four years ago, in June of 2007, Gross predicted U.S. treasury bonds were in trouble and headed for a bear market. Instead, June, 2007 was an excellent time to buy bonds. The 30-year bonds had been in a 7-month correction, and in June reversed into a 9-month rally in which they gained 17%.

More recently, in an interview in Time magazine in early 2010, Gross predicted interest rates were about to begin rising. Bonds move opposite to interest rates, so a rise in rates would be a big negative for bonds. However, once again bonds had already been in a big correction, this time from their highs in early 2009. And instead or rising, interest rates and the yield on bonds began to decline, and Treasury bonds launched into an impressive six-month rally in which 30-year treasury bonds gained 20%.

So now, after the 30-year bond has declined 15% in another six-month correction, Gross is bearish on bonds again, and says he dumped all of his fund’s treasuries as of February 28.

He might be right this time. But it’s interesting that the 30-year bond reached what has so far been the low of its recent correction on February 8, and has rallied up 4% since.

So in spite of Gross’s warnings on U.S. treasury bonds, and the general bearish investor sentiment against them, I believe treasury bonds are oversold again, and are presenting investors with another buying opportunity.

Stock Market Correction Confirmed


The week started with the market remaining in its SPX 1303 to 1332 trading range. During the latter part of the week the lower end of the trading range broke down, confirming an OEW downtrend, and the market traded down to SPX 1292 on friday before recovering during the day. Economic reports remained mostly good with positives beating out negatives 7 : 4. On the positive side, consumer credit continued to expand while wholesale/business inventories, retail sales, excess reserves, the monetary base and the WLEI all improved. On the negative side, the trade/budget deficits expanded, weekly jobless claims increased and consumer sentiment declined.

For the week the SPX/DOW were -1.15%, and the NDX/NAZ were -2.55%. Asian markets lost 2.3%, European markets dropped 2.3%, the Commodity equity group declined 3.4%, and the DJ World index was -2.5%. US Bonds were +0.8%, Crude lost 3.1%, Gold slipped 0.8%, and the USD gained 0.4%. Next week’s reports will be highlighted by housing, PPI/CPI, industrial production, the FOMC meeting and Options expiration. Busy week!

LONG TERM: bull market

After the longest uptrend of the entire bull market, in points and time, the point of recognition has finally been achieved. Remember, this bull market began in March 2009 at SPX 667. The recent February 2011 high of SPX 1344 is slightly more than double the starting point. And only now is the bull market is being recognized as a bonafide bull market. Certainly there are some still calling this entire long term uptrend a bear market rally. They, however, also called the 2002-2007 bull market a bear market rally. Until it started making all time new highs.


The weekly chart above displays the overall wave count for this bull market. From the Mar09 low at SPX 667 the market rallied in five Major waves to complete Primary wave I in Apr10 at SPX 1220. Then the market corrected about 17% to complete Primary wave II at SPX 1011 in July10. After that Primary wave III began. The first wave (uptrend), Major wave 1, completed in Feb11 at SPX 1344. Major wave 2, a downtrend, is now underway. Once this downtrend completes Major waves 3, 4, and 5 will need to unfold to complete Primary wave III. Then we will experience another steep correction to set up the final Primary wave (five) to end the bull market. We’re still expecting the bull market to end in 2012 near or above the 2007 high. Lots of bullish activity yet to unfold in the months ahead.

MEDIUM TERM: downtrend

After much speculation with alternate counts the main SPX count, labeling the Feb10 SPX 1344 high as Major wave 1, proved to be correct. The correction, Major wave 2, has officially just completed its third week. Yet, after the initial decline to SPX 1294 the market went range bound for a couple of weeks, and only made a lower low on friday at SPX 1292. Thus far this has not been much of a correction, only 3.9%. The two previous Major wave corrections were both 9.1%.


After we recieved an OEW downtrend confirmation we were able to post a short term count for this correction. Since this is a Major wave correction it should unfold in three Intermediate waves: ABC. The first Int. wave, wave A, we labeled at SPX 1294. Then the double top rally to SPX 1332 we labeled Int.

wave B. The decline from SPX 1332 should be Int. wave C. Fibonacci relationships suggest three potential downtrend targets: SPX 1282 (wave c = wave a), SPX 1252 (c = 1.6 a), and SPX 1202 (c = 2.6 a). There are four OEW support pivots within that range: 1291, 1261, 1240 and 1222. When we combine fibonacci, the pivots and the typical percentage drop for this type of wave, in this bull market, we arrive at a downtrend target near the OEW 1222 pivot. Naturally, we will be monitoring this decline as it unfolds and keep everyone updated.
SHORT TERM

Support for the SPX is at 1303 and then 1291, with resistance at 1313 and then 1363. There is also some short term resistance at SPX 1308 and 1332. Short term momentum displayed a very slight positive divergence at the friday low and ended the week approaching overbought. With 12 of the 15 world markets we track in confirmed downtrends, it is surprising that only 4 of the 9 SPX sectors are in confirmed downtrends. Either the US market is holding up remarkably well, or, the next selling wave will drive those uptrending sectors lower. The uptrending sectors are: XLE, XLP, XLV, XLY and XLU.

We have labeled the first decline in late February, from SPX  1344 – 1294, as Int. wave A. The double top rally at SPX 1332 in early March as Int. wave B. Intermediate wave C has been underway since then. Since Int. A appeared to be five waves down, we’re expecting Int. C to also be five waves down to complete a zigzag. Currently it appears Minor wave 1 declined to SPX 1304 and Minor wave 2 rallied to SPX 1326. 

The decline from tuesday’s high at SPX 1326 is part of Minor wave 3. Overhead resistance is at SPX 1308, which is within the 1313 pivot range. We would not expect the market to break out of that pivot range. 

Should the SPX rally above 1332 we may have already seen the low for this downtrend. Best to your trading!

FOREIGN MARKETS

Asian markets were all lower on the week for a net loss of 2.3%. Only China’s SSEC remains in an uptrend.
European markets were all lower on the week as well for the same loss 2.3%. All five of these indices are in confirmed downtrends.

The Commodity equity group were all lower on the week for a net loss of 3.4%. Canada’s TSX is downtrending, while Russia’s RTSI and Brazil’s BVSP remain in uptrends.

The DJ World index is also downtrending with a net loss of 2.5% on the week.

COMMODITIES

Bonds, which have been uptrending since the Feb low near 118, gained 0.8% on the week. 10YR yields have declined from 3.74% to just under 3.40%.

Crude has been uptrending since late January, but lost 3.1% on the week. It appears to be in wave 4 after hitting a fibonacci $107 in wave 3. We may see an uptrend top around the fibonacci $111 level.

Gold has also been uptrending since late January. It lost 0.8% on the week after hitting an all time high of $1444 on monday. The current Minute wave ii pullback, if not over, should find support around $1400.

The USD has been downtrending since early January but it gained 0.4% on the week. The currencies have not had much of an impact in recent weeks despite the strong rally in Crude, Commodities, and Gold. All fiat currencies appear to be depreciating in value at about the same rate.

Investor Portfolio Preparation for Hyperinflation, Assets for Protection and Profit


“Happy days are here again! Stock markets are strong, company profits are up, bankers are making record profits and bonuses, unemployment is declining, and inflation is non-existent. Obama and Bernanke are the dream team making the US into the Superpower it once was.

 
Yes, it is amazing the castles in the air that can be built with paper money and deceitful manipulation of all economic data.  And Madame Bernanke de Pompadour will do anything to keep King Louis XV Obama happy, including flooding markets with unlimited amounts of printed money. They both know that, in their holy alliance, they are committing a cardinal sin. But clinging to power is more important than the good of the country.  An economic and social disaster is imminent for the US and a major part of the world and Bernanke de Pompadour and Louis XV Obama are praying that it won’t happen during their reign: ‘Après nous le déluge’…

…most nations seem to have the uncanny knack of selecting the political individuals who will put fuel on the fire and make the situation catastrophically worse.

Greenspan was one such individual. During his 19 years as Chairman of the Fed, he could have limited the economic and social damage that the US would suffer. Instead he took every single measure possible to ensure that there would be a catastrophe with uncontrollable consequences. But we shouldn’t just blame the incompetence of Greenspan. It was sickening to watch every sycophantic congressman and senator licking Greenspan’s boots and praising his wisdom. Because Greenspan’s money printing and incompetent interest rate management created one of the biggest financial bubbles in world economic history. But the politicians loved this.

It made the stock market boom, and house prices surge… And Bernanke de Pompadour is continuing the same disastrous policies of creating money out of thin air. When will they ever learn that creating money out of thin air and running astronomical deficits that never will be repaid with normal money leads to the road of total ruin?... therefore they are leading the world into a hyperinflationary depression that will have uncontrollable and cataclysmic consequences for current and future generations.

Empty stomachs are rioting

We have for years warned about hyperinflation leading to famine, misery and social unrest. Well, this is exactly what is happening in many parts of the world. The protests and overthrowing of regimes in Tunisia, Egypt and Libya are primarily due to a major part of the peoples of these nations having no job, no money and little food. It is their empty stomachs that are rioting…

Although food and fuel inflation is rampant worldwide already, we are only seeing the very beginning…

The Continuous Commodity Index – CCI, (60% food, 17% energy and 23% metals) has almost doubled since the low in early 2009 and has gone up 42% in the last 12 months. The almost vertical rise of the CCI is one of the best indicators of hyperinflation being imminent. A catastrophe of astronomical proportions is looming

Hyperinflation Watch

The following are INDISPUTALBLE FACTS:
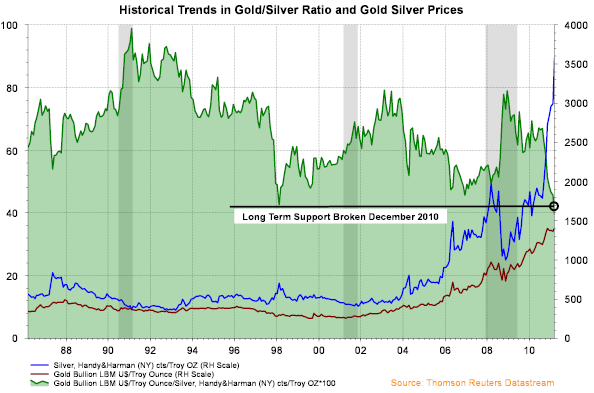
    * The US dollar is down 82% against gold since 1999
    * The US dollar is down 49% against the Swiss Franc since 2001
    * The Dow Jones is down 81% against gold since 1999
    * The Continuous Commodity Index is up 100% since 2009

The above facts are clear evidence of an economy that has been totally mismanaged. But more importantly most of these trends are now starting to accelerate – a clear sign that hyperinflation is just around the corner…

‘There is no means of avoiding a final collapse of a boom brought about by credit expansion. The alternative is only whether the crisis should come sooner as a result of a voluntary abandonment of further credit expansion or later as a final and total catastrophe of the currency system involved.’ –  

Ludwig von Mises

“APRES NOUS LE DELUGE”
Egon von Greyerz, Gold Switzerland, 3/6/11

End of Dollar as Reserve ‘Disastrous’

Billionaire real-estate magnate Sam Zell warns that Americans should brace for a “disastrous” 25 percent decline in the standard of living if the U.S. dollar’s reign as the global reserve currency ever ends.

“Frankly, I think we’re at a tipping point. What’s my biggest single financial concern is the loss of the dollar as the reserve currency,” he told CNBC in an interview. ‘I can’t imagine anything being more disastrous to our country than if the dollar lost its reserve-currency status.’”
Sam Zell, CNBC Interview, 3/2/11

If one considers the Real Numbers, and not the Bogus Official Statistics (see below) or Main Stream Financial Media Talking Heads’ Spin, one realizes that we are at The Very Threshold of Hyperinflation.
In the U.S. for example, Real Consumer Price Inflation is over 9% (see below).

Furthermore, given ongoing Monetary Inflation (e.g. QE 2, and, notwithstanding official Denials, a prospective QE 3 and possibly 4 and 5) Hyper-Price Inflation is probably baked into the Financial and Markets’ Cake.
The recent nearly Vertical Rise of the Continuous Commodity Index (CCI) provides Objective Confirmation of our recent Subjective Experience – Prices of Essential Commodities, Food and Energy, have skyrocketed recently.

Indeed, the Weimar Experience provides further confirmation of our being on the Hyperinflationary Threshold.

The Monetary Explosion in Weimar preceded the Actual Price Explosion by a couple of years. And, we must recall, that Weimar Hyperinflation was then followed by The Great Depression.

Another Hyperinflationary Harbinger is the continuing swoon in the Purchasing Power of the Worlds Reserve Currency – the U.S. Dollar, a Fiat Currency nonetheless.  Thus, it is critical to compare the Real Numbers with the Bogus Official Ones.

Shadowstats.com calculates Key Statistics the way they were calculated in the 1980s and 1990s before Official Data Manipulation began in earnest. Consider

Bogus Official Numbers      vs.      Real Numbers (per Shadowstats.com)
Annual U.S. Consumer Price Inflation reported February 17, 2011
1.63%                            9.07% (annualized January, 2011 Rate)
U.S. Unemployment reported March 4, 2011
8.9%                              22.1%
U.S. GDP Annual Growth/Decline reported February 25, 2011
2.70%                            - 2.21%
U.S. M3 reported March 4, 2011 (Month of February, Y.O.Y.)

No Official Report             - 2.06%

And when we compare the past decades’ Stellar performance of Gold and Silver in all Major Fiat Currencies, we begin to realize that Voltaire’s Observation that “Paper Money returns to its Intrinsic Value – Zero”  may well reflect Ultimate Fiat Currency Reality. And perhaps even provide… Intimations of Zimbabwe in our Future?

And just one more consideration is relevant before providing Guidelines for portfolio Preparation for the Coming Great Hyperinflation.

Historically, and logically, the Run-ups to Hyperinflation are preceded by a period of Price Run-ups for Risk Assets such as Commodities and Stock Markets.

This provides The Illusion of (a Return to) Financial and Economic Health, just as we are seeing now.
But, inevitably, when, as a result of the preceding Monetary Inflation, Price Inflation begin to skyrocket, that Dramatic Price Inflation Chokes Economic Activity, leading to Economic Stagnation and then Contraction. Voila, a Hyperinflationary Depression – “Mega-Stagflation” to Coin a Term.

[We must note here that there is an Alternative Explanation to von Greyerz’ – that the “incompetence of Greenspan and Bernanke is the cause of the impending Catastrophe”. Namely, that the Catastrophe has been planned by Globalists who wish to facilitate the Adoption of One World Currency as a Stepping Stone to One World Government. (See this evidence in Deepcaster’s article – “Saving Investments, Sovereignty, & Freedom from The Cartel ‘End-Game’ (1/13/11)” in the ‘Articles by Deepcaster’ Cache at www.deepcaster.com)]

At this point, it is essential to add one further consideration for Portfolio Construction – Timing.
Consider Energy for example. Early on in a Hyperinflationary Run-up Energy Prices Soar because the Fed-Created (or Eurozone created, etc.) Monetary Hyperinflation (which started the whole process) causes the Purchasing Power of Fiat Currencies to decline (as we are now seeing). Early on, this results in soaring Energy (and other Commodities) prices.

But as the Price Increases in Energy start to Bite, Demand is Reduced, thus slowing Economic Activity, Energy prices are then likely to drop suddenly and dramatically as Demand swoons.

So what Assets are not only resistant to such a Mega-Stagflation, but also provide Profit Potential?

Fortunately, there are three Assets which provide Protection and Substantial Profit Potential for Portfolios.

Gold

First and Foremost is Gold. Throughout the Process from Monetary Inflation (QE 1, 2…3? 4?) to Price Inflation (e.g. beginning now) to Price Hyperinflation and Depression, Gold tends to appreciate (Caveat: But beware of “Paper Gold” and Cartel* Price Suppression Attacks).

*We encourage those who doubt the scope and power of Overt and Covert Interventions by a Fed-led Cartel of Key Central Bankers and Favored Financial Institutions to read Deepcaster’s December, 2009, Special Alert containing a summary overview of Intervention entitled “Forecasts and December, 2009 Special Alert: Profiting From The Cartel’s Dark Interventions - III” and Deepcaster’s July, 2010 Letter entitled "Profit from a Weakening Cartel; Buy Reco; Forecasts: Gold, Silver, Equities, Crude Oil, U.S. Dollar & U.S. T-Notes & T-Bonds" in the ‘Alerts Cache’ and ‘Latest Letter’ Cache at www.deepcaster.com. Also consider the substantial evidence collected by the Gold AntiTrust Action Committee at www.gata.org, including testimony before the CFTC, for information on precious metals price manipulation. Virtually all of the evidence for Intervention has been gleaned from publicly available records. Deepcaster’s profitable recommendations displayed at www.deepcaster.com have been facilitated by attention to these “Interventionals.” Attention to The Interventionals facilitated Deepcaster’s recommending five short positions prior to the Fall, 2008 Market Crash all of which were subsequently liquidated profitably.

Initially, in the Fiat Currency Monetary Hyperinflation phase, Gold, as The Ultimate Money, appreciates because all Fiat Currencies (albeit in varying Degrees) decline in Purchasing Power vis a vis Gold.
And then, as price Inflation becomes Price Hyperinflation, Gold Soars as Fiat Currencies’ Purchasing Power Plunges.

Then, as Economic Depression Sets in (and thus when Fiat Currencies have lost much of their value) Gold tends to Retain its value vis a vis the damaged or Destroyed Fiat Currencies.

One other consideration relates to Gold (and other Precious Metal) Mining Shares. Their Value tends to track Bullion more or less, except that they are after all, and above all, Stocks. Thus, overall Stock Market performance is likely to be a greater determinant of their Value, than their value as actual or potential Precious Metal producers.

Maximizing Value in Precious Metal shares (as opposed to Bullion) is thus in large part a matter of Timing… Generally speaking, they are better purchased near the Bottom of Equities Markets Downlegs.

Silver

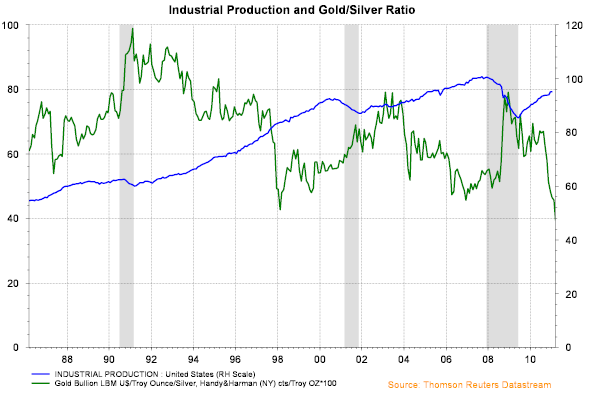
Silver, The Poor Man’s Monetary Metal, can in the Hyperinflationary Process, be expected to perform similarly to Gold, except for the fact that it is also an Industrial Metal, used, and used up, by Industry.

While Gold has recently powered up to trade around its recent all-time Nominal High around $1435ish, Silver is stronger even yet, recently trading around its 21 st Century high of $36/oz.

But it is important to note Silver has recently been acting more like the Monetary Metal that it is, rather than the Industrial Metal that it also is.

The prospect of sustained Higher Oil Prices justifiably exacerbates fears that such high prices will dampen Economic Activity, thus dampening demand for Industrial Metals. But Silver as Safe Haven Money has spiked UP along with Gold and Crude. Indeed, Silver prices are spurred by a Critical and Worsening Supply Shortage of Physical.

Further, Market Intelligence indicates that the Alleged Major Silver Manipulator JP Morgan Chase has recently added 6,000 Short Silver contracts to bring its short holdings to 25,000 contracts – one fourth of total world production! This is either in preparation for a Major Cartel Price Suppression Attack and/or because Silver threatens a Very Serious Breakout. Short-term there will likely be a Takedown Attempt. (See our latest Forecasts at www.deepcaster.com)
Thus we have, and will continue to have, this Very Volatile situation in the Precious Metals Arena with the Contenders being: The Cartel vs. Economic and Financial Reality.

Any perceived diminishment of The Chaos and/or a Major Equities Takedown will surely bring renewed and intensified Cartel Suppression Attacks on the Precious Metals Prices.

As we earlier Forecast, we expect an even more Vigorous Cartel Attack on Precious Metal prices to launch in the next few weeks. Indeed, it may have launched today March 10, 2011, as we write.

We expect the next few weeks will provide a test of The Cartel’s Price Suppression Power.
In the Middle and Long Run, Gold and Silver are likely going higher, much higher.

Caveat: but Consider that Precious Metal Miner and Explorer shares are stocks, and thus tend to mimic overall Equities Market Movements to a degree. In other words, an Equities Takedown would tend to take down Precious Metals shares prices also, but Bullion would tend to be less affected.

And, this is The Key Point, since Silver is an Industrial Metal, we expect Silver Shares would be taken down harder in any equities Takedown. But the Severe Silver Bullion Crunch would tend to keep Bullion Prices elevated.

In sum, we consider Silver Bullion a “Buy” and Silver Shares are a Buy too at the right time.

Food

The Third Protective Category with Profit Potential is Agricultural Products (and Producers) in Inelastic Demand. Whether in a Hyperinflation, or in a Depression, people will buy Food first above all else.
In this Sector, there is one Extraordinary Investment Opportunity, still a “Sleeper” Sector to some degree, which, some would argue, is, at this time, even better than Gold and Silver.

Indeed, we are among those who agree that Gold and, with the right timing, Silver, are Two of the Three Best Investment Opportunities for the Next Decade.

But we must also agree that this “Sleeper” Opportunity may at this time be the Best of All, because there are still several companies in this Sector which are quite undervalued.

Indeed, Deepcaster recently recommended two -- one trading at just over $5/share and the Other at just under $2/share in his most recent Alerts.

And recently, we recommended a third ‘Sleeper’ Sector Industry leader, which has a huge and expanding Asian Market and a recent P/E Ratio of under 4, and which trades under 70 cents/share (in $U.S.) and has Tremendous Appreciation Potential.

To Consider these three “Best of the Best” Sleeper Sector Investments, read our latest Letter – “Main Gold, Silver & ‘Sleeper’ Sector Price Movers; ‘Sleeper’ Buy Reco.; Forecasts: Gold, Silver, Equities, Crude Oil, U.S. Dollar, and U.S. T-Notes & T-Bonds; March 2011 Letter”, and Alert -- “Golden Green Opportunity Buy Reco.; Forecasts: Commodities, Gold, Silver, Equities, Crude Oil, U.S. Dollar, and U.S. T-Notes & T-Bonds” in the ‘Alerts Cache’ at www.deepcaster.com.

In sum, in the Medium and Long Run, we see the aforementioned Equities Bearish Factors overwhelming the Bullish Ones, which will have Severe Negative Consequences for Equities-in-General and for certain Commodities which are in Elastic Demand.

Given this Negative Scenario Safe Havens with Great Profit Potential are Gold, Silver (with Timing Caveats for Shares) and Agricultural Commodities in relatively inelastic demand (such as Wheat and Foodstuffs in general), and businesses focusing on them.

Another important Guideline is that Financial and Economic Conditions are such that we do not recommend shorting Gold and Silver, even in advance of a likely Cartel* Takedown attempt. 

Deepcaster’s recommended response to Cartel Market Manipulation (i.e. especially in the Precious Metals Market) is fivefold:

  1. Buying on Dips, coupled with a Willingness to Tolerate Great Price Volatility
  2. The Core Holdings of Ones’ Precious Metals Position are best held in one particular form (see our Precious Metal Recommendations) of the Physical Metals, in Personal Possession
  3. that Well Managed reasonably priced Miners with Substantial Reserves be bought on Dips, and, if one is a Trader, a portion sold near interim highs
  4. that a portion of One’s Holdings be in a Dividend Paying Precious Metals Fund such as one which we have Recommended, and
  5. Regarding Silver, since it is also an Industrial Metal, it is especially vulnerable to Slowdown in Economic Activity and (especially for the Shares) Takedowns in the Equities
Markets.
In sum, we expect another Markets Crisis will launch in 2011 (and may well already have) and Gold, Silver and Food are the place to be.

Gold and Silver and Essential Food Products and Producers are the most important Means to Profit and Protect regardless of Economic, Financial, or other Market Conditions, when preparing one’s Portfolio for Hyperinflation.

We reiterate, finally, that, given the aforementioned Negatives, a Crisis is likely already “baked into the cake.” The Fed’s (and Eurozone Bankers) Price boosting via Q.E. can not go on forever, and, in any event, Q.E.

worsens the Inevitable Crash because it serves only to pile more Debt upon already Unpayable Debt.
Moreover, the Bond Markets have already been Signaling that Q.E. will result in increasing Inflation and Interest Rates which will Seriously Injure the Equities Markets, and Burst Equities and other Key Asset Bubbles.

The Bond King, Bill Gross (PIMCO) exiting the long-dated U.S. Treasury Market should be a warning to all.
The Wise are Well-Advised to prepare for the Coming Hyperinflation.

See the original article >>

DJIA PRICE OSCILLATOR

by McClellan Financial

DJIA Price Oscillator

March 11, 2011

The McClellan Price Oscillator is one of the more prominent indicators that factors into our analysis of various markets.  It is calculated in the same way as the McClellan A-D Oscillator, except that instead of using the daily Advance-Decline difference as the raw input, we use the closing price or closing market index value.
On that closing price data, we calculate two exponential moving averages that we call the 10% Trend and 5% Trend (AKA 19-day and 39-day EMAs).  The difference between those two moving averages is the Price Oscillator.  These moving averages are not included in this week’s chart, because too many lines tend to clutter up a chart.

When the two moving averages are getting farther apart, the value of the Price Oscillator gets more positive or negative, depending on the relative value of each moving average.  Generally speaking, when the Price Oscillator is rising, the presumed trend direction is upward.  The strongest and most reliable uptrends tend to occur when the Price Oscillator is above zero and rising.

If the Price Oscillator is above zero and falling, it may be the start of a new downtrend, or it may just be a sign of a temporary pullback within a continuing uptrend.  The most risk occurs when the Price Oscillator is below zero and falling.

Also included in this week’s chart is an indicator we call the Price Oscillator Unchanged line.  That line represents the closing value for the DJIA that would be needed in order to make the Price Oscillator go precisely sideways.  If the DJIA is above that line, then the Price Oscillator moves upward.  A close below that line takes the Price Oscillator lower.  It is calculated by adding the value of the 10% Trend (19 EMA) to the value of the Price Oscillator.

As I write this, the DJIA’s Price Oscillator is falling, but it has not yet gone negative.  So we can still make the presumption that the price weakness since February is just a pullback and not a new downtrend.  That presumption would be harder to support if the Price Oscillator crosses below zero.

It is an interesting point that the DJIA’s Price Oscillator can be doing one thing, but the individual Price Oscillators of the 30 DJIA component stocks can be doing entirely different behaviors.  And we have found that there is useful information in those differences.

The chart below shows an indicator we developed years ago that looks at what is happening with all 30 of these stocks’ Price Oscillators, and measures how many of them have a Price Oscillator that is above zero and rising.
DJI Oscillator Positive and Rising Index
The interesting point about this indicator is that by the time we see it move to a very high or very low level, the price trend for the overall market is about done.  It takes a lot of energy for either the bulls or the bears to get everybody moving in one direction, and by the time you see all of the stocks’ Price Oscillators behaving the same way, that energy has been expended.  The current low reading in this indicator is suggestive of a bottoming condition for the market overall.
See the original article >>

Follow Us