by Tom Aspray
The global stock markets had a rough week with the Asian markets hit the hardest but the Eurozone and US were also under pressure. Still, the US averages are holding well above the prior swing lows. The Russian market has been one of the worst, down over 27%, so far this year, and if they are hit with sanctions it will get worse.
The combination of the continuing crisis in the Ukraine and more weak data out of China has increased the fear amongst investors. It is hard to tell how far Putin will push the West as his behavior over the past few years seems to be steroid induced.
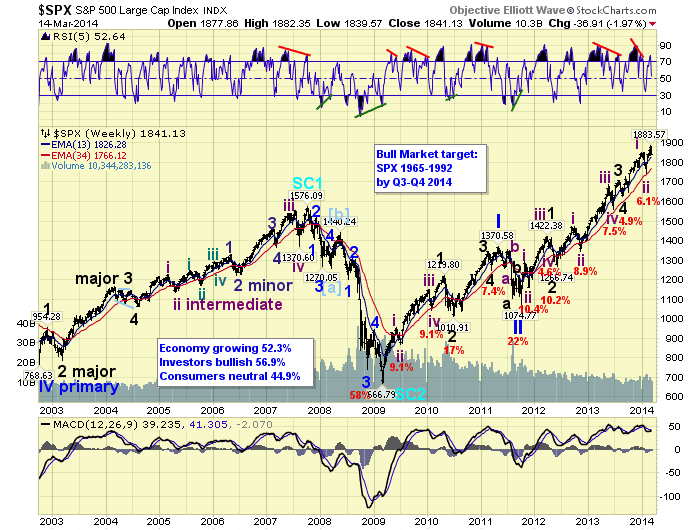
The ups and downs of investor sentiment have been quite typical since the end of 2013 when the bulls dominated, but in just over two months they have become more nervous. Those who decided to buy if the market declined seem to be having second thoughts.
There has been some new buying in the bond market as their safety has become more attractive. As I discuss in more detail in the technical section, given the current stock market outlook, I am not expecting any more than a 5-7% correction, and it could be less. Therefore, I still think it will provide a good buying opportunity in select stocks and last week’s recommendations in Is Your Portfolio Well-Positioned? are generally acting well.

Click to Enlarge
This comparative chart of the German Dax and the S&P 500 Index shows that the recent decline has been much worse in the German market. Since the June 2012 low, it is sill up over 51% vs. 43.5% for the S&P 500. However, the Dax is down 11% since the late-February high while the S&P 500 is down just a bit over 2.5%.
The fact that the Dax has dropped below both the December 2013 and February 2014 lows has weakened its chart. The concern over the euro’s strength has jumped in the past week as the ECB already seems to be questioning its recent decision on rates.
So what are the prospects for buying bonds now? The yield of the 10-year T-note shows the spike in yields two weeks ago to 2.82% but they have since dropped down to 2.63%. The broad trading range (lines a and b) that we have been watching for the past two months is still intact.

Click to Enlarge
The key support in terms of yields is in the 2.47% to 2.50% area with the October 2013 low at 2.47%. The completion of the major bottom formation in May of 2013 does still suggest that this range is a pause in the trend towards higher rates.
A strong weekly close in yields above 3.02% would be an upside breakout and signal a move to the 3.4-3.5% area. For those in the short-duration bonds (5.6 years), as represented by the Barclays US Aggregate Bond Index, this would mean about a 5.4% drop in the value of their bonds. Since old bonds would be replaced by newer ones at higher yields, the damage would likely be less.
If the average maturity of your bond holdings is 13.4 years, such an increase in yields could mean over a 13% loss. Of course, the long-term bonds will do even worse as they were down 12.7% last year. Since the start of last summer, I have been recommending that bond holders shorten the maturity of their bond portfolio. On the technical side, the downtrend in the weekly MACD (line c) continues to favor lower yields for now.
Therefore, the investor has to decide between the current 2.3% yield of short-duration bonds that have a potential downside of 5% if rates spike and the stock market rallies. I continue to think the S&P 500 will show double-digits gains some time in 2014. Of course, if you are buying below the 2013 S&P 500 close of 1848, it could be even greater. The risk is that you will bail out if the selling gets too ugly and not be on board for the inevitable rebound.
The US economic data was mixed last week because while the retail sales data on Thursday was better than expected, the initial reading on consumer sentiment for March from the University of Michigan came in at 79.9. Nevertheless, the chart shows a clear uptrend and I continue to think that the consumer has lots of pent-up demand that should be evident once the weather warms.
The markets have quite a bit of data to digest this week because along with the FOMC meeting, there will be new data on manufacturing and the housing market. I would not be surprised if some of the data is better than expected. If it is, then it will be interesting to see how the stock market will react.

Click to Enlarge
On Monday, we get the Empire State Manufacturing Survey and Industrial Production, followed on Thursday by the Philadelphia Fed Survey. Over the past month or so, the soft housing data has turned some negative on the growth prospects for the homebuilders in 2014.
Technically, the group became a market leader in February and the recent correction has not broken any key support. On Monday, we get the latest reading on the Housing Market Index, which dropped sharply last month but still shows a long-term uptrend. It is followed by Housing Starts on Tuesday and then Existing Home Sales on Thursday.

Click to Enlarge
On Tuesday, we also get the Consumer Price Index, and then on Wednesday, the FOMC announcement followed by the first press conference by new Fed Chair Janet Yellen. On Thursday, in addition to the jobless claims, we have the latest data from the Conference Board on their Leading Economic Indicators (LEI).
The chart from last month’s release shows that both the LEI and the Coincident Economic Index (CEI) are both in clear up trends. They show no hint of a recession on the horizon, and in the past, they have a done a good job of warning of recessions in advance (see circle).
What to Watch
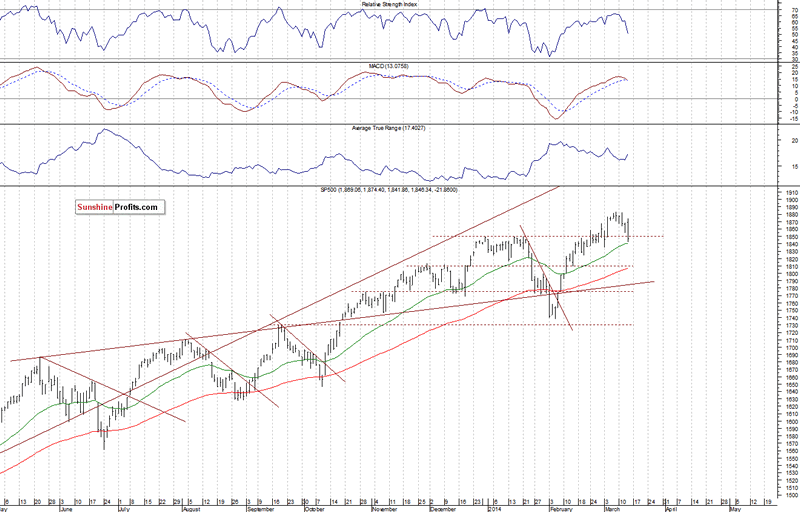
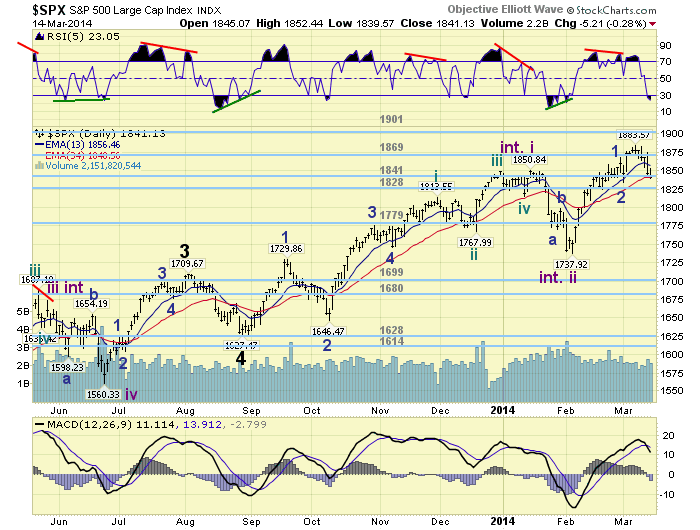
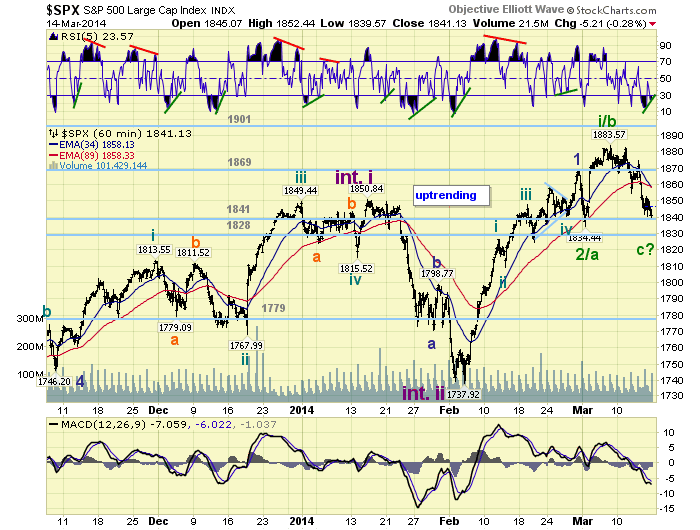
The bulls faced another test last week, and while there were no signs of panic selling, we had seen in the prior week that some technical damage was done. This could be part of a top-building process that will lead to a longer and deeper correction. If instead the market is able to rally strongly from slightly lower levels, it would allow for another test of the highs.
This is my favored scenario for now based on the recent new highs in the A/D line, which continue to provide a positive intermediate-term outlook for the stock market. There continues to be sector rotation as the Select Sector SPDR Utilities (XLU) formed a short-term top in February but took over leadership again last week.
In this type of environment, it is important to monitor your portfolio on a regular basis to be sure your holdings stay above their support levels. It is best to spend some weekend time doing this, and I adjusted some of the stops in the Charts in Play portfolio last week and took some profits.
Once again, the sentiment showed little change last week. According to AAII, 41.34% are bullish, up 1%, while the bearish percentage was unchanged. It may be a different story in the coming week’s survey.

Click to Enlarge
There has been a significant change in the percentage of S&P 500 stocks above their 50-day MAs. The five-day MA turned down on Thursday to 73.0% after just exceeding its previous peak. The next key level to watch is the mean at 62%.
The daily chart of the NYSE Composite shows the drop below the 20-day EMA last week. It is now at 10,360. The market has held, so far, above the monthly pivot support at 10,209 (line a) with the quarterly pivot at 10,082.
There is further support in the 9900 to 10,000 area and the uptrend, line b, which is currently at 9800. Initial resistance stands now in the 10,400-500 area.
The McClellan oscillator has been diverging from prices (line c) for a few weeks and broke below support early last week. It turned up on Friday, and so far, has held above its recent lows and the support in the -173 area, line d.
The daily NYSE Advance/Decline made a new high on March 6, but dropped below its WMA last week. The WMA has flattened out and will need a day or so of strong A/D numbers to turn it higher. The A/D line has further support at the January high and the uptrend, line e.

Click to Enlarge
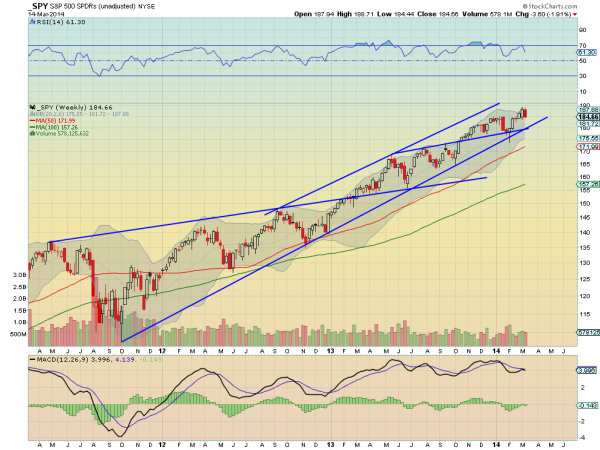
S&P 500
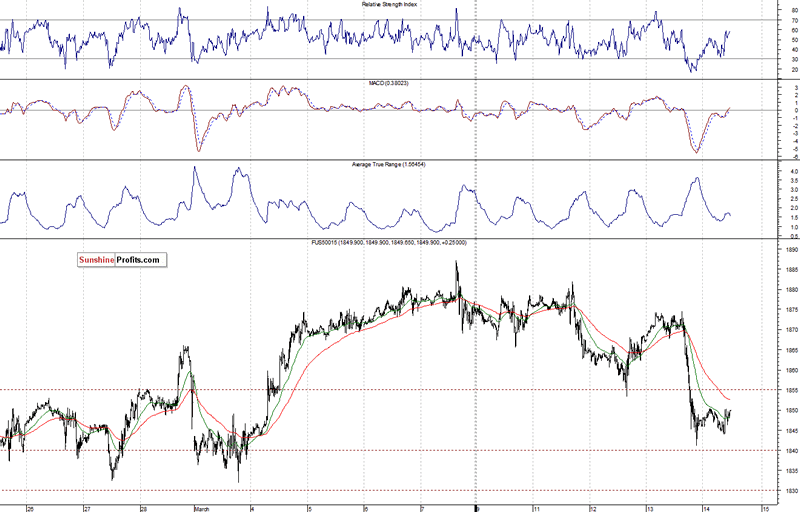
The daily chart of the Spyder Trust (SPY) shows the four lower closes in the past five days as it also closed Friday below its 20-day EMA. The daily starc- band is now at $183.38 with the 38.2% Fibonacci retracement support at $182.97.
The monthly pivot stands at $182.38 with the 50% support at $181.08. The quarterly pivot and the monthly projected pivot support are at $117.67.
The Arms Index (TRIN) closed at 2.28 last Thursday, which is a quite oversold level as on the March 3rd drop, it closed at 1.58. At the February low, it was much more oversold.
The daily S&P 500 A/D line also made a new high but dropped further below its WMA last week than the NYSE A/D line. A rally failure at the now flat WMA would be a negative sign as it could set the stage for another wave of selling. The A/D line has next strong support at the early 2014 highs, line b.

Click to Enlarge
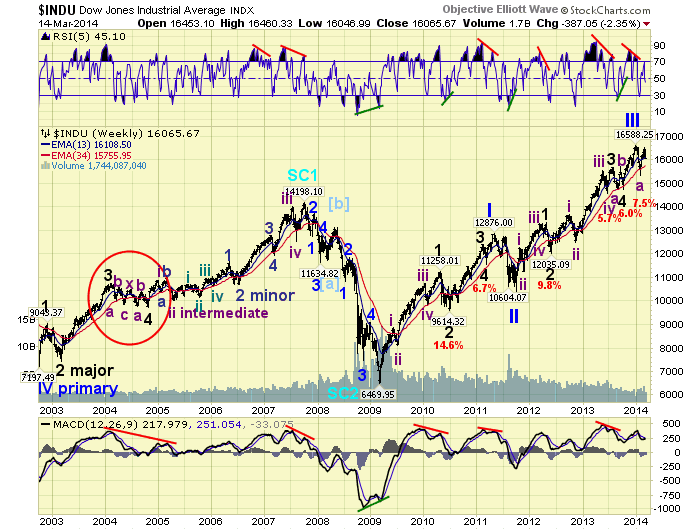
Dow Industrials
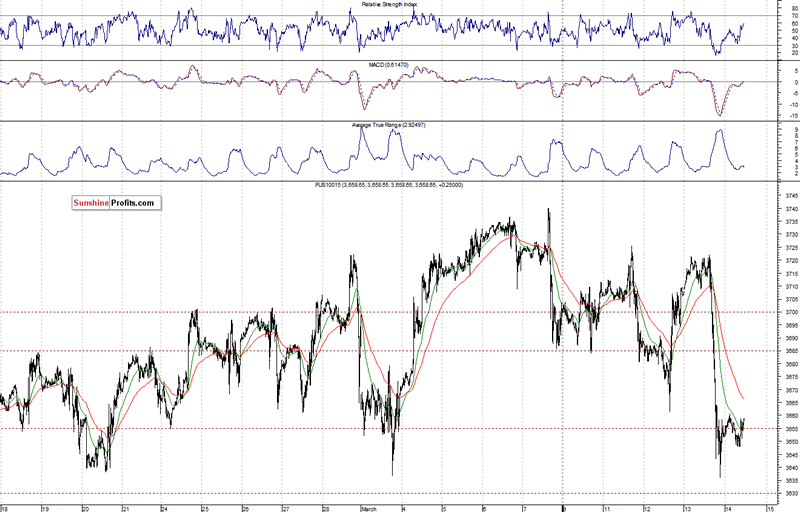
The SPDR Dow Industrials (DIA) tested its daily starc- band last week, which is now at $159.22 with the monthly pivot a bit higher at $159.83. The quarterly pivot is at $158.58 and a weekly close under that level would be negative. There is additional chart support at $157.14, line c.
There is initial resistance now at $162.40-$163 and then at $164.49.
The daily on-balance volume (OBV) has turned lower after just rebounding to its former uptrend. It has been diverging from price since it peaked at the end of 2013. The weekly OBV (not shown) is very close now to closing below its WMA.
The daily Dow Industrials A/D line shows a longer-term pattern of higher highs, line f, but did drop back below its WMA last week. There is major support for the A/D line now at line g.
Nasdaq-100
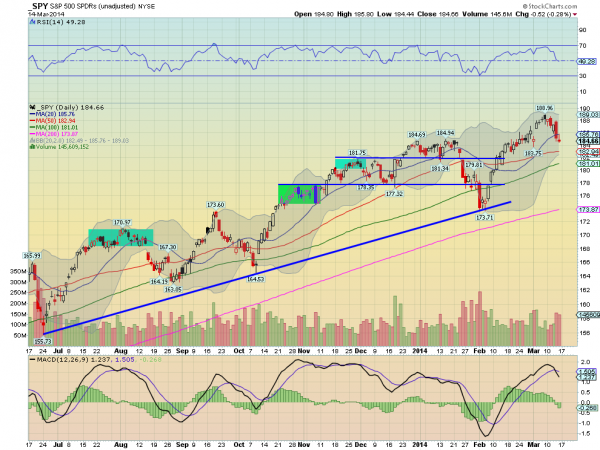
The PowerShares QQQ Trust (QQQ) has dropped about 2.7% from its high at $91.36. It closed the week below $88.94 so a weekly low close doji sell signal was triggered.
There is next support at $88.53 with the monthly pivot for March at $88.25. The daily starc- band is at $87.91 with the monthly projected pivot support at $85.50. The quarterly pivot and major support is at $83.66.
The daily OBV shows a clear pattern of lower lows as it failed to move above its WMA on the recent rally. The WMA is clearly declining. The daily AOT moved firmly into the sell mode on March 6.
The daily relative performance (not shown), as I noted last time, had dropped below its WMA and has now also broken its uptrend and is in a clear downtrend
The Nasdaq 100 A/D line did make its high on March 5, but dropped below its WMA and the previous lows last week. It is still well above the major support at line d.

Click to Enlarge
Russell 2000
The iShares Russell 2000 Index (IWM) did manage to close above its 20-day EMA and above the support at $115.49. The monthly pivot is at $114.50 with the quarterly pivot well below current levels at $111.31.
There is initial resistance now at $119-$119.80 and then above $120.
The daily OBV has turned up from the support at line f, but is still well below its WMA. The weekly OBV (not shown) is still above its WMA so the multiple time frame OBV analysis is now mixed.
The Russell 2000 A/D line did turn up on Friday but just barely moved through resistance at line g, as prices were breaking out.
See the original article >>


