Saturday, June 11, 2011

ZINCO - ANALISI DI BREVE E MEDIO

by Metalli Blog

Per il mercato dello zinco si prospetta una fase di ribassi nel breve periodo. Il calo della domanda da parte della Cina rischia di far cadere i prezzi soprattutto nel paese asiatico, dove le fonderie sono state costrette a ridurre la produzione già in aprile-maggio, nella speranza di non vedere crollare i listini. 

Gli effetti di una domanda fragile dovrebbero manifestarsi in particolare tra giugno e agosto: i produttori si attendono quotazioni attorno ai 17 mila yuan (2.623 dollari) per tonnellata per la vendita spot, mentre alL’LME il metallo è scambiato intorno a 2.260 dollari/tonn., in calo del 7% dall’inizio dell’anno. 

Secondo Li You, analista di Minmetals Futures a Shenzen City, lo zinco, dal punto di vista dei fondamentali, è il peggiore tra i metalli di base: le fonderie potrebbero tagliare la produzione e la domanda di minerale potrebbe ridursi. Già ora molte fonderie di zinco affermano di lavorare in perdita, visto che i prezzi del concentrato sfiorano i 13mila yuan per tonnellata. 

Con la produzione in calo, la conseguenza è che oggi le riserve di zinco, dopo essere salite più del 50% tra gennaio e aprile 2010, si sono rapidamente assottigliate e ora ammontano a 1,3-1,5 milioni di tonnellate. Molto basse e non mancano tra gli analisti, coloro che sono convinti che sia da mettere in conto una lenta ma sostanziosa ripresa degli ordinativi. 

Gli ottimisti – che sono convinti che lo zinco prenderà il posto del rame nelle mire degli investitori – ritengono infatti che la richiesta di metallo dovrebbe riprendere a partire da settembre quando scatterà l’imponente piano sviluppo immobiliare (da 10 milioni di nuove abitazione a basso prezzo) previsto dal Governo.

zinco cash in $

Expect Market to Soften as Crop Conditions Improve


This information is provided by Archer Financial Services, Inc. 800-933-3996.

The USDA Monthly Supply was the headline grabbing information this week in a week that saw corn values begin with a $.25 decline from last week only to end the week $.33 above last week’s close in July Corn.
What appeared to be a very mildly bullish report was met with limit gains on Thursday as the trade was surprised that the USDA chose its June S&D Report to make some most necessary changes. Anyone that is remotely acquainted with the grain markets and has only slightly followed Midwest weather conditions, has expected a downward adjustment in the planted acreage figures for corn. The only surprise was that the adjustment was made on June 9 and not June 30.

There may yet be another 500,000 acres shaved off of that figure in 2 ½ weeks. The real surprise may have been in the long overdue adjustment made in the world balance sheet as global corn carryover stocks declined by 17 MMT. Even this has been discussed in the marketplace and by national grain associations for the better part of 8 months. It appeared that the market was expecting a benign report and when surprise adjustments were made the reaction was an overreaction. 

The late-week rally provided a great opportunity for producers to hedge some new crop corn production above $7. As crop conditions improve, look for the market to soften and work back towards the middle of its recent trading range in preparation for what will most certainly be a critical and large price moving report in 20 days. Whether we are able to exceed this week’s highs and by how much will not be based on any information that we received this week, but by the data received in the June 30 Stocks and Acreage Report and how the weather plays out the rest of the summer. Make sure you are prepared for the volatility.


Wheat needs to get used to playing second fiddle to corn

by Mike Verdin

Corn is making a better fist of keeping its premium over wheat in Chicago this time round. That looks a taster of their relationship for a while to come.
Sure, wheat made an effort on Friday to close its, unusual, discount over the rival grain, regaining some 10 cents per bushel of ground, July contract to July contract.
And its defence of its premium for further-ahead contracts looks pretty solid given the rewards for holding on to grain which were introduced last year by Chicago to close the gap between cash and futures prices.
But wheat had better get used to being overlooked for its apparently greater intrinsic value than corn, being considered, for instance, as a rule of thumb 15% better as a feed source.
Feed dynamics
Time is one factor on corn's side. The beginning of the winter wheat harvest in southern US states - and a better-than-expected start too – as well as in southern Europe will bring fresh supplies to the market, a depressant to prices, besides removing the need to price weather risks into harvested crop.
For corn, which in some US states is being harvested right up to Christmas, this cycle is later.
But demand is in the grain's favour too. Of course, corn's price should underperform wheat's if the grains' relative feed values were all that mattered.
They aren't. Domestic feed use of corn, while now expected by US officials to rise only by 10m bushels in 2010-11, is looking pretty resilient given that production of all major protein types has been cut back, compared with pre-recession levels. Many farmers are reluctant to give up on tried and tested corn-based feed formulas.
And recovery in cattle and hog prices from late-May lows will ease pressure for fresh herd reductions.
Ethanol hunger
Nor does it look safe to bet to assume exports will take all the rap.
The prospects of Chinese corn imports only appear enhanced now its inventories as of the close of 2010-11 have been pegged by the US Department of Agriculture at 53.7m tonnes – 5m tonnes less than previously thought.
And as for corn's use in making biofuels, it looks like requiring a significant drop in the oil market to throw bioethanol plants off course.
US ethanol production hit its highest since January at the start of the month, even with oil prices well below April highs.
Supply comparison
It is hard to argue with the USDA's assessment of both US and world corn stocks ending 2011-12 at historically tight levels.
That warrants quite some premium over normal prices. Certainly more than for wheat, for which supplies are distinctly more ample, and may prove even moreso if the benign early conditions for southern hemisphere producers follow through.
When corn rose above wheat in April, for the first time since 1996, the premium only lasted two days. This spell has already lasted twice as long.
Wheat may have to get used to more frequent, and lengthier, spells in second place.

See the original article >>

Homebuilders and Shanghai Index break down at the same time!

by Climbe Charting Solutions


Dollar Strength could push Stocks and Commodities much lower!

by Climbe Charting Solutions


See the original article >>

Long-Term Chart of S&P 500

by Bespoke Investment Group

Investors who follow the day-to-day moves of the market can easily lose perspective of long-term trends, so it's important to analyze multi-year price charts on a regular basis. Below is a four-year chart of the S&P 500, which includes the nasty bear market that occurred from 10/9/07 through 3/9/09 as well as the bull market bounce we've seen since 3/9/09. While the market's action has been anything but positive over the last six weeks, the S&P 500 remains inside its multi-year uptrend channel, and the recent decline hasn't done much to dent that trajectory. There are some key technical support levels coming up, however, especially between 1,230 and 1,250, but even if these levels are broken, the market would still not be in official correction territory (a 10% decline from a bull market high). While the bears have led the way since the start of May, they have a long way to go before putting an end to this bull market. 


See the original article >>

THE ECONOMIC ICE AGE

by Cullen Roche

Some pretty interesting thoughts here from Societe Generale on the economic “ice age”. This is what their analysts refer to as the period after a bubble bursting has occurred. They’ve used the same Japan analogy that I am fond of. Pretty pessimistic thoughts (more so than mine), but I think they’ve got the macro situation understood better than most:
“In the aftermath of last week’s stunningly weak economic data the market is now beginning to acknowledge that, without a further round of QE a relapse back into economic stagnation or recession surely beckons.
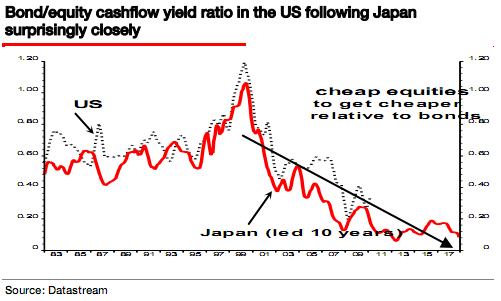
In the post-bubble world, economic downturns = the most dangerous phase in the cycle. Both equity PE’s and government bond yields will make surprising new lows for a consensus totally convinced of extreme cheapness of equities and expensiveness of government bonds.
So, this week we revisit some of our old favourite “Ice Age charts” to see how far advanced we are in out post-bubble long march. The one below shows the US de-rating in exactly the same way Japan did a decade earlier.
The ice age theme = in a world of very low inflation, equities de-rate both absolutely and relative to government bonds. After equity valuations extremes seen during the 2000 bubble, we have entered a long valuation bear market which should end in extreme levels of cheapness consistent with an S&P around 400 and the unavoidable deep recession will drag an already “expensive” bond market to even higher levels.”
Sorry to ruin your pre-weekend with that delightfully bearish note. If it makes you feel any better, I think S&P 400 is extreme to say the least, but then again, I foresaw the housing crash and didn’t think equities would decline to 666 so I’ve been wrong before….

See the original article >>

Sugar Outlook Sweetens


The drop in sugar prices is over. In fact, prices have risen to an eight-week high after news broke that Brazilian production may fall short of expectations. 

My indicators are telling me that sweet prices could get even sweeter.

Here are a few significant factors that could move this market:

India’s export threat has disappeared. For months, sugar prices have been held hostage to the idea that India would regain its position as a global sugar exporter; as India is the second-largest producer. Fearing a rise in domestic prices from a domestic crop shortfall, the country is unlikely to set a new quota until fall. The current gap is being filled by Thailand.

China needs sugar. Sugar imports by China, the second-biggest consumer after India, may advance to 2.3 million metric tons in the year ending September 30. With the export price from Brazil or Thailand about 25 cents a pound, that makes it more attractive to China, even with an import tariff of 50 percent. The higher import volume is 28 percent more than the U.S. government forecast!

The United States is short on sugar. The U.S. Department of Agriculture has projected decreased U.S. sugar supply for 2012 with lower imports offsetting higher beginning stocks and production. A potential drop in home-grown sugar coupled with government caps on imports could drive up prices, just before the peak Christmas season.

A harsh winter has caused headaches for U.S. sugar-cane and sugar-beet farmers. Record cold temperatures in December damaged sugar cane in Florida, taking about 260,000 short tons of raw sugar out of production, according to the USDA.

Currently, soil soaked by snow melt and ongoing cool and wet weather in the Midwest is delaying the planting of sugar beets, the source of more than half of U.S. sugar production. The delays could reduce yields because the sugar content of the root increases the longer it is in the ground

The European Union wants sugar too. A European Union (EU) committee recently voted to open a quota for 200,000 metric tons of duty-free sugar imports into the bloc. EU sugar prices surged to more than 1,000 euros a ton in some places earlier this year as the domestic market suffered a supply crisis that left refiners in Portugal, Greece and Poland struggling to access supplies.

Even Mexico increased import allowances, adding to signs that demand is strengthening.

Sugar’s Brazilian Factor: This pretty much puts control on sugar in the hands of the Brazilians, the primary exporters. But Brazil is not overflowing with sugar either. Conditions have been building up against the sugar crop.

The low sugar prices of 2008 and 2009, the financial crisis impact on capital, and recent unstable weather have all contributed to a financial squeeze on farmers. In turn, the investment in crops is less than it could have been.

Brazilian cane crops are older and less efficient than they should be. Sugar cane is now aged 4.2 years, on average, whereas the ideal would be 2 years of age. Ideally 20 percent to 25 percent of the new crop should be replanted. That’s not happening, so yields are lower.

Once the crop is ready, the main issues are crushing and processing. Today, with the higher use of sugar to meet Brazil’s rising need for ethanol, a larger part of the Brazilian sugarcane is being diverted into ethanol fuel production than in the past. This further diminishes sugar for food availability.

The state of São Paulo, which answers to 70 percent of Brazilian production, should pick 4 million tonnes less than in the previous crop.

Ultimately, the big issue in Brazil may be access to capital for small farmers.

Brazil has the world’s second-highest inflation-adjusted interest rates in part because the government subsidizes lending through BNDES, its national development bank.

Last month, Brazil’s central bank announced a 25 basis point increase to the Selic rate, bringing it to 12 percent from 11.75 percent previously on concerns the Brazilian economy is overheating. This benchmark rate is almost double that of China and India, and 3 percentage points more than Russia’s.

Over time, the nation is planning to cut funding to its state development bank (BNDES) in an effort to bring down rates. But BNDES is a critical engine that runs the Brazilian economy and influences the flow of capital to agriculture.

So it’s not just weather that impacts the price of sugar. When weather strikes a system that is already under financial strain, prices worsen as supply dwindles.

The delay is set to worsen bottlenecks at ports this year as growers rush to ship the sweetener. A record 600 ships loaded sugar last year at Brazil’s Port of Santos, which handles about 80 percent of the nation’s shipments of the sweetener, according to the port’s press office.

This is likely to create a critical situation that would further spike prices in coming weeks. With the delays, more shipments will be concentrated in the July and October contracts, when the lineup tends to be normally much longer.

Markets can be sensitive to news about shipping delays.

Last February, Cosan Ltd (CZZ), which controls the world’s largest sugar-cane processor, along with Royal Dutch Shell (RDS.A), said quarterly profit plunged 83 percent after a cane shortage boosted costs.

Cosan is the largest sugar and ethanol producer in Brazil and ranks third in sugar and fifth in ethanol production in the world. Apart from its core operations, the company is also engaged in energy production from sugar-cane bagasse. CZZ shares fell to a five-month low in response to the disappointment.

In the last week, CZZ shares rebounded on news that recent shipping delays will continue and that world sugar prices are rising. As you know, this is one of my favorite stocks, and I’ll be watching it closely for an entry point at lower prices or news that works as a catalyst to drive Cosan’s valuation higher.

See the original article >>

1 Simple Chart With 4 Reasons Why We Are Heading Lower


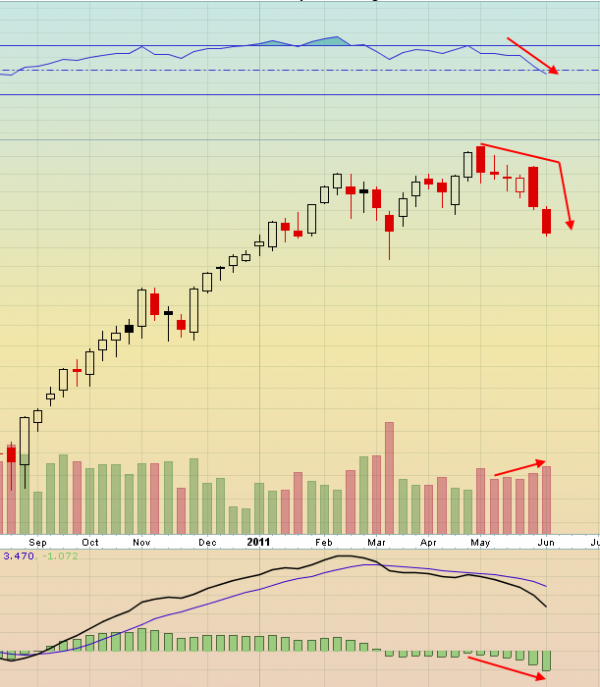
Four items on this chart are all I need to see that the trend is down going into next week.

6 10 2011 4 17 16 PM1 e1307737683617 stocks
1. Price is not only falling but increasing its pace of decline and printing loner body red candles along the way.

2. The Relative Strength index at the top continues its fall and is through the mid line, also gaining negative slope.

3. As the price is falling the volume bars are increasing in size.

4. The Moving Average Convergence Divergence indicator at the bottom of the chart continues to grow more negative.

This is what I am looking at. Not the actual price (notice it is not there). I could add some trend lines, support and resistance lines, Bollinger bands or Fibonacci’s but these four items tell me what I need to know about the trend. How about you? What do you look at?

See the original article >>

Stock Prices Have Fallen For Six Weeks In A Row

by The Economic Collapse

Well, it's official. U.S. stock prices have fallen for six weeks in a row. So will next week make it seven? The last time stocks declined for seven weeks in a row was back in May 2001 when the "dot-com" bubble was bursting. At this point, the Dow has declined by approximately 5 percent since the beginning of June. Things don't look good. So exactly what is going on here? Well, it is undeniable that the recent mini-bubble in stocks has been too good to be true. The S&P 500 had surged nearly 30 percent since last September. Much of this has been fueled by the Federal Reserve's latest round of quantitative easing, but now that is coming to an end in a few weeks and investors are a bit spooked. Meanwhile, wars and revolutions are sweeping the Middle East, Japan is dealing with the damage caused by the tsunami and by Fukushima, Europe is trying to figure out how to bail out Greece again and the U.S. debt crisis is continually getting worse. In addition, wave after wave of bad economic news is certainly not helping the mood on Wall Street. In many ways, a "perfect storm" is developing and many are now extremely concerned about what the rest of 2011 is going to bring for Wall Street.

QE2 is slated to conclude at the end of June, and many investors are deeply disappointed that it does not appear that we are not going to see QE3 right away. Many fear that the end of quantitative easing will pop the current mini-bubble in stocks and commodities. At the moment, financial markets are more jittery than they have been in a long time.

Frank Davis, director of sales and trading with LEK Securities, says that there is a lot of pessimism on Wall Street right now....
"There's a lot of emotion in this market at the moment, and the conversations among traders are nearly all leaning toward the bear side"
So what are some of the signs that this downturn on Wall Street may turn into a full-blown crash?
Well, according to the Wall Street Journal, junk bonds are being sold off at an alarming rate right now. Does the following quote from the Journal remind anyone of 2008 at least a little bit?....
A steep decline in prices of bonds backed by subprime mortgages has spread through the riskiest segments of the credit markets, ending rallies in high-yield corporate bonds and commercial real-estate debt.
Also, many of the big Wall Street banks are already laying off workers. In a previous article I wrote about the potential for Wall Street to go into "panic mode", I noted that Goldman Sachs, Bank of America, JPMorgan Chase and Morgan Stanley are all laying people off or are considering staff cuts.

The truth is that the big banks on Wall Street are not nearly as stable as most people think that they are. Moody's recently warned that it may downgrade the debt ratings of Bank of America, Citigroup and Wells Fargo.

Another major story on Wall Street right now is oil. OPEC recently announced that oil production levels will not be raised, even though the price of oil has been hovering around $100 a barrel.

World oil supplies are very tight right now. In fact, the globe actually consumed 5 million barrels per day more oil than it produced during 2010. This was possible because the difference was apparently made up by drawing down reserves.

But if oil supplies are this tight already, what is going to happen if a major war (as opposed to all of the minor wars that are already happening) erupts in the Middle East?

The world is sitting on the edge of a financial disaster.

It is important to keep in mind that Europe is also in far worse financial condition than it was just prior to the financial collapse of 2008.

It is being reported that German finance minister Wolfgang Schaeuble is convinced that a "full-blown" financial meltdown by Greece is a very real possibility. The cost of insuring Greek debt has soared to a brand new record high, and officials all over Europe are in panic mode.

But financial problems are not just happening in Greece. The largest bank in France has just cut in half the amount of cash that customers can withdraw from ATMs each week.

Most Americans don't spend much time thinking about the financial condition of Europe, but the truth is that what happens in Europe is going to play a major role in the months and years ahead.

Of course most Americans already know that the U.S. government is a financial mess.

As the "debt ceiling deadline" of August 2nd draws closer, the U.S. government has been raiding retirement funds in order to stay under the debt limit.

Many investors are quite nervous about what may happen if the U.S. government actually does start defaulting on debt on August 2nd.

Others claim that the U.S. government is already in default.

The only Chinese agency that gives credit ratings on sovereign debt says that the U.S. government "has already been defaulting" and the Chinese government has been repeatedly warning that the U.S. needs to get its finances in order.

In any event, this debt ceiling drama will get resolved one way or another.

The bigger question is this....

How is the U.S. government going to respond when the next financial crash happens?

Back in 2008, the Federal Reserve and the U.S. government took unprecedented steps to prop up Wall Street.

But can they really do that again if we see another major crash in 2011 or 2012?

Many believe that things will be totally different this time around. Just check out what Jim Rogers recently told CNBC....
"The debts that are in this country are skyrocketing," he said. "In the last three years the government has spent staggering amounts of money and the Federal Reserve is taking on staggering amounts of debt.
"When the problems arise next time…what are they going to do? They can’t quadruple the debt again. They cannot print that much more money. It’s gonna be worse the next time around."
Jim Rogers is right about that.

The next time we see a collapse on the scale of 2008 it is going to be a much bigger mess.

Global financial markets are extremely vulnerable right now and there are a whole host of potential "tipping points" which could push them over the edge.

The Federal Reserve and the U.S. government more or less used up all of their ammunition on the 2008 crisis.

If we see another collapse in 2011 or 2012 there is not going to be much of a safety net available.

The entire world financial system is simply swamped with way too much debt.

The world has never seen anything even remotely close to the gigantic mountains of debt that have been accumulated around the world today.

The current global financial system is not sustainable. More crashes are inevitable. A lot of people are going to get steamrolled.

Hopefully you will not be one of them.

See the original article >>

Follow Us