by
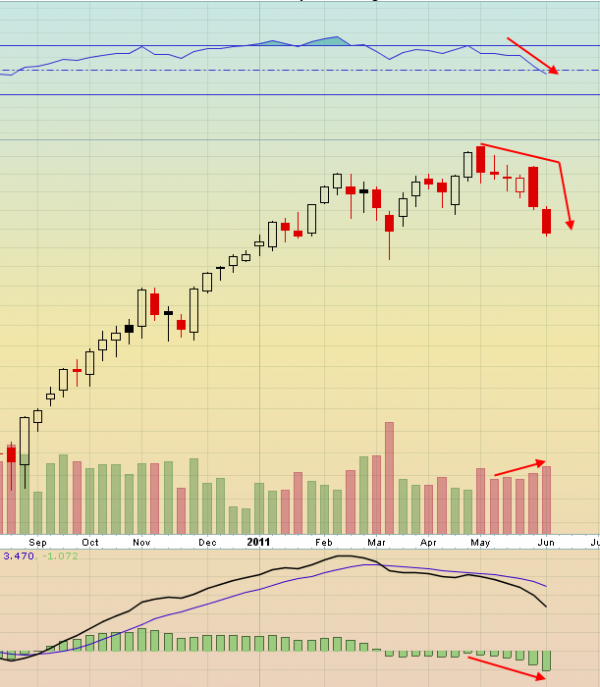
Four items on this chart are all I need to see that the trend is down going into next week.

1. Price is not only falling but increasing its pace of decline and printing loner body red candles along the way.
2. The Relative Strength index at the top continues its fall and is through the mid line, also gaining negative slope.
3. As the price is falling the volume bars are increasing in size.
4. The Moving Average Convergence Divergence indicator at the bottom of the chart continues to grow more negative.
This is what I am looking at. Not the actual price (notice it is not there). I could add some trend lines, support and resistance lines, Bollinger bands or Fibonacci’s but these four items tell me what I need to know about the trend. How about you? What do you look at?
No comments:
Post a Comment