by Greg Harmon
Last month in this space my Monthly
Macro Review/Preview suggested that the monthly charts had shifted to
showing Gold ready to move higher in the coming months along with US Treasuries
while Crude Oil and the US Dollar Index are biased to the downside. The Shanghai
Composite and Emerging Markets were set to slowly drift lower in a sideways
consolidation. Volatility was on the edge of a break higher at a critical level.
A move above 28 would signal regime change while a fall back, more of the same.
This was reflected in the Equity Indexes as well with the SPY, IWM and QQQ all
consolidating with indicators starting to point negative, but holding in their
ranges. A catalyst that pushes them higher could lead to a major rally. The QQQ
is the strongest of the Indexes as of the end of July.
Gold and US Treasuries held true to the charts and moved higher, a lot
higher, while the US Dollar Index and Crude Oil consolidated. The Shanghai
Composite and Emerging Markets also drifted lower as anticipated in the charts.
Volatility took the high rode and held higher all month concurrent with a move
lower in the Equity Index ETF’s. A month that was true to the technicals. How
does the month impact the longer term picture. let’s look at some charts.
As always you can see details of individual charts and more on my StockTwits feed and on chartly.)

Gold broke above the rising two year trendline resistance and did not look
back until it ran near the 10 year resistance line at 1917.00. The Relative
Strength Index (RSI) remains elevated, but under 80 and the Moving Average
Convergence Divergence (MACD) indicator continues to move higher. These
indicators along with the Simple Moving Averages (SMA) sloping higher and volume
increasing point to more upside for Gold in the coming months. Support for any
pullback now stands at 1720 and 1550 below that while a move over 1970
resistance may slow it down.

Crude Oil printed a Hammer candle this month, a possible reversal if
confirmed higher, giving hope that the short move lower may be ending. But the
RSI continues to look lower as it hits the mid line and the MACD is about to
cross negative, both suggesting more downside to come. The upside should be
capped by the overlapping Fibonacci levels a between 95.36 and 96 if it can get
above the Upper Median Line of the bearish Pitchfork. Downside support comes
first at 84.10 and then 79.12 and 74.43 before strong support at 71.
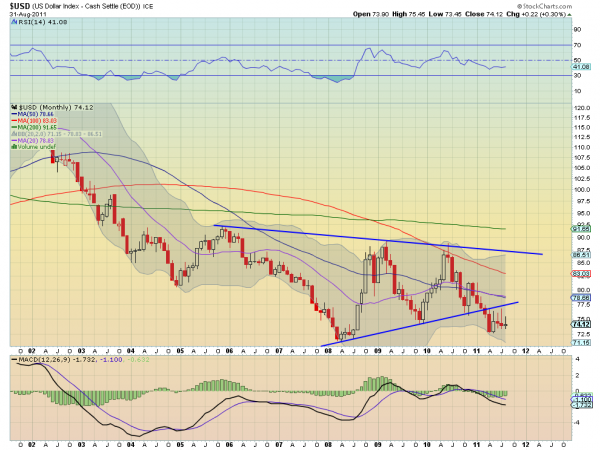
The US Dollar Index continued its series of tight doji’s after breaking the
symmetrical triangle lower in March. The RSI continues to linger near 40 as the
MACD stalls in negative territory. Both give no guidance for the future. The
SMA’s continue to slope lower adding to the understanding that the trend is
still lower. Any upside should be capped at a retest of the triangle near 77.50
and the downside support levels of 73 and 71.50 are the only thing between it
and targets of 52 and then 40 on Measured Moves (MM) out of the triangle and
from the 120 top in 2002.
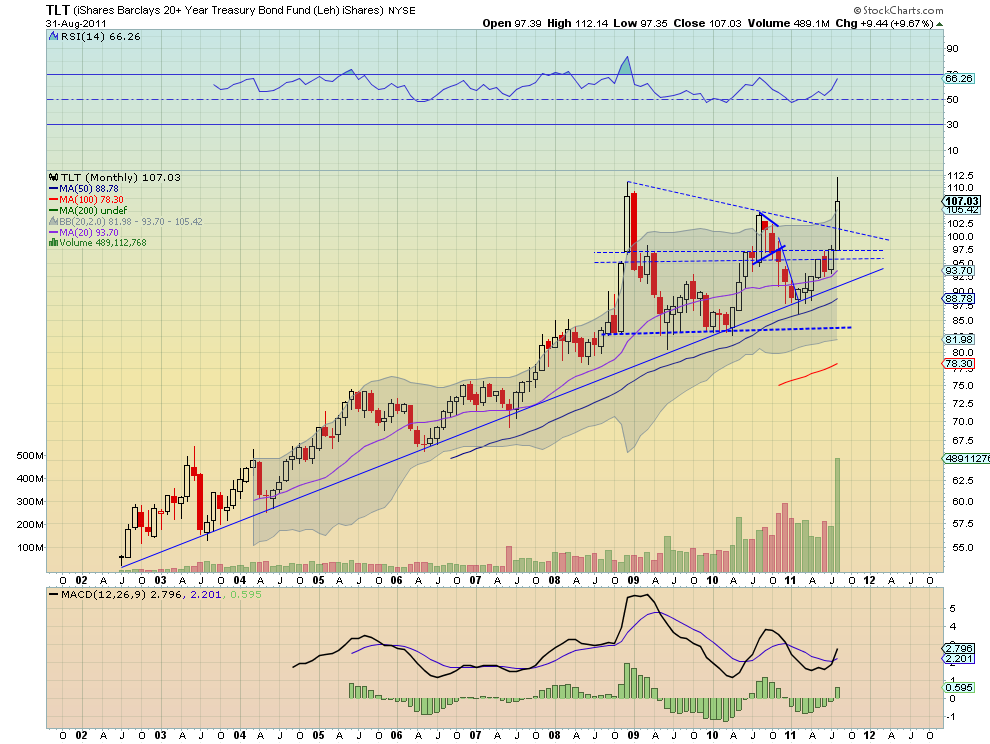
US Treasuries, as measured by the ETF $TLT,
broke above the two year symmetrical triangle on massive volume. It has a RSI
that points higher and a MACD that has just crossed positive both supporting
more upside. It printed a double top near 112 and pulled back slightly just
above the Bollinger band top, so it may consolidate. But longer term this chart
looks bullish. If it can get over 112 it has a MM on the pattern break to 137!
If that double top wins out and it moves lower, suggesting the volume is
indicative of a blow off top, then support lower comes at the previous top in
2010 at 104.80 and the top rail of the triangle at 101.26 before a move back to
the 95.30-97.50 area. Again, the chart favors the upside.
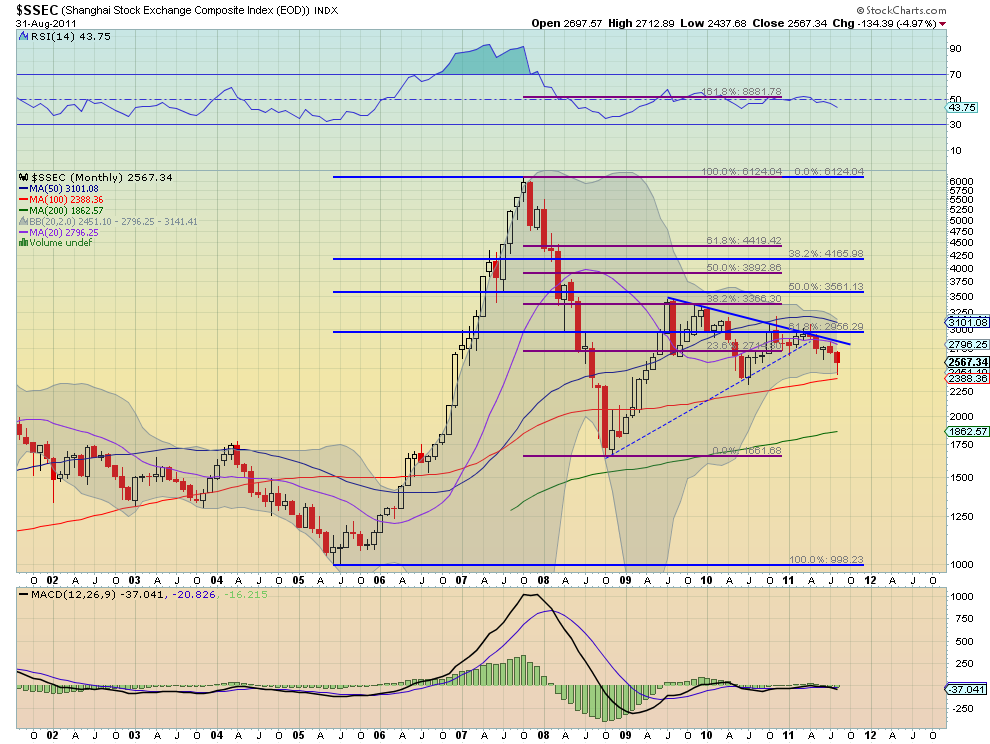
The Shanghai Composite continues to honor the resistance of the falling
trendline. The RSI is now moving lower like the shorter SMA’s, and the MACD
remains flat and not useful. Look for more grind lower from this Index with any
upside moves capped at 2715. Support on the downside comes at 2415 and then
2050.
iShares MSCI Emerging Markets Index, $EEM

Emerging Markets, as measured by the ETF $EEM,
rejected at the 48.20 resistance level and fell hard before recovering and
retaking the 42.20 support level. The candle for the month, suggests more
downside, despite the long shadow, and is backed up by a RSI that is rolling
down hard and a MACD that is about to cross negative. Look for more downside in
the coming months with any move higher capped at 44 and then the 48.20 area.
Support for the anticipated move lower may slow it down at 42.20 followed by
37.40 and 36.
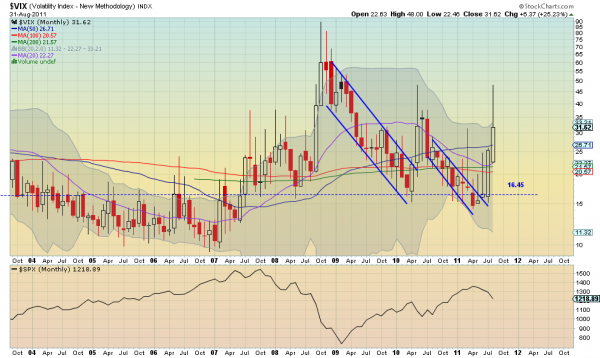
The Volatility Index looks to have printed an interim double top at 48.22
this month with a long upper shadow similar to the other topping candle. With
the Bollinger bands expanding it could be prepping for more upside. If so
resistance should come at 35 and then the previous top at 48 followed by 60. But
it appears more likely that the longer term move will be lower with support at
25.50 followed by 22.30 and 20.50. The charts above give a mixed view on the
future of the $VIX so keep watching.
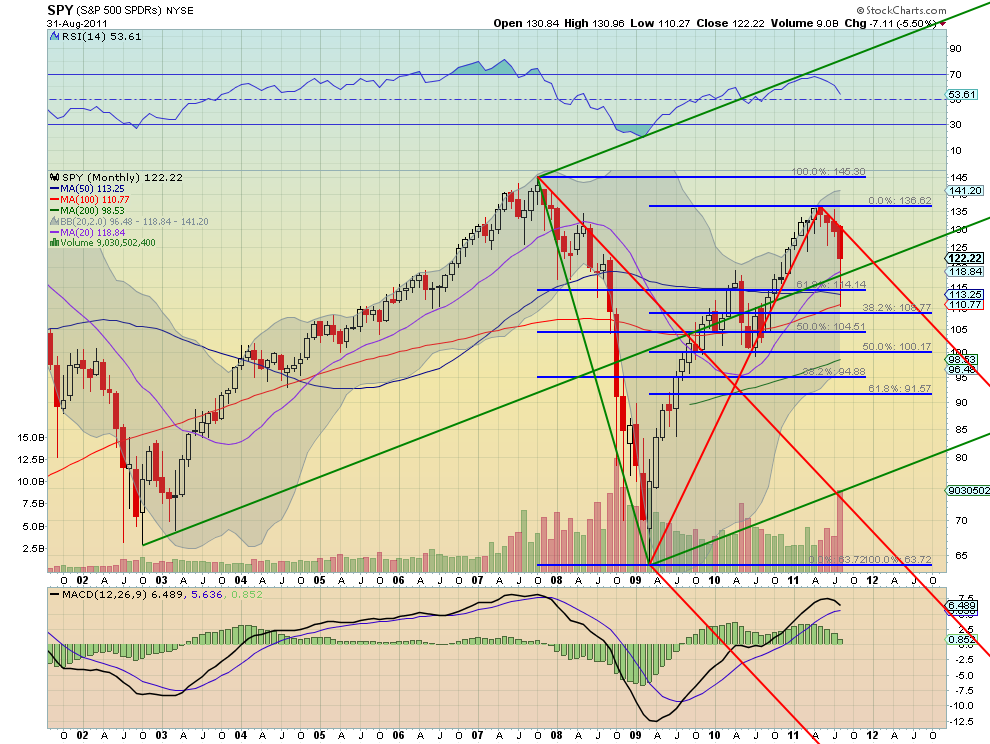
The SPY continued down along the Upper Median Line of the bearish red
Pitchfork during August, printing a long bodied red candle with a long lower
shadow, technically a Hanging Man since the long uptrend. The RSI pointing lower
and the MACD heading towards a bearish cross negative suggest more downside to
come. Any move higher over 123 can expect resistance at the Upper Median Line,
near 131.20 and then 136.62. Support on a continuation downward comes at 118.50
and then next at 116 and 114 before 108.77.
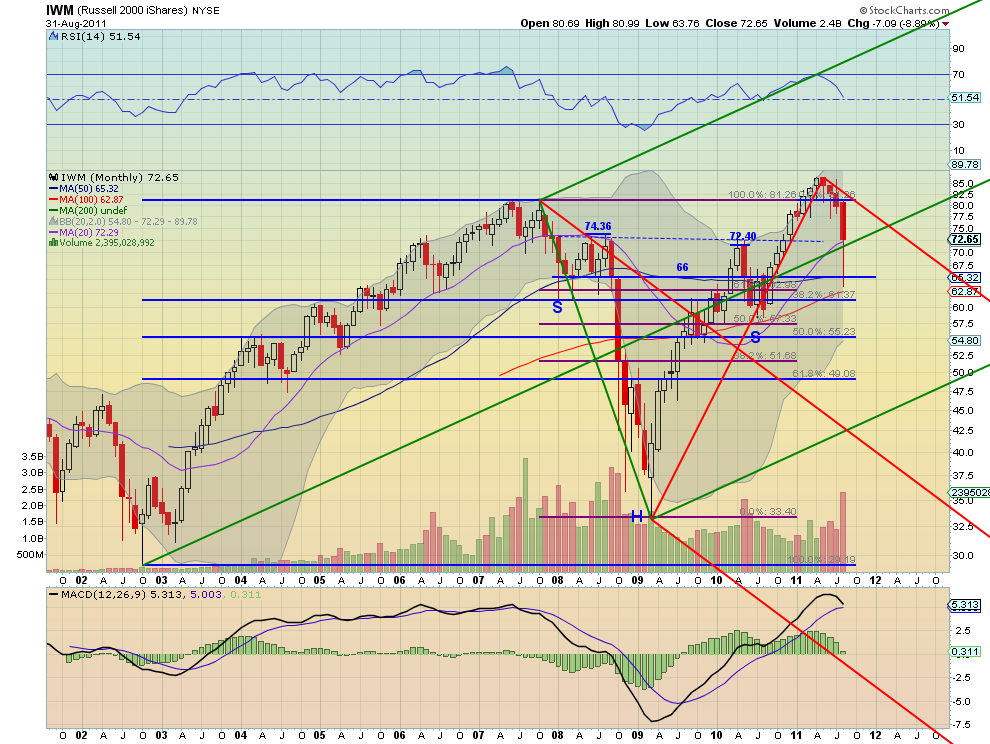
The IWM also continued down along the Upper Median Line of the bearish red
Pitchfork during August, with the same characteristics of the SPY. The RSI
pointing lower and the MACD heading towards a bearish cross negative suggest
more downside to come. Any move higher over 73.60 can expect resistance at the
Upper Median Line, near 81.15. Support on a continuation downward under 72.40
comes at 68 and then next at 66 and 63 before 61.37.
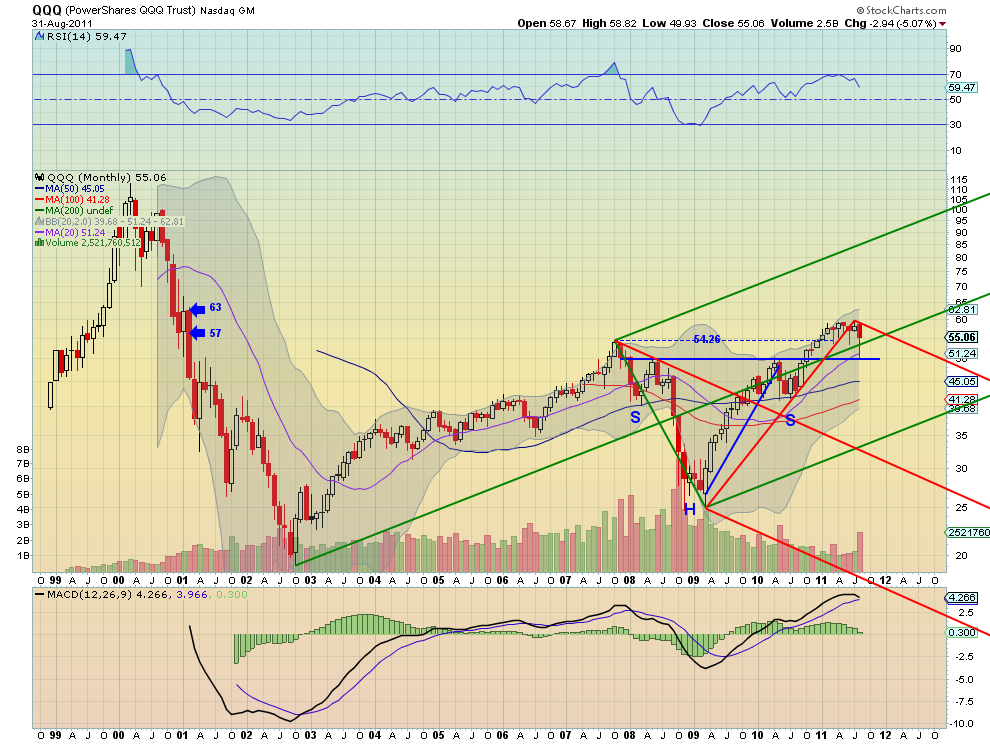
The QQQ continued to consolidate near its highs but with a wider candle
reaching down from the Upper Median Line of the bearish red Pitchfork. Also a
Hanging Man, it is bearish if confirmed lower next month. The RSI pointing lower
and the MACD heading towards a bearish cross negative suggest more downside to
come. Any move higher can expect resistance at 57 and then 60. Support on an
expansion downward under 54.26 comes at 50 and then next at 46.20 and 44 before
strong support at 42.20.
The monthly outlook suggests the upside for Gold and US Treasuries will
continue while the trend lower for Crude Oil and the US Dollar Index will also
continue. The Shanghai Composite and Emerging Markets look to continue to move
lower as well. Volatility can go either way but looks to remain above the lower
range experienced in the last six months with the VIX in a wide range between
the mid 20′s and 48. Despite that uncertainty, the Equity Index ETF’s SPY, IWM
and QQQ are set up to continue lower in the coming months. As noted on the
individual charts there is room for some short term upside without breaking the
downward bias. Use this information to understand the long term trends in
Equities and their influencers as you prepare for the coming months.
