Saturday, July 20, 2013
SPY Trends and Influencers July 20, 2013
by Greg Harmon
Last week’s review of the macro market indicators suggested, heading into the next week, the markets looked strong but maybe a bit extended. We looked for Gold ($GLD) to continue higher in the downtrend while Crude Oil ($USO) slowed at resistance in the uptrend. The US Dollar Index ($UUP) looked to continue lower along with US Treasuries ($TLT) . The Shanghai Composite ($SSEC) and Emerging Markets ($EEM) were biased to the upside in their downtrends and have potential to reverse those trends with continued strong moves. Volatility looked to remain low and drifting lower keeping the bias higher for the equity index ETF’s $SPY, $IWM and $QQQ. All were biased higher with the QQQ looking the strongest the IWM and SPY perhaps extended a little in their uptrends.
The week played out with Gold holding steady while Crude Oil continued the move higher. The US Dollar consolidated the move lower from last week while Treasuries inched higher. The Shanghai Composite consolidated before dropping to end the week while Emerging Markets held their gains from last week. Volatility continued lower back to the May. The Equity Index ETF’s all liked this environment and responded with new highs for the SPY and IWM but with the QQQ giving back ground on some poor earnings reports. What does this mean for the coming week? Lets look at some charts.
As always you can see details of individual charts and more on my StockTwits feed and on chartly.)
SPY Daily, $SPY 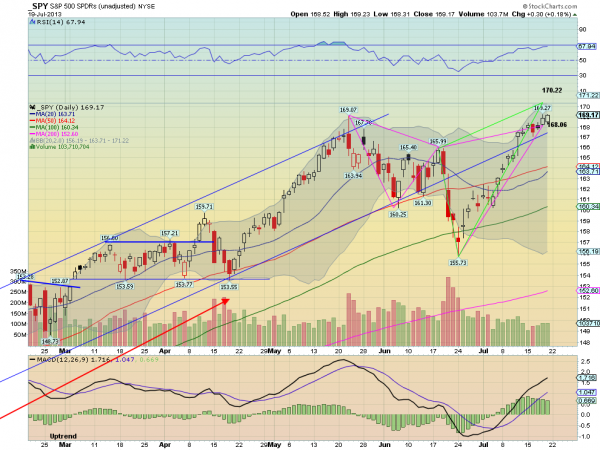
SPY Weekly, $SPY 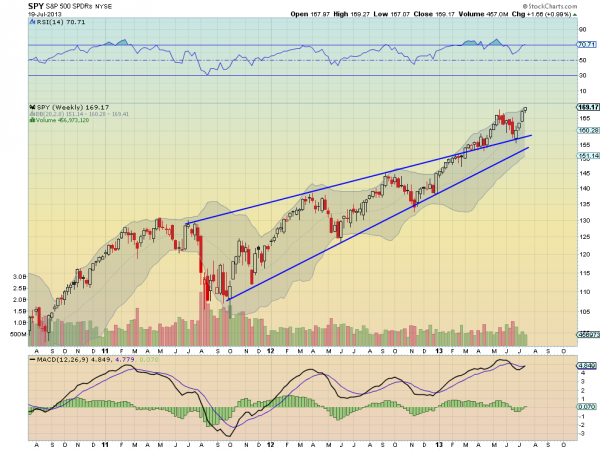
The SPY continued higher, navigating between the first and second Potential Reversal Zones (PRZ) of the bearish Shark Harmonic. The first has engages with a move over 168.06 and a reversal lower now would look for an Initial Price Objective (IPO) of 164.07 were it to start lower Monday. The higher Shark does not engage until a move over 170.22. The Relative Strength Index (RSI) on the daily chart shows a steady rise in bullish territory with room above, and the Moving Average Convergence Divergence indicator (MACD) is rising on the signal line, but the histogram is starting to pullback. Another sign of a potential reversal. The Measured Move higher comparable to the one from 153.55 would take it to 171.25, also nearby. On the weekly picture the move to new highs looks strong. The last major move was over 30 SPY points and if it happens again it is at 200. The RSI is rising and on the verge of a move into technically overbought territory with a MACD that is turning back higher to cross. Both are elevated. There is no resistance higher, but a Measured Move higher to 175. Support below is found at 168 and 166 followed by 163 and 161.60. Continued Upward Price Movement with Caution.
Closing the books on the July options cycle and moving in to August the markets are making new highs but looking a bit overdone. Look for Gold to continue the bounce in its downtrend while Crude Oil continues higher. The US Dollar Index looks lower or may consolidate while US Treasuries are bouncing in their downtrend. The Shanghai Composite looks weak again and headed lower as Emerging Markets are biased to the downside in their bounce in the downtrend. Volatility looks to remain low and biased lower keeping the bias higher for the equity index ETF’s SPY, IWM and QQQ, despite the moves higher last week. Their charts are also biased to the upside in the mid term with the QQQ looking lower in the short term while the SPY and IWM could stand to consolidate their moves. Use this information as you prepare for the coming week and trad’em well.
Just Four Charts
by Tyler Durden
Mortgage rates surging, check! Oil prices surging, check! Consumer Confidence surging, check? Equities surging, check? A funny thing happens when consumers face higher energy prices and mortgage rates - but, it seems, that this time is different (for now)...
A spike in mortgages has always led to drop in confidence...

A breakout in oil prices has always led to drop in confidence...

A breakout in oil has always led to turn in stocks...

A turning point in confidence has always signaled a turn in stocks...

Once the Consumer confidence turns, the Equity market is unable to sustain new highs. So we will have to wait for the next releases of consumer confidence. If indeed the measure turns lower (after 4 years and 4 months of gains like the last 2 cycles) then we would be careful with the sustainability of an elevated S&P 500.
Factors that are likely to impact Consumer confidence include mortgage rates and the Oil price as these have a significant impact on disposable income
- Mortgage rates have already risen substantially
- While only a short term break has been seen on Oil, we are concerned about the medium term setups. A break through $115 on Nymex and $128.40 would be bullish and could send the Oil price back towards the 2008 highs
This will effectively be a “tax” on growth
Is This A 2007 Redux?
by Lance Roberts
I read a very interesting prediction from noted market bull Jeff Saut who, in an interview with Eric King of King World News, stated that:
"For the past two and a half months I have targeted tomorrow, July 19th, as the intermediate-top on both my quantitative timing and technical models. So I think tomorrow is the potential turning point for the first meaningful decline of the year. I have been raising cash for the past few weeks and I think this correction in the stock market will be roughly 10% to 12%.
It's just a question of, is this thing going to end with a whimper, or is it going to end with a bang? The shorts have been absolutely destroyed here. We could see a blue-heat move that carries the S&P 500 somewhere between 1,700 and 1,730. That would be the ideal pattern, but they don't operate the market for my benefit so you have to take what they give you.
I don't think anybody can time the market on a consistent basis, but if you listen to the message of the stock market you sure as heck can decide when you should be 'playing hard' and when you should not be playing as hard, and so I'm not playing that hard right here."
Whether, or not, Jeff is right about the exact date of the market top it does bring attention to the recent correction and subsequent rally to new highs. Was that correction just a pullback in an ongoing upward bullish trend or is the beginning of a more major topping process much as we saw in 2007? The chart below shows the price action of the market from 2003-2008 as compared to 2009 top.

The interesting thing about the historical price action is the potential timing of the Federal Reserve's "tapering" of the current bond buying scheme. The market advance prior to 2008 which was driven by excess liquidity derived from the credit boom cycle - the current advance has been driven almost entirely by the liquidity pushed into the system by the Federal Reserve. The extraction of that liquidity could well mark the top of the current cyclical bull advance later this year or in early 2014.
It is not just price patterns that have me concerned but rather other similarities between these two advances that should be noted as well.
Leverage
The next chart below is the amount of leverage in the financial system as measured by the level of margin debt. Margin debt has currently risen to an all-time high during the current liquidity cycle much the same as was witnessed prior to the financial crisis.

As you can see spikes in margin debt, as market exuberance begins to form, generally takes place near market peaks. The current spike in margin debt to record levels is not necessarily a sign of good things to come.
Valuations
Market valuations have been expanding over the last couple of quarters as prices have been artificially inflated while earnings growth has deteriorated. The result has been a push of market valuations, as measured by P/E ratios, to levels in excess of those witnessed at the prior market peak. The chart below shows reported trailing twelve month price-earnings ratios for the seven quarters leading up to the peak in earnings.

While valuation measures are historically horrible market timing devices, especially when the market is being pushed by liquidity, they do give some insight as to extremes. I should not have to remind you that post the peak in reported earnings in 2007 they fell sharply to a low of just $6.86 per share by March of 2009. Of course, at the peak in 2007, the economy was growing, there was no threat of recession, housing related issues were "contained" and Bernanke calmly explained that we were in a "goldilocks economy." Just six months later the economy was in a recession and the financial crisis had set upon us. While I am not saying that the same thing is about to happen - what does concern me is the extreme amount of confidence that currently exists that we have once again entered into that same "goldilocks" state.
Earnings
Of course, you cannot really discuss P/E ratios without discussing the trend and trajectory of earnings. Reported earnings were steadily rising as we entered into the peak of valuations in 2007. At that time the belief was that market prices would continue to rise along with earnings. The problem was that belief was quickly shattered as the initial waves of the recession began to set in. Currently, that same belief is once again largely prevalent. The chart below shows the historical trend of reported trailing twelve months earnings per share versus the stock market.

Despite the fact that earnings have been stagnating for several quarters now; the belief is that at just any moment the economy will kick into gear and earnings will play catchup with rapidly rising valuations. This has historically been a losing proposition. Valuation excesses tend to be mean reverting through a fall in the numerator rather than a rise in the denominator.
Economic Growth
Looking at earnings, valuations and price are all important to whether or not we are currently near a peak in the financial markets. However, ultimately, it is the economy that will drive all of these issues in the future. The chart below shows annualized growth rates of quarterly real GDP for the periods of 2004 through 2007 and 2009 to present.

The importance here is that in both cases the actual rate of economic growth peaked near the middle of the economic cycle and then began to wane. The polynomial trend lines shows this a little more clearly. Of course, as stated above, despite clear evidence that the economy was beginning to struggle the inherent belief by most mainstream analysts and economists was that the "soft patch" would quickly recover. Unfortunately, that was not the case. The impact of the recession in the Eurozone, and the slowdown in China, is clearly impacting corporate earnings and revenue which puts the current market at risk.
Is This A Market Top?
Mr. Saut's very bold prediction that we are likely making a market top currently is certainly attention grabbing. The reality, however, is that the current "liquidity driven exuberance" could keep the markets "irrational" longer than logic, technicals or fundamentals would dictate.
Are we likely forming a market top? It is very possible. We saw the same type of market action towards the last two market peaks. However, it will only be known for sure in hindsight. The many similarities between the last cyclical bull market cycle and what we are currently experiencing should be at least raising some warning flags for investors. The levels of speculation, leverage, price extensions, duration of the rally, earnings trends and valuations are all at levels that have historically led to not so pleasant outcomes.
John Hussman summed it up well recently when he stated:
"Given the present evidence, however, my real concern is that much like the rolling tops of 2000 and 2007, each pleasant breeze here lulls investors into complacency – but in the face of overvalued, overbought, over bullish conditions that, from a cyclical and secular standpoint, should probably have them wide-eyed with terror. We can't rule out that the bough will sway for a while longer despite the weight, but we won't embrace the situation by putting our own baby on the twigs. It's quite crowded up there already."
Central Banksters Make the Best Economic Terrorists
By: Richard_Mills
From the minutes of theFederal Reserve meeting April 30th - May 1st 2013.
"Many participants indicated that continued (job market) progress, more confidence in the outlook, or diminished downside risks would be required before slowing the pace of purchases."
On May 22nd Federal Reserve Chairman Ben Bernanke told Congress that a decision could be made, at any of the next few Fed meetings, to scale back the $85 billion in bonds the Fed is buying each month if the economy looked set to maintain momentum. The S&P 500 closed 0.8% lower, the dollar hit a three year high and the bond market sold off with yields on the 10 year Treasury notes jumping above 2%.
Speaking at a Boston economic conference Bernanke backtracked saying the Fed would continue to pour stimulus into the US economy, so long as inflation stays low, below 2.5% and until unemployment improves to below 6.5%.
Bernanke made it very clear that those thresholds were merely for considering a rate hike from the Fed’s current .25%, they weren’t necessarily a trigger for tightening…
 “Given that the unemployment rate understates the weakness of the labour market and given where inflation is, I would suspect that it may be well after we hit 6.5% before rates reach any significant level.”
In Bernanke’s July 17th testimony to Congress he said the economy is weak, inflation is low and that if the Fed reduces its accommodation the economy would tank. This was a complete contradiction of remarks made only a few minutes before, when he said stock markets were strong because they reflected the strength of the underlying economy.
“I was gratified to be able to answer promptly, and I did. I said I didn't know. ” Mark Twain
The economy, unemployment and inflation
U.S. retail sales rose by just 0.4% in June (the majority of the rise was in higher gasoline prices). Sales were down in several key segments – down 2.2% at home-improvement stores, by 1.2% at bars and restaurants and by 1% at department stores.
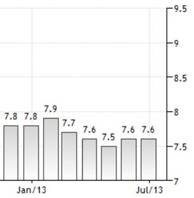
We all need to understand that to have a real, and sustainable recovery for an economy that relies on consumer spending for 70 percent of its activity we need to have a jobs recovery. At 7.6% unemployment the number of jobs being created each month is barely at the level needed for new entrants into the workforce let alone replacing the jobs lost since the Great Recession in 2008 and manufacturing continues to bleed jobs.
Okun’s Law holds that an economy, it’s GDP, must grow above its potential to reduce the unemployment rate. Year-on-year economic growth of two percent above the trend (considered to be 2–3 percent) is needed to lower unemployment by one point.
A third downgrade of U.S. economic growth for the first quarter 2013 showed the country’s GDP grew at just a 1.8 percent annualized pace.
Bloomberg and IHS Global Insight estimate the U.S. economy will grow by 1.6 percent this year. Barclays just cut its second quarter GDP forecast to 1.0% from 1.6% and J.P. Morgan Chase cut its second quarter forecast to 1% from 2%.
From marketwatch.com comes the following; “Following the releases Monday (July 15th) of tepid reports on retail sales and inventory accumulation, forecasters marked down their GDP expectations from 1.4% to 1.1%. It’s probable that U.S. GDP rose less than 2% for the third quarter in a row, and it’s possible that growth was less than 1% for the second quarter in the last three.”
Bureau of Labor Statistics, Alternative measures of labor underutilization
U-4: Total unemployed plus discouraged workers – up from 8.0 percent to 8.2 percent.
U-5: Total unemployed, plus discouraged workers, plus all other persons marginally attached to the labor force – up from 8.8 percent to 9.1 percent.
U-6: Total unemployed, plus all persons marginally attached to the labor force, plus total employed part time for economic reasons - up from 13.8 percent to 14.3 percent.
Long term unemployment - those unemployed over 26 weeks - in the U.S. stands at 4.357 million workers (up from 4.353 in April). Long term unemployed workers remain one of the key problems for the U.S.
The U.S. economy lost 240,000 full-time workers in June while gaining 360,000 part-time workers.
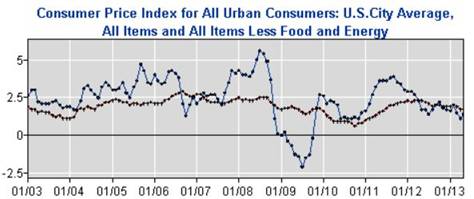
The Federal Reserve uses the Bureau of Labor Statistics (BLS) Consumer Price Index (CPI) as there guide. As you can see, this inflation indicator inflation is well within the Fed’s guidelines.
Please don’t release the (tapering) Kraken
If the Federal Reserve hadn’t backtracked on Bernanke’s May 22nd suggestion that the Fed expects to start scaling back its massive bond buying program the fallout would have been economic terror.
Inflation and jobs weren’t THE real reason Bernanke backtracked. His talk of tapering literally started a global bond market rout. The Federal Reserve has over $3.5 trillion worth of securities on its balance sheet - of which $1.9 trillion are U.S. Treasuries. If the Fed had started down the path of interest rate normalization by slowing its purchases and eventually unwinding its balance sheet interest rates would climb back to at least the 4% they were before the Great Recession in 2008 and maybe as high as the 40 year average of 7%.
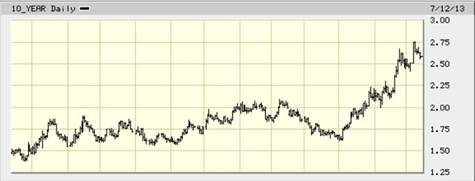
10 year treasury yields
This from Charles Hugh Smith over at oftwominds.com…
“The wheels fall off the entire financialized debtocracy wagon once yields rise. There's nothing mysterious about this:
1. As interest rates/yields rise, all the existing bonds paying next to nothing plummet in market value
2. As mortgage rates rise, there's nobody left who can afford Housing Bubble 2.0 prices, so home prices fall off a cliff
3. Once you can get 5+% yield on cash again, few people are willing to risk capital in the equities markets in the hopes that they can earn more than 5% yield before the next crash wipes out 40% of their equity
4. As asset classes decline, lenders are wary of loaning money against these assets; if the collateral for the loan (real estate, bonds, stocks, etc.) are in a waterfall decline, no sane lender will risk capital on a bet that the collateral will be sufficient to cover losses should the borrower default.
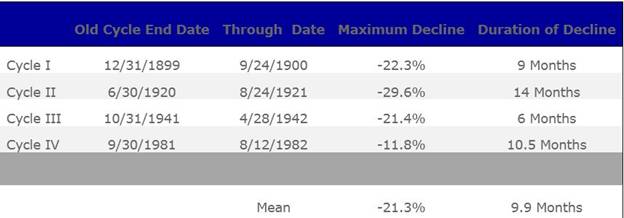
The consequences of interest rate normalization for stocks will prove very painful. According to the hmcapitalmanagement.coms chart below the average correction is 20% and happens in an incredibly short span of time – 10 months. Devastating to the top few percent of Americans who own 80% of the wealth in the stock market.
Global currency printing
Japan, the world’s third largest economy, is currently an economic ray of sunshine - the Japanese economy grew at an annualized 4.1 percent in the first quarter and their stock market is soaring. Abenomics goal is to end a long miserable decade and a half of deflation by kick starting the economy, this will happen because of massive yen creation. The fiat balloon will induce consumers to spend and corporations to reinvest profits, convinced by a rising stock market and surging exports that all is well.
The flood of fiat has depreciated the yen, over the first six months of 2013 the yen weakened the most against the U.S. dollar since 1982. The yen also dropped 12 percent against the euro and seven percent against the sterling, threatening European trade.
The weaker yen is also drawing investment away from emerging markets and toward Japanese equities - the Nikkei 225 has been soaring.
China will, in response to Japans deliberate and massive yen depreciation, force its currency the yuan to depreciate. Other Asian countries (and the EU and UK) will have to do the same to keep their exports competitive with China’s and Japan’s.
Real Interest Rates
We know U.S. employment has not recovered and that the inflation rate is well within the Fed’s targeted range. We can also see a fragile U.S. and global economy does not need, and cannot handle, an interest rate shock.
From Frank Holmes at usfunds.com comes the following:
“Higher yields may not be sustained in the short-term, as current economic data is not very inspiring…With real growth in the U.S. and global economy failing to materialize to date, the Fed may not want to risk taking away the stimulus until economic growth is more certain.”
The demand for gold moves inversely to interest rates - the higher the rate of interest the lower the demand for gold, the lower the rate of interest the higher the demand for gold.
The reason for this is simple, when real interest rates are low, cash and bonds fall out of favor because the real return is lower than inflation - if your earning 1.6 percent on your money but inflation is running 2.7 percent the real rate you are earning is negative 1.1 percent - an investor is actually losing purchasing power.
Dumping 400 tons of gold on the market, as recently happened, cannot dampen the demand for gold at low/negative real interest rates. As long as interest rates are low to negative the demand for gold will grow and soon strips supply from the world’s vaults.
Consider:
During the first half of this year, compared to the first six months in 2012, sales of American Eagle gold bullion coins almost doubled and that the mid-year total ranks fifth highest in the Gold Eagle’s 26 year history.
Through the first half of 2013 American Eagle Silver Bullion Coin Sales hit 25,043,500. The annual sales record for the silver coins happened in 2011 at 39,868,500.
John Paulson understands that gold is the most proven investment to offer a return greater than inflation (by its rising price) or at least not a loss of purchasing power. “I would say that the rationale for owning gold has not gone away. The consequence of printing money over time will be inflation, it's just difficult to predict when." Legendary hedge fund manager John Paulson, Delivering Alpha conference, CNBC
The benchmark US 10-year note currently yields 2.50 percent, yields on 30 year bonds are 3.59 percent.
The inflation rate for the first six months of 2013 - from the Consumer Price Index (CPI-U) which is compiled by the Bureau of Labor Statistics (BLS) is 1.8 percent unadjusted.
“Have you ever wondered why the CPI, GDP and employment numbers run counter to your personal and business experiences? The problem lies in biased and often-manipulated government reporting.” John Williams
Williams shadowstats.com uses pre-1990 methodology for computing the CPI-U…
Conclusion
“At this point, the Fed has been accommodating Credit and market Bubbles for so long that the only way to ensure ongoing loose financial conditions is to perpetuate Bubble excess. I would argue – and I believe recent market behavior supports this view – that various Bubbles have inflated to the point of acute vulnerability. This implies fragility to waning liquidity and episodes of risk aversion, hence – and as the speculator community assumes - unrelenting Fed QE activism.” Doug Noland, Bernanke's Comment, prudentbear.com
The Fed, and all the other central banks, are damned if they do and damned if they don’t. Quit easing and we have soaring interest rates, a bond bloodbath and all that entails. Keep easing and well, let’s just say that the piper always has to be paid, and he will be eventually - taking out another loan to cover your existing debt payments only postpones the day of reckoning.
Seems to me that buying some gold and silver bullion, and an investment into carefully chosen, extraordinary resource juniors (here’s one of my favorites), are the best insurance against the coming days of economic reckoning. Are the coming days of financial terror, and how to deal with the consequences, on your radar screen?
If consequences and solutions aren’t on your screen they should be - central banksters make the best terrorists.
If not, maybe one should be.
Focus On Risk, Profits Will Follow
by Tom Aspray
Stocks continued higher last week as sector rotation has kept the major averages moving higher. The regional banks led in the early stages of the rally but peaked on July 8 before correcting for six-seven days. They turned higher late last week and may be ready to lead the market higher again
The S&P 500’s relentless 7% rally from the late June lows has caused some investors and analysts to chase prices higher. In last Monday’s daily column, I wondered Should You Be Buying Now? I looked at where a reasonable stop could be placed, and while the SPY through last Thursday had gained another 0.7% for the week, in my opinion it still does not justify a 7.8% risk.
I believe that paying attention to the risk of any investment before you make is the most important variable in your investing or trading success. This is true no matter whether you are using technical or fundamental analysis to make your decisions.
- For additional reading, see – 5 Rules for Success in 2013
It is important to be able to separate stock market risk and the risk of any one position. In the June 28th column, I noted that “the number of NYSE stocks above their 50-day MAs dropped below 28 last week and has now risen to 40.” At 40, it was still well below the mean of 62, so was oversold. The current reading is just over 71 and close to the May high at 77. It clearly is no longer oversold.

Click to Enlarge
The perpetuation of some common investing concepts can also sometimes lead investors astray. Identifying bear markets by a 20% decline can often have them selling when they should be buying. A recent example may be the four-week, 20% decline in the Nikkei 225 that ended on June 14.
The sentiment in June was quite negative, but Nikkei 225 is now up over 19% from those lows, which were at levels where the technical evidence indicated good support. The table above highlights several other examples when relatively brief declines in the Nikkei 225 were followed by powerful, longer-lasting rallies.
In 2011, the Spyder Trust (SPY) declined 20% from May through October 2011, which turned the sentiment very bearish. Since the A/D line turned positive in October 2011 lows, the SPY has gained 54%.

Click to Enlarge
A look at the global stock markets confirms that the Japanese market has clearly been the leader. The Nikkei 225 is up well over 37% so far this year, which is double the 18% gain by the Spyder Trust (SPY). The German Dax is up just 6.8%, so far in 2013, but when measured from the June 2012 lows is still leading the SPY by 8%. It is no surprise that the emerging markets, as represented by the Vanguard FTSE Emerging Markets ETF (VWO), is the weakest as it is down over 11%.
On a day-to-day basis, the earnings reports are determining the intra-day swings. Last Thursday was a good example as weak earnings from Google, Inc. (GOOG) and Microsoft Corp. (MSFT) dropped their stocks over 5% in after-hours trading. In Friday’s trading, MSFT was down over 11%
In contrast, Chipotle Mexican Grill (CMG) and UnitedHealth Care Group (UNH) were both up 6% after hours in reaction to better-than-expected results. The consensus is for a mediocre earnings season with most investors betting on and investing based on strong results later in the year.
The data on the economy was a bit weaker than analysts expected as retail sales disappointed, gaining 0.4% when most were expecting a 0.8% gain. The chart of retail sales shows that it is in a strong uptrend, line a. One should also note that they bottomed out well after the recession was technically over.

Click to Enlarge
The data on the housing sector was mixed with the housing market Index hitting its highest level since early 2006 while the Housing Starts dropped 9.9%. The homebuilding stocks topped in early May, and there are signs that their correction is close to being over.
On Monday we get the latest data on Existing Home Sales with New Home Sales on Wednesday. Also out on Wednesday is the flash report on the Purchasing Managers Index. In addition to the jobless claims, Thursday, we also get the Durable Goods, followed on Friday by Consumer Sentiment.
What to Watch
Despite the further new all-time highs in the major averages last week, those who bought last Monday’s opening still have an uncomfortable level of risk in my opinion. The risk analysis strongly suggests that you will have a better opportunity to buy one of the market-tracking ETFs later this summer.
This does not mean one should avoid the market altogether as there are quite a few stocks that either topped out early in the rally or are still in the process of bottoming. This includes the homebuilders, which have drifted lower after their strong surge on July 11.
I liked the action in some of the energy stocks last week and new positions were established. They still need a strong up day to complete the bottoming process. I am also watching the tech sector despite the disappointing earnings from some of the tech giants last week.
Once we do get a pullback in the overall market, we may get further clues as to which sectors are poised to lead the market higher as we head into year end. The improvement in the energy sector (see below) could be sending an early signal. A correction would also help to dampen the recent bullishness especially if we get one or two sharp down days.
Not much change last week in the individual investor sentiment as the number of bulls in the AAII survey declined slightly to 47.7% from 48.9% the previous week. The financial newsletter writers did become more bullish as the number of bulls jumped to 52.1%, up from 46.9% the prior week and 41.7% three weeks ago. The number of bears has dropped back below 20% with the latest reading at 19.8%.

Click to Enlarge
This week, I would like to take a look at both the weekly and daily analysis of the NYSE Composite and its A/D line. On the weekly chart (on the left), it is evident that the starc- band was tested at the June lows before prices reversed to the upside.
The May high at 9695 is the next upside target with the starc+ band at 9797. The first real support is in the 9400 area with the rising 20-week EMA at 9201. The quarterly pivot is at 9251.
The weekly NYSE Advance/Decline line did confirm the new highs in May (see arrow), which is bullish for the intermediate-term trend. It has traded in a narrow range over the past two weeks and is just barely above its WMA. It is well above the late 2012 highs and the uptrend, line c.
The daily chart of the NYSE Composite shows that it came close to its daily starc+ band over a week ago. The daily starc+ band is now at 9688. There is minor support now at 9443-9462 with the 20 day EMA at 9367.
The McClellan oscillator formed multiple positive divergences at the recent lows, line f, that was confirmed by the move through the zero line. The oscillator now shows a slight negative divergence, line e, which makes the market vulnerable to a correction. The daily downtrend in the A/D line was broken in late June when its WMA was also overcome.
S&P 500
After the strong surge on July 11, the Spyder Trust (SPY) has continued to grind higher but the ranges have clearly narrowed. The weekly chart shows that the long-term trend line resistance that goes back to the 2012 highs, line a, is again being tested. This week the starc+ band is at $171.74.
There is first good support in the $166 area, which corresponds to the mid-June highs. There is additional support at $163 with the quarterly pivot at $161.01. The rising 20-week EMA is at $160.50.
The weekly on-balance volume (OBV) is just testing the recent highs and is still locked in its trading range (dashed lines). The OBV is above its flat WMA. The daily OBV (not shown) is above its highs but has not confirmed the new highs.

Click to Enlarge
The daily S&P 500 A/D line (not shown) has moved well above the May highs and confirmed the price action. It is well above its rising WMA.
Dow Industrials
The SPDR Diamond Trust (DIA) has moved higher for the past four weeks with the weekly starc+ band at $157.89. DIA looks ready to form a doji this week. This makes the low at $153.93 the level to watch on this week’s close.
The weekly relative performance is still in a broad trading range, lines e and f, that goes back to late last year. The RS line needs to move through the resistance at line e, to signal it is leading the S&P 500 higher.
The weekly OBV for DIA has made new highs confirming the price highs. The OBV has good support its WMA and the uptrend, line g. The daily OBV (not shown) is also positive so the multiple time frame OBV analysis still points higher.
The daily Dow Industrials A/D line (not shown) has moved well above the May-June trading range, which confirms the price action. There is initial support now at $152-$153 with the 20-day EMA at 4152.59. The quarterly pivot is at $149.25 with the 20-week EMA at $148.44.

Click to Enlarge
Nasdaq-100
The PowerShares QQQ Trust (QQQ) gapped lower last Friday and closed the week near the lows. The negative tech earnings really hit it hard. There is next support at $73.70 and then in the $72-$72.50 area. The quarterly pivot is at $71.03 along with the 20-week EMA and the September highs, line a.
The relative performance turned down this week as it has failed to move through the resistance at line c. A move above this level is needed to signal that the Nasdaq 100 is leading the S&P 500.The weekly OBV has turned lower but is still above its WMA.
The Nasdaq-100 A/D line (not shown) did confirm the recent highs but flattened out with last Friday’s close. There is first resistance for QQQ at $75-$75.54 with the weekly starc+ band at $76.77.
Russell 2000
The iShares Russell 2000 Index (IWM) again led the market higher as it closed near the week’s highs. The weekly starc+ band at $105.61 is not far below Friday’s close with the quarterly R2 resistance at $106.65.
The relative performance staged a major breakout in early July, line f, confirming that the small caps were the market-leading sector. The weekly OBV moved through its resistance at line g, which confirmed the price action. The OBV now has good support at its uptrend.
The Russell 2000 A/D line (not shown) is still acting strong as it has moved well above the May-June highs.
There is initial support now at $101-$102 and then in the $100 area. The rising 20-week EMA is at $96.44 with the quarterly pivot at $95.50.
President Obama Could Give Main Street a Bailout with SPR Release
By EconMatters
QE Fueled Market Mania
It was another crazy day of speculation in the gasoline and oil markets, typical of the QE fueled shenanigans that happen every day for the last month in equities and oil. Speculators ran WTI up to $109 a barrel, and the RBOB contract up as high as $3.16 a gallon on Friday. So expect prices at the pump to continue to rise due to wild, rampant speculation in the futures market.
The Middle Class & Rising Gas Prices
Unfortunately, the wealthy futures traders can afford these higher prices, but the middle class portion of the population really gets hurt by a 50 cent per gallon price increase at the pump. Think in terms of college students working to juggle rising tuition costs, with already tight budgets, and now they have to use credit cards to pay for their increasing gas bills each week because their low paying job doesn`t completely account for $4 a gallon gas fill-ups each week.

The Wal-Mart Economy
Think in terms of the average Wal-Mart shopper who barely makes it through the month on a strict budget, and is as price sensitive as any consumer in the country. This is why they are shopping at Wal-Mart because every single percent savings goes a long way in meeting their basic needs and having some semblance of a high quality of life given their limited resources.
Long-haul Truckers
Think in terms of a long haul trucker, who is independent and even though there are fuel subsidies, ask any trucker, and they will tell you that for the most part these fuel-surcharges are inadequate to mitigate against these types of rise in fuel costs. There are times where fuel prices are too high with these types of increases that certain trucking runs are unprofitable. They simply cannot take certain loads. Even at times they take losses on routes, to keep the business, and hope that prices will drop in the future. But these price increases in fuel categorically negatively affect their profitability, and thus livelihood.

Everybody but “Middle Class” gets a Subsidy
In this country we bail out banks, we give subsidies to the large oil companies, we give subsidies to large corporate farming conglomerates, and we give energy subsidies for alternative energy business development like wind and solar projects. So we seem to subsidize a lot of big business in this country with low effective tax rates, offshore loopholes, and low minimum wage requirements.
There is a reason ZIP Codes Required at Gas Stations
But how are these same minimum wagers supposed to pay for gasoline each month without their own form of bailout? This is part of the problem, and why when you go to pay for gasoline at the pump, the machine asks for modern security features like a ZIP code, because gasoline has become more expensive in this country than many people can afford to pay in low income groups.
Accordingly this resulted in maxing out credit cards, and stealing credit cards to pay for gasoline purchases. You could track the modern era of energy trading directly with increased security features at the pump. Gasoline is just too expensive relative to the middle class`s income when factored on a percentage basis into a monthly budget.
How High until You ‘Feel’ Average American`s pain at the Pump Mr. President
Thus how about a bailout for the working poor, the middle-class, and all the retired people on fixed incomes Mr. President? Why not a bailout for main street Americans? How high do prices at the pump have to go before this issue gets your attention?

Speculators react to Incentives, the Fed Incentivizes Speculation
Without intervention as we have seen in the past the speculators will push any market as far as they can, and when you have one form of governmental market intervention in the Federal Reserve providing all types of cheap liquidity from low interest rates, $85 Billion in stimulus each month the speculators are encouraged and even need places to invest this money. Again another bailout for people who are the least in need of a bailout is the big banks and the Speculators who caused the entire financial crisis in the first place!
Democratic Constituency
So how about helping a large portion of the people who actually voted for your two terms in office? Is it that you have no more elections to run, that you have turned your back on the middle class in this country? Mr. President, Do you care about high gas prices anymore, or have you sold out to the corporate interests?
Obama was going to Protect America from the Evil Speculators
Wasn`t the middle class, and protecting main street's interests from the Greedy, Corrupt, Evil, Too-Big-to-Fail Banks a large part of your political platform when you were elected eight years ago? You have utilized the SPR card twice to curb the speculators, and it worked both times like a charm. Give main street America a break with a bailout for their pocketbooks for a change, and release the Strategic Petroleum Reserves.
What is different now? Election, Election, Election
To quote directly from the last time Obama released the SPRs: “The overriding purpose of our effort is to increase supply to counter any shortfall and meet this typical increase in oil demand over the summer. We are heading into a period in which demand for oil tends to be at its highest,” a senior administration official explained.” How is this summer any different Mr. President? Or now that you do not have any more elections to win, you don`t give a damn about the middle-class, the elderly, and main street America?
Leadership, Leadership, Leadership – O Brother, Where Art Thou?
I guess you’re just the typical limousine liberal who invites Billionaire Tech Titans to have dinner in Washington; the ‘beautiful people’ while the rest of main street America struggles to pay gasoline prices that they cannot afford, when a little presidential leadership on your behalf could improve their situation substantially. I reiterate Mr. President, we bail everybody else out in this country, why not middle-class Americans via an SPR Release to counter high prices at the pump?
Strong Contrarian Buy Signal on Gold Stocks
By: Jordan_Roy_Byrne
Contrarian thinking is easy but successful contrarian investing is difficult. Most amateur contrarians neglect that the crowd is right most of the time. It’s only at market turning points where the crowd is wrong and contrarians are right. In recent weeks the voices against precious metals have not only appeared but grown. Weeks ago we debunked a rant of a widely followed mainstream blogger and commentator. He was ranting against the gold stocks and his rant was devoid of any analysis or actionable information. Meanwhile, more mainstream calls to sell gold stocks have popped up and during what likely will be exactly the most inopportune time to sell.
On Yahoo Finance TV, host Jeff Macke and Mike Santoli, a respectable commentator formerly of Barrons tried to analyze the gold stocks on a segment called “The Trade.” While they make a few good points their ignorance is overwhelming. They mention Newmont Mining as the blue-chip stock of the sector. There is no mention of Franco-Nevada which most would consider the blue-chip of the sector and the company that makes the most sense given their discussion of the difficulties of mining. They are telling people to sell the sector after its already declined over 60% and the cyclical bear is long in the tooth. Clearly these gentlemen have not done the historical analysis like we have (the chart below) which shows that this decline is typical during a secular bull market in gold stocks. On a show called “The Trade” these guys couldn’t come up with what is quite obvious from the chart below.
Moving along, an anti-Gold commentator from MarketWatch tried to debunk the bullish supply argument in “Gold is a popping Bubble”:
Another key argument that gold has hit support is the idea that miners are at breakeven on production costs and will not be willing to extract more metal from the ground — thus limiting supply and boosting prices. However, it’s willfully naïve to think that major miners like Barrick Gold or Newmont Mining will simply shut down and bleed cash. They have payrolls to make, operations that require maintenance and — most importantly — debt to service. Consider that Barrick had $14.7 billion in total debt as of its first-quarter earnings report, which isn’t going to pay for itself. Like it or not, these companies will continue to mine simply to keep the lights on, even if it’s not in their long-term interest – which is one of many reasons that gold miners are a bad investment right now.
This is an epic fail. Mine to keep the lights on? At breakeven? Ever heard of turning the lights off? Companies shut down mines because they can’t make money (or enough money) and they can layoff employees as Barrick is doing. Clearly this author spent no time supporting his bizarre assertion with any facts. When the price goes too low, future supply shrinks. This isn’t rocket science. The key word is future. It doesn’t impact the short-term market trend but does so later on.
The root of the problem here is the majority of the mainstream fails to understand not only Gold but the mining industry and the proper way to invest in mining companies.
The mining industry is unlike most industries. It is a venture type industry where performance is skewed and not uniform across the sector. In secular bull markets you can make money buying the mining sector but it does underperform the metals. This is true now and it was from 1960 to 1980. Yet, everyone acts as if today’s underperformance is some revelation. It’s not. It happened in the last secular bull market and will continue in the coming years. Therefore there is little reason to buy and hold the sector. Rick Rule has said if you buy the sector you’ll get killed.
The huge returns and strong outperformance are a result of picking the right companies and buying at the right time. This requires proper due diligence of the industry as well as due diligence on the companies. The mainstream doesn’t have the time for this. These guys are too busy staring at a computer screen, tweeting, hosting shows, and being interviewed to conduct proper due diligence and historical analysis.
Speaking of historical analysis, many are quick to compare Gold’s decline (36% in nearly two years) to 1980 (40% in two months) without even mentioning 1976 (45% in eighteen months) which is the better comparison. Below is an index of Gold and Silver comprised of half of each. The recent decline bottomed at multi-year trendline support and is closely in-line with the 2008 decline. In 1980 this index declined 54% in two months! After two and a half years it was down 75%.
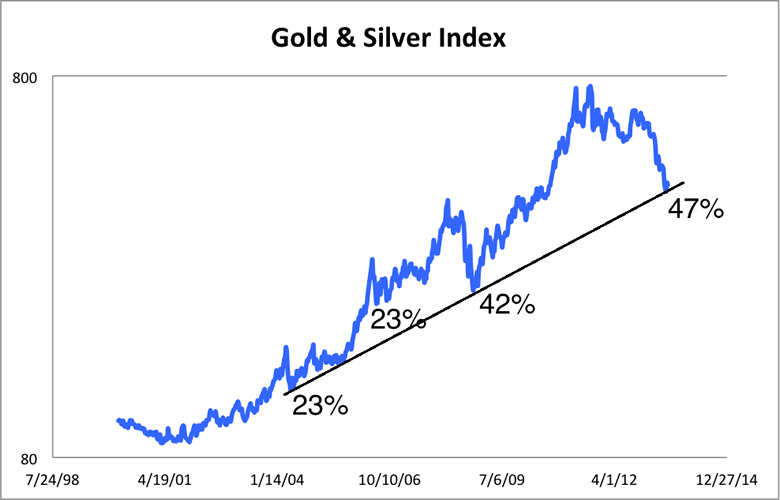
The bottom line here is twofold. First, the growing mainstream negativity toward the gold stocks (after a 65% decline) is a textbook contrarian buy signal. It comes at a time when historical analysis suggests this is the best time to buy and when valuations are at multi-year lows. Second, one should consider the gold stocks a venture capital type of investment. Don’t buy the entire sector but look to buy specific stocks. That is how wealth is attained. While GDX and GDXJ are starting to rebound there are a fair number of stocks which have spent several months bottoming and look ready to lead the the sector in the coming months.
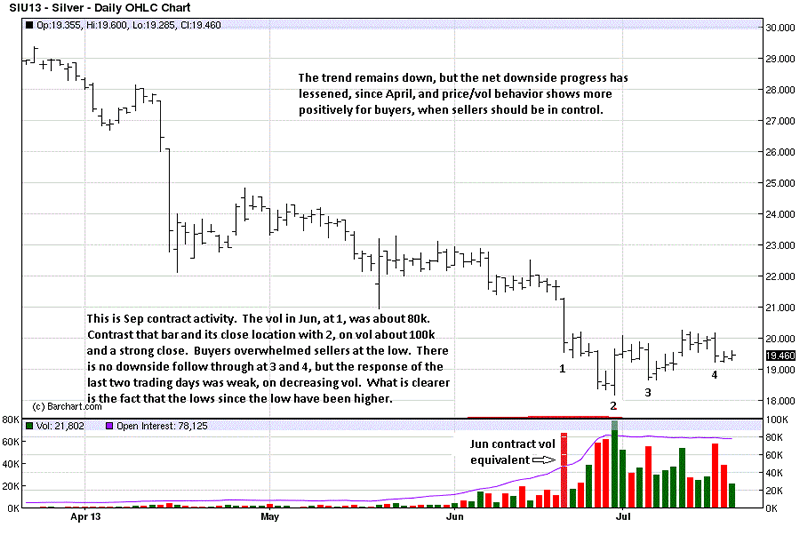
Gold And Silver – When Precious Metals Bottom Is Irrelevant To Your Financial Health
By: Michael_Noonan
As ardent as Precious Metals, [PMs], buyers are, a good many of them do not comprehend their importance. Everyone agrees they are resoundingly better than any fiat currency, as history has amply proven. However, few consider the why PMs are so anathema for all central bankers.
There was a time in this country when gold and silver were the coin of the realm. Actually, they still are! The Coinage Act of 1792 has never been repealed, and that means, by law, gold and silver are, [read section 20], the current money of account of the United States. There is a very potent message within that Act, and like we said last week, Knowledge is not of value, using it is.
Here is what not enough people know, even in the PM community: The qualities within a gold coin are title, rights, and interest. When gold was used to purchase anything, all title, rights, and interest transferred from the gold coin to whatever was purchased. It was paid in full.
By contrast, thanks to the Rothschilds, the genesis for the entire Western world’s financial system, central bankers have replaced ALL title, rights, and interest in whatever you buy with commercial debt instruments, liens. All Federal Reserve Notes are evidences of debt. They are not “dollars,” even though the word is printed on them, and the Federal Reserve has admitted as much. Federal Reserve Notes, [FRNs] are commercial debt instruments, and they are issued by the privately owned corporation, The Federal Reserve.
Debt is not money. It never was and never will be. The lie has been sold to the public, and the public has bought it, in its entirety. As an aside, if you have not yet looked up cognitive dissonance, this would be a good time. What is a FRN? It is not Federal; it is issued by a private corporation. Look up Federal Reserve in any government blue pages in the phone book. It ain’t there. You will find it closer to Federal Express in the white pages.
There are no reserves backing a FRN. It is the same as monopoly money. Each have the same intrinsic value. One is believed [cognitive dissonance, again] to be of value, the other is known as play money. A few know the truth and see the two as equal.
It is not a note. There is no promise to pay anyone anything at anytime. Any questions?
Debt is a lien, so whenever you use FRNs to buy anything, whatever you purchase carries with it a lien. This is why when you purchase a house or a car, the government keeps real title, and all you get is an equitable title, usage, like a rental because you pay annual rent back to the government. Whenever you sell your house or car, the lien transfers with it.
No matter what you “buy,” a house, a car, furniture, equipment, etc, the lien of 100% goes along with it, because you used a FRN, and all title, rights, and interest fully belongs to the creditor, the Federal Reserve. Also, for the privilege of using a FRN debt instrument, you get to pay a tax on them. [Enter IRS]
With gold and silver, you paid in full for whatever you bought, and you received all rights, title, and interest. The government has no claim against you. You do not need the government because you are dealing with coin of the realm that gives you absolute right, title, and interest. Can you better understand why Socialist Franklin Delano Roosevelt ran the scam he did for the New World Order to have all “persons” turn in their gold, an order issued by Executive Order. Few knew that Executive Orders only applied to those within the employ of the federal government! Of course, the federal government did nothing to dissuade those who falsely believed otherwise, and still do.
Why are gold and silver so important to your financial health, and why are they so fiercely opposed by governments? Three words: Rights, Title, Interest. By stripping people of their most accessible form of wealth, they became dependent upon the government. How many people are dependent upon Social Security, [another scam], Medicare, and now the largest growing segment, Food Stamps?
If you have wealth, and gold and silver are forms of wealth, [no matter how anyone would say otherwise], you do not need fiat; you do not need the government. However, the government needs you! By taking away your wealth and leaving you only with debt, you are caught up in their web.
The above explanation has been the primary reason why the New World Order has taken over each Western country’s currency, replacing all gold and silver backed lawful currency with [worthless] paper fiat. As Chuck Colson, then Special Counsel to Nixon back in the 1970s, was quoted as saying, “When you’ve got them by the [financial] balls, their hearts and minds will follow.” Guess where the New World Order has you?
Think about this when you next use your credit card, or fiat FRNs. Prior to the 1930s, Americans used coin of the realm, and United States Notes, [actually issued by the US] that were backed by gold and silver, with a promise to pay metal specie if one wanted to have their lawful money so redeemed. Now, thanks to fiat, the United States has slipped into Third World status, just not yet recognized by the masses. It is going to continue to get worse.
The above issue has now been compounded by the growing concern that central bankers have little to no gold left, even though they have been leasing, releasing, and scamming everyone with their previously unquestioned practices. There are numerous “stories” relating this latest ongoing scam, so we need not dwell any further on it.
There are two situations going on. Some express it as “the price of gold, or the gold price.” We do not know what that means? What is the price of gold, if not the gold price? Having some clever form of expression will never resolve the problem.
One more time. Buying and holding physical gold and silver gives you rights, title, and all interest, aka full ownership. Acquiring them during theses tumultuous times is your best form of wealth protection moving into an increasingly uncertain future. If you want to attach physical ownership to the paper prices that are fully controlled by central bankers, you can, but it misses the point for your future financial well-being.
If you choose to play the lien game and deal in fiat, with a lien attached to everything you have, that, too, is a choice with a guaranteed certainty of uncertainty for the future. There is one thing on which almost all can agree, the central bankers are not about to give up their uber-wealthy fiat scam, and if they cannot meet their obligations to make delivery on physical PMs, they will [forcefully] buy people off and keep their game alive.
How long can they keep their game going? Longer than most expect. For that view of artificial reality, we turn to the charts.
There is no evidence of a change in trend. That means gold can still go lower, possibly move sideways, and have occasional rallies, a natural feature of all bear markets. Know that it takes time to turn a trend around. If you keep a focus on what the intrinsic value of gold and silver offer, [rights, title, interest], you may feel less pressure to have price turn around to the upside and more secure in your holdings. At current low prices, opportunity is so ripe.
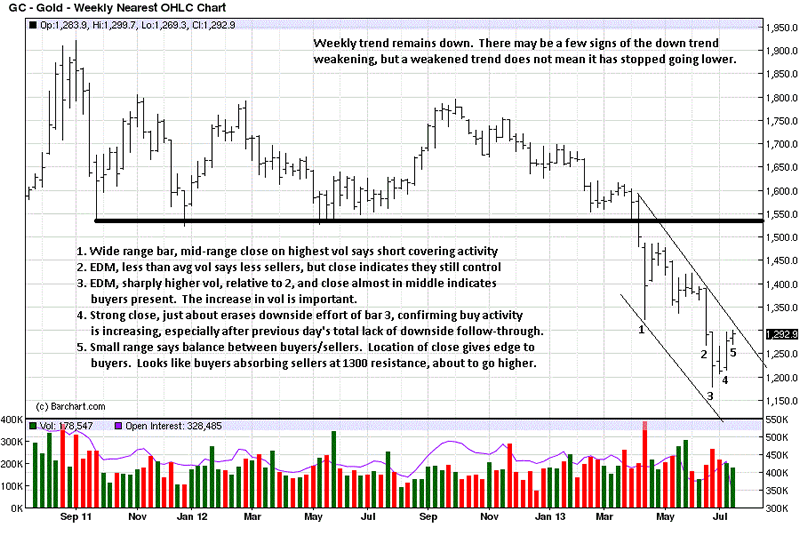
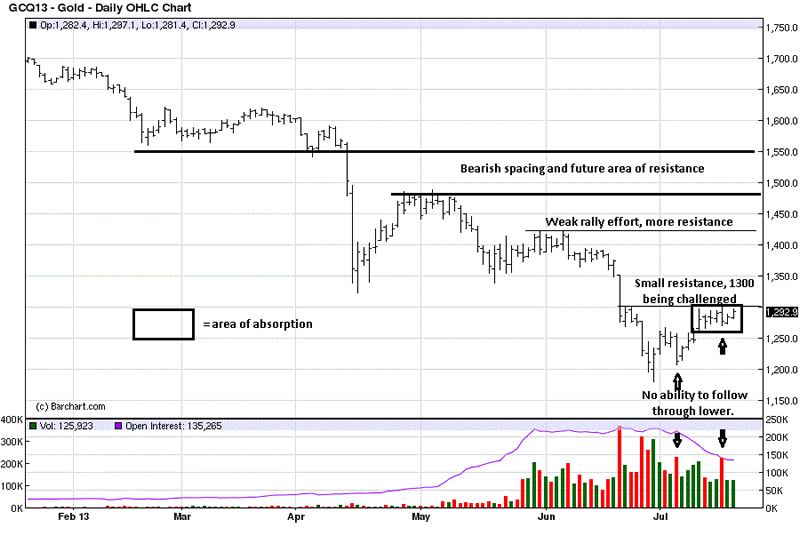
Mention was made that rallies are a normal feature of any bear market, and it is possible gold may break through the immediate resistance area of 1,300, as we show on the daily chart. If you look at late June, when price declined under 1,300, there was a brief two-day rally that failed.
Compare those two trading days then with the last seven now. Price is not reacting away from that resistance. We often state that the how of a price reaction, or lack of one, is the market’s way of telling us what is likely to happen. It appears that buyers are absorbing sellers defending 1,300, and it may give way, next week.
The two strongest volume days in July did not result in any downside follow through, and that, in itself, is a message. You will read more and more articles touting how gold and silver have bottomed. They have not, at least according to price behavior as determined by actual buyers and sellers in the market.
One has to suspend reliance on the natural order of supply and demand in the PMs, for now, until the unnatural forces of faux supply, pretend non-existent interest of demand by central bankers plays itself out.
We can say with certainty that there has been greater buying than selling at the lows in both metals, and that shows clearly in the silver weekly chart. We do not know how much is simply short-covering, still a positive sign, and how much may be actual new longs being accumulated by smart money.
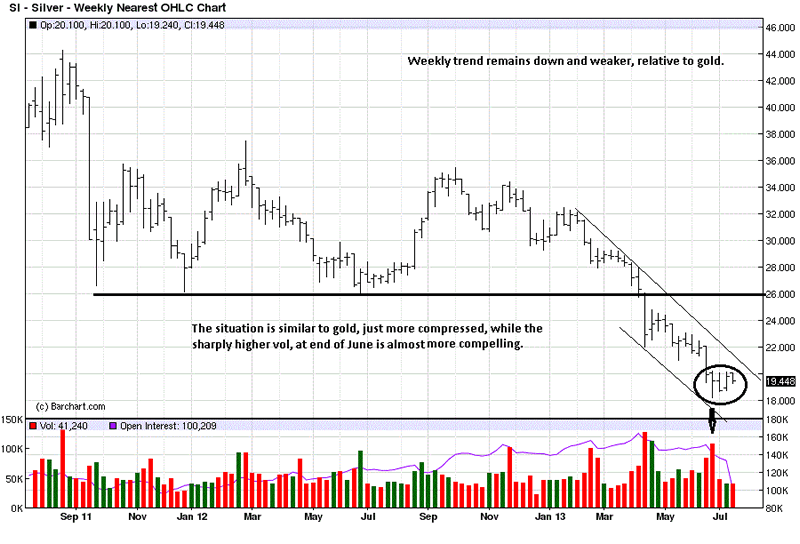
The daily silver is similar to but not as strong as gold. Still, evidence is growing to expect some sort of rally. Until we see the how and the extent of any rally, there can be no change in the assessment that the trend remains down.
We have been urging our readers each and every week, buy physical gold, physical silver, price is not the issue. Having it is! Perhaps now you better understand why. In addition to buying either or both, we also continue to advocate holding it personally. If you do not hold it, you do not own it. Your financial health depends on it.
The Markets’ Worst Kept Secret
by James Gruber
Lashing central bankers
The math of debt
Dreaded reform
Risk of another debt bust?
Here’s what your stockbroker and the media aren’t telling you: the world is more indebted now than it was at the height of the financial bubble in 2007. That’s right. Despite the extraordinary government intervention of the past six years. Despite continuing optimism of a recovery. Despite the reassuring words of central bankers. We’re worse off in debt terms.
From this, there are several inevitable conclusions that will be discussed in depth in this piece:
-
The policies pursued since the financial crisis haven’t worked. Otherwise, debt to GDP ratios would be decreasing, not increasing.
-
Interest rates can’t rise above GDP rates, otherwise debt to GDP ratios will climb further. If they do, you can expect more money printing, budget cuts and tax rises.
-
That means low interest rates are likely to stay for many, many years. It’s the only way to bring the debt down to more sustainable levels.
-
The startling thing about the past six years is the almost total lack of reform to fix the problems which led to the 2008 debt bust. It’s ironic that a paragon of communism, China, may well be the one to soon lead the way on substantive capitalist reforms.
-
Emerging markets, including my neighbourhood of Asia, may be better off than the developed world when it comes to debt, but rising asset and commodity prices have papered over several problems. And these problems are now coming to light.
-
Debt crises happen because incomes can’t support the servicing of the debt any longer. If there is any drop-off in economic growth, a 2008 re-run could well be around the corner. That’s not trying to be dramatic; it’s just the way the math pans out.
Lashing central bankers
It’s been surreal to watch news of Detroit’s bankruptcy this week. Once the bastion of a thriving American automobile industry, the city is now on its knees. Meanwhile, U.S. stock market indices are hitting all-time highs. Compare and contrast…
But it’s also been fascinating to see the commentary around the bankruptcy. Much of this commentary blamed a sharply declining population for the crisis and a host of other reasons. Less mentioned though was the real reason for the bankruptcy: Detroit simply spent far more than earned. And it went deeper into debt to finance the spending, until it could no more.
It’s not entirely surprising that this has been largely overlooked and that Detroit is being treated as an isolated case. That’s what politicians in the U.S. and across the developed world want you to believe. That debt isn’t a big deal and that they can help their cities and countries grow their way out of indebtedness, but they just need a bit more time to achieve this.
However, a recent report by the Bank Of International Settlements (BIS) – often referred to as the central banks’ bank – shows how difficult this task will be. The BIS annual report outlines, in a clear and often confronting way, the realities of the world’s indebtedness and how current money printing and low interest policies won’t fix the problems emanating from 2008. The BIS has credibility as it was one of the very few institutions to warn of excesses in the lead up to the financial crisis. I can’t recommend the report highly enough.
Let’s have a look at some of the report’s key passages. First, the BIS details the extent of the world’s debt problem. It says total debt in large developed market and emerging market countries is now 20% higher as a percentage of GDP than in 2007. In total, the debt in these countries is US$33 trillion higher than back then. Almost none of the countries that it monitors are better off than 2007 in debt to GDP terms.

The BIS describes the level of debt as clearly unsustainable. The primary reason is that studies have repeatedly shown that once debt to GDP rises above 80%, it retards economic growth. Obviously, if money is being spent on servicing debt, then there’s less to spend on investment etc. Most developed market economies now have debt to GDP levels exceeding 100%.
The BIS says governments need to quickly get their balance sheets in order and does some math to prove why. It says current long-term bond yields for major advanced economies are around 2%, well below the average of the two decades leading up to the crisis of 6%.
If yields were to rise just 300 basis points across the maturity spectrum (and still be below average), the losses would be enormous. Under this scenario, holders of U.S. Treasury securities would lose more than US$1 trillion dollars, or almost 8% of U.S. GDP. The losses for holders of debt in France, Italy, Japan and the U.K. would range from 15% to 35% of GDP.

Being the primary holders of this debt, banks would be the biggest losers and ultimately such losses would pose risks for the entire financial system.
The BIS doesn’t let emerging countries off the hook either. It suggests that while debt may be lower in these countries, they’ve benefited from rising asset and commodity prices, which are unlikely to be sustainable. And therefore caution is warranted here too.
But now we get to the juicy bit where the BIS calls the extraordinary policies of developed market central banks into question. For a conservative institution such as the BIS, the language is nothing short of scathing:
“What central bank accommodation has done during the recovery is to borrow time – time for balance sheet repair, time for fiscal consolidation, and time for reforms to restore productivity growth. But the time has not been well used, as continued low interest rates and unconventional policies have made it easy for the private sector to postpone deleveraging, easy for the government to finance deficits, and easy for the authorities to delay needed reforms in the real economy and in the financial system. After all, cheap money makes it easier to borrow than to save, easier to spend than to tax, easier to remain the same than to change.”
And then this:
“Governments hope that if they wait, the economy will grow, driving down the ratio of debt to GDP. And politicians hope that if they wait, incomes and profits will start to grow again, making the reform of labour and product markets less urgent. But waiting will not make things any easier, particularly as public support and patience erode.”
The BIS recommends urgent, broad-based reforms which principally involve cutting back on regulation to allow high-productivity sectors to flourish and for growth to return. It also says households need to makes further cuts to their debts while governments also need to get their balance sheets in order. And regulators need to make sure banks have the capital to absorb any risk of potential losses of the type mentioned above.
The math of debt
It’s worth elaborating on why the current path appears unsustainable, as the BIS alludes too. Put simply, debt is a promise to deliver money. If debt rises faster than money and income, it can do this for a while but there comes a cut-off point when you can’t service the debt. When that happens, you have to cut back on the debt, or deleverage in economic parlance.
There are four ways to deleverage:
-
You can transfer money (Germany transfers money to Cyprus)
-
You can write down the debt. Note though, that one country’s debt is another’s asset.
-
You can cut back on the debt. These days, that’s looked down upon and consequently called austerity.
-
You can print money to cover the debt.
Since 2008, we have seen countries employ all four of these methods.
But the real key is to make sure that interest rates remain below GDP rates. If that happens, debt to GDP levels will gradually fall. If not, they’ll inevitably rise. So say bond yields rise to the post war average of 6% in the U.S., and interest rates increase to comparative levels, nominal GDP would have to be above 6% for debt to GDP levels to decline.
If you understand this, then you’ll realise that talk of “tapering” in the U.S. is likely a load of baloney. Real U.S. GDP growth is expected to be close to 1% in the second quarter, with inflation at around 1.1%, resulting in nominal GDP growth of 2.1%. Many expect this nominal GDP to rise to +3% over the next 12 months. But even at those levels, bond yields can’t be allowed to rise much further (with 10-year yields at close to 2.5%). Otherwise, debt to GDP ratios will rise, impeding future growth and making budget cuts, tax rises and more money printing inevitable.
If the U.S. does taper and bond yields there rise, this would put upward pressure on bond yields in Europe. With GDP growth near zero and still exorbitant debt levels, higher bond yields would quickly crush the Eurozone.
This is why central banks can’t allow higher bond yields and interest rates. Of course, central banks don’t control long-term bond yields; markets do. If central banks want low bond yields, markets will comply until they don’t. That is until they don’t trust that the current strategies of central banks are working. Given that investors are still enamoured with the every word and hint of Ben Bernanke and his ilk, it would seem that the time when bond markets do turn ugly is still a way off.
Dreaded reform
As the BIS points out though, reform is also critical to better economic growth for the developed world and lower debt burdens. On this front, it’s amazing how little restructuring has actually occurred in the U.S. and Europe.
In the U.S. for instance, can you name one piece of significant reform which has reduced regulation and led to growth in new prospective sectors? I can’t, but maybe I’ve missed something.
The trend of the U.S. results season seems to bear this out. U.S. banks have killed it, while many other sectors such as tech haven’t. It’s hardly surprising that current policies are benefiting banks at the expense of the real economy. After all, not only did banks get massive bailouts in 2008 but they’ve been given almost free money from the Federal Reserve via QE ever since. The banking sector is not back to 2007 levels but it’s gradually getting there. Who would have thought this would happen just six years after the biggest debt bust in more than 70 years?
It’s somewhat ironic that instead of the U.S. or Europe, it’s Asia which may be about to lead the way on the reform front. Late on Friday, China announced that it would scrap controls on lending rates and let banks price their loans by themselves. This means cash-strapped companies may have access to cheaper loans. This cheaper credit could further spur the current debt bubble. But the move is likely to have an adverse impact on the profitability of the state-owned banks, thereby making them more reluctant to lend.
It’s expected that the move will foreshadow a later, more important policy to remove controls on deposit rates. Higher deposit rates would increase household income and go some way towards the government’s goal to increase consumption and re-balance the economy.
These financial reforms are likely to be only a small part of a plethora of reforms that China will announce over the next 3 months. As I’ve said previously, I think investors are underestimating the pragmatism of the new leadership and their willingness to take short-term pain to reap later benefits. It won’t be enough to prevent a serious economic downturn but it bodes well for the long-term. The one risk to this scenario is if growth slows enough for unemployment to rise. If that happens, stimulus may again become the got-to tool at the expense of reform. But we’re nowhere near that point yet.
Japan is the other country which may go through with some significant reform. This weekend’s parliamentary elections should solidify Shinzo Abe’s power and give him the platform to pursue more deep-seated reforms. However, the big question remains whether any reform can prevent the country from being overwhelmed by its enormous debt. I’m in the minority suggesting that the debt is simply too large and reform will do little to prevent Japan from going insolvent, if it isn’t already.
Risk of another debt bust?
Which brings me to the key conclusion of this piece. That is, it’s hard to see the U.S, Europe, Japan and other developed world countries implementing reform in time to prevent their debts from rising further and possibly imploding. In other words, many of the fears of the BIS may well come true.
That may sound pessimistic and, to some, melodramatic. But the reality is that little has been done in the past six years to restructure economies and cut debt ie. learning the lessons of 2008. Because we’ve partially recovered from that traumatic period, that’s led to complacency. All the while, the debt that caused the bust in the first place has compounded and threatens to undo the world again.
Let’s hope it doesn’t come to that.
And that’s all for this week.
Our "As You Wish" Markets Have Reached the Cliffs of Insanity
by Adam Taggart
In the classic fantasy rom-com The Princess Bride, the beautiful maid Buttercup orders the farm boy Westley to perform numerous tasks to test his servitude. No matter the magnitude of the request, Westley simply answers "As you wish" and makes it so. Buttercup eventually comes to view Wesley with similar devotion, and true love is born.
Similarly, investors have fallen back in love with the capital markets, whose continual response their increasingly irrational hopes has been "As you wish."
Slumping GDP & Revenues
For example, U.S. GDP growth is awful – it's slow and getting slower. It grew 1.8% in Q1 (lower than initially thought) and now analysts are tripping over themselves in a rush to lower their target estimates for Q2; some to as low as 0.3% (Morgan Stanley).
Stock prices are based on assumed future earnings growth. If it looks like companies are going to grow their profits faster in the future, then stock prices should go higher. So, in an economy displaying sluggish/decelerating growth, math would dictate that earnings growth estimates should be handicapped by some factor and stock prices should moderate. But that's not happening in today's markets.
Similarly, freshly released Q2 company reports show that a growing number of the largest companies are missing their revenue expectations. And where revenue goes, so earnings (eventually) must follow:
Where Did All the Revenues Go? (Zero Hedge)
According to Deutsche Bank, of the 70 S&P500 companies reporting so far (excluding this morning's GE EPS beat and revenue miss), 50 have beaten EPS estimates and only 20 of them have missed. As for sales revenue, just 37 of them have topped analysts' estimates and 33 of them have missed. In reality the revenue beat % is also being skewed slightly higher by the stronger top line performance in US financials so far. If we strip aside US financials, the revenue beat:miss ratio is around 45%:55%. Coca-Cola, Yahoo, Intel, IBM, eBay, Google, GE and MSFT are just some of the household names that have disappointed on the revenue front so far.
One thing is certain: based on the one metric companies can't fudge, the global economy is not only slowing down, but what's worse, the hundreds of billions of incremental money created by central banks one and all, is not even making its way into the corporate revenue pipeline. For now, the "hope" strategy has worked (i.e., next quarter things will be better). But this final fallback, which so far has only disappointed, will soon no longer work, when virtually every known accounting tactic is used up and there is nowhere else to go for EPS than where revenues have already been heading for the past two quarters. Down.
With the downward trajectory in corporate revenues, forward earnings expectations should be moderated from their prior levels and stock prices should adjust downward. But, again, that's not happening in today's markets.
Instead, like Buttercup, Wall Street is petulantly demanding rising prices, and the markets are answering: "As you wish." Yesterday, July 18th, both the Dow and S&P 500 closed at all-time highs.
Indeed, the markets have been busy the entire past year making wishes for high prices so. And the pace at which these higher prices are being delivered has increased in the past month:

The chart above shows that in July, the slope of price appreciation has become nearly vertical – completely ignoring the slowing GDP and revenue data. To borrow from The Princess Bride again, we've reached the Cliffs of Insanity:
Rising Oil Prices
But there's more that's making rising stock prices seem even more irrational at this time.
Oil, the master resource that greases the gears of the global economy, has been rising, too.
Today, oil briefly rose above $109 a barrel. It has risen over $15/barrel since early May.
When oil prices rise, the cost of conducting business rises. Therefore, corporate earnings decline. In addition, the price of gasoline rises, hurting consumer spending, which compounds the decline in corporate earnings. And the expectation of these lower earnings should lead to lower stock prices.
But as we see here, the S&P has powered higher during the upward march of crude prices:

Rising Interest Rates
To make matters even worse, interest rates have recently started rising. This will be a huge development if it continues, but rates are already 60% higher than they were a year ago and are sure to have a cooling effect on economic activity (as borrowing costs increase, resulting in less purchasing at both the wholesale and retail levels). Perhaps they already are, as reflected in the slowing GDP numbers above.

Inconceivable!
Just as The Princess Bride was a great fantasy, so is any convoluted rationale being used to justify the current elevation of prices in today's capital markets.
What if we were to teleport in time to the beginning of the year and ask any impartial analyst what would happen to stocks if H1 2013 experienced:
- A dramatic deceleration in GDP
- Revenue misses at many of the biggest blue chip multinational companies
- Sharply rising oil prices
- A long-term trend reversal towards rising interest rates
The call would have been easy and likely unanimous: Stocks will go down. Or at the very least, enter a defensive "wait and see" trading range.
Of course, that's not what's happened. And the point here is not to bemoan the past, but to ask: What's more likely to happen from here? A continuation of the same extreme outlying behavior? Or a return to relationships that have governed markets for centuries?
To help in your decision-making, Bank of America just reported that money is now entering the U.S. stock market at the fastest rate since June 2008 (right before the last big market crash):
Largest weekly inflow to U.S. equity funds since June ‘08 (note market value of S&P500 index, adjusted for float, exceeded $15 trillion for the first time ever today) Huge $20bn global equity
inflows versus $1bn out of bonds.

That's a classic signal that a market top is near. Money entering (or remaining in) today's stock market with the blithe hope that the party will continue onwards may soon find themselves in the Pit of Despair
At least the gold bugs will be happy to have the company.
Because to expect continued record stock prices in the face of the very fundamental headwinds discussed here is simply...
Subscribe to:
Comments (Atom)