Thursday, May 5, 2011

+ 6.23 % Also In April! Seventh Good Consecutive Month For Our Galaxy Portfolio Systems!

Nella sottostante tabella sono raffigurate le equity line mensili dei trading systems che compongono il nostro portfolio systems Galaxy ed il riassunto MTM dell’operatività dal Novembre 2009. Galaxy chiude con un ottimo risultato anche il mese di Aprile, dopo un equivalente risultato nel mese di Gennaio e Febbraio, portando a 29.59 % la performance del 2011. Quello appena chiuso è il settimo risultato utile consecutivo a livello mensile dopo la breve pausa alla fine dell’estate dello scorso anno. L’equity continua a svilupparsi in maniera armonica mantenendo un’inclinazione positiva e costante grazie all’elevata diversificazione all’interno del portfolio. I risultati storici di Galaxy Portfolio System sono disponibili ai seguenti link: http://www.box.net/shared/static/nz7u0ztnbp.xls, http://box.net/shared/b9cg6kfa6s. I risultati dei singoli trading systems sono a disposizione al seguente link: http://www.box.net/shared/5vajnzc4cp.

Richiedi la demo gratuita di 30 giorni di Galaxy Combined Portfolio Systems 

In the table below you can see the monthly equity line of the trading systems that make our Galaxy portfolio systems and the MTM performance summary since November 2009. Galaxy ends with a good result also the month of April, after a similar result in the month of January and February, bringing the performance to 29.59 % in 2011. One just closed is the seventh consecutive positive months after the brief pause at the end of the summer last year. The equity continues to grow in harmony while maintaining an upward slope and steady thanks to high diversification within the portfolio. Historical results of Galaxy Combined Portfolio System are available at the following links: http://www.box.net/shared/static/nz7u0ztnbp.xls, http://box.net/shared/b9cg6kfa6s. Historical results of single trading systems are available at the following link: http://www.box.net/shared/5vajnzc4cp.

Request a free demo of 30 days of Galaxy Combined Porolio Systems
 

Galaxy Risultati Aprile


Equity Line Trades, Giornaliera e Mensile di Galaxy / Trades, Daily and Monthly Galaxy Equity Line                                 Free Demo Available
Galaxy Trades Galaxy Time Galaxy Mensile Galaxy Demo2


Performance MTM Mensile di Galaxy Portfolio System con un capitale iniziale di $ 200.000
Monthly MTM Performance of Galaxy Combined Portfolio System with $ 200K initial capital


  Jan
  Feb
Mar
Apr 
May
Jun 
Jul  
Aug
Sep
Oct 
Nov 
Dec 
2009


1.19 %
2.90 %
2010
(4.28 %)
24.49 %
2.99 %
1.76 %
15.62 %
4.35 %
10.60 %
(0.41 %)
(4.73 %)
1.75 %
12.80 %
1.50 %
2011
7.54 %
7.75 %
8.06 %
6.23 %


Galaxy Risultati Mensili image

Your diversification strategy is working correctly?
The diversification is a management technique that mixes a wide variety of investments within a portfolio. The main benefit of adding managed futures to a balanced portfolio is the potential to decrease portfolio volatility. Risk reduction is possible because managed futures can trade across a wide range of global markets that have virtually no long-term correlation to most traditional asset classes. Moreover, managed futures funds generally perform well during adverse economic or market conditions for stocks and bonds, thereby providing excellent downside protection in most portfolios.

The diversification between assets
The diversification between assets that have low correlation between them improves the overall performance of our investments for the same risk, thus reducing our exposure to risk decreases as the so-called "specified risk" linked to a single class of financial products. Basically, if you only held the shares, the result of your trading / investment is overly tied to the fortunes of a particular financial instrument for which you are running too high a risk. A well-diversified portfolio asset class is one of the major components that create the optimal portfolio. Read "The Art Of Asset Allocation" and "Top 10 Rules Of Portfolio Diversification".

The diversification within an asset
Concentrating investments in individual products or securities, you are exposed to a type of risk that can not be controlled, and the risk becomes uncertainty, which is something that is incalculable. is possible, even in this case, reduce the specific risks by trading or investing, for example, not a single product but a basket of products that represents a very large share of the market. Read "The Art Of Asset Allocation" and "Top 10 Rules Of Portfolio Diversification".

The diversification of trading methods
It combines the use of different methods of trading not correlated to improve the relationship between profit and maximum loss. The low correlation between different methods tends to reduce overall losses due to the combined performance of two or more trading systems. It is therefore one of the most effective ways to improve the performance of our investments while reducing risk. Read "The Art Of Asset Allocation" and "Top 10 Rules Of Portfolio Diversification".

The diversification of the trading system parameters
Is to use, within the same trading system, of different sets of parameters. Assuming that a trading account manage an adequate capital for diversification, it is better to diversify sets of parameters rather than making multiple contracts with the same set of parameters. The diversification of the set of parameters helps to minimize risk and strengthen our ability to remain disciplined and consistent psychological application of the trading system. Read "The Art Of Asset Allocation" and "Top 10 Rules Of Portfolio Diversification"

TOGETHER TO WIN: GALAXY PORTFOLIO SYSTEMS
Our goal is to generates significant medium term capital growth independent of stock and bond markets with simple and strict risk trading rules with maximum possible diversification. All our Portfolio Systems are designed assembled and managed with this philosophy. Due to the high diversification that characterizes them, our Portfolio Systems enhance the positive synergies of individual Trading Systems which are composed and dramatically reduce the overall risk. Diversification remains the cornerstone of modern portfolio theory.  Yet, during the financial crisis many "diversifying” investments readily followed the direction of the equity markets as they collapsed in 2008 and 2009. By contrast, our Portfolio Systems have just obtained their best resultsin 2008 thanks to the volatility of the period, the high diversification and the construction model that makes them independent of market equity and bond.


Material in this post does not constitute investment advice or a recommendation and do not constitute solicitation to public savings. Operate with any financial instrument is safe, even higher if working on derivatives. Be sure to operate only with capital that you can lose. Past performance of the methods described on this blog do not constitute any guarantee for future earnings. The reader should be held responsible for the risks of their investments and for making use of the information contained in the pages of this blog. Trading Weeks should not be considered in any way responsible for any financial losses suffered by the user of the information contained on this blog.

Cocoa leads crop falls as US data speeds fund exit

by Agrimoney.com

Cocoa led crops lower as commodities suffered another sell-off, accelerated by a report showing US jobless claims at an eight-month high fuelled a switch to assets deemed less risky.
New claims for US unemployment benefits rose by 43,000 to 474,000 in the last week of April, the highest since August, and significantly higher than the 410,000 that economists had expected, official data showed.
The figures exacerbated economic jitters on commodity markets already fretting over a round of interest rate rises, in countries such as India and Russia, and the impact of
"Global inflation is a major concern and has market trimming position on expectation of interest rate increases from China and the European Union, and slowing consumer demand due to high cost of fuel and food," grains broker Benson Quinn Commodities said.
The European Central Bank actually left interest rates on hold on Thursday. However, the UK added to the economic gloom by revealing a sharp slowdown in service sector growth last month, a decline blamed on government spending cuts.
'Tumbling hard'
On commodity markets, oil tumbled nearly 4%, for both Brent and West Texas Intermediate crude, while copper fell to a 2011 low, and tin plunged 7%, declines accelerated by a scramble for the dollar, as a safe haven asset, regaining it 0.9% against a basket of currencies.
A stronger greenback makes dollar-denominated assets, including many raw materials, less appealing to buyers in other currencies.
Among agricultural commodities, cotton tumbled 4.3% to a three month low of 144.95 cents a pound in New York for July delivery, after US export sales data revealed a sixth successive week of negative trade – ie with cancellations exceeding new orders.
New York cocoa for July plunged 4.6% to $3,211 a tonne, a decline accelerated by expectations of an imminent resumption of exports from Ivory Coast, the top producer and shipper of the bean.
"Cocoa prices are tumbling hard, partly due to the movement of ships out of Ivory Coast ports," James Mount at PitGuru said.
"As beans start flowing from the embattled African country there was bound to be a sell-off," with the mid-crop harvest adding extra supply pressure.
More rain?
In Chicago, all three major crops lost more than 2%, despite forecasts for additional rain, starting around May 13, in many regions of the US Corn Belt, which are attempting to catch up on delayed corn sowings.
"The issue of uncertainty is all of the eastern Corn Belt which is much wetter [the the western Corn Belt] and where it only stopped raining 48 hours ago," WxRisk.com said.
"This new additional four-to-five days of rain coming is really going to hurt and the flooding situation is only going to get worse."
However, US weekly exports sales data were "poor across the board" for grains and oilseeds too, broker US Commodities said, coming in, at 284,000 tonnes for corn and 275,000 tonnes for wheat, below the lowest analyst's estimate.
Soybeans sales, at 21,600 tonnes, compared with estimates of at least 150,000 tonnes, and potentially 250,000 tonnes.

See the original article >>

Silver Enters Bear Market

by Bespoke Investment Group

That didn't take long. After nearly doubling from $27 to $49.82 in just three months, silver is down 24% over the last four days, officially putting it in bear market (-20%+) territory. As shown below, silver has finally broken below its 50-day moving average today.


And don't look now, but oil is down to $105 as of this morning, putting it below its 50-day moving average as well. Oil is now down 8.2% from its high of $114.83 seen on Monday.


See the original article >>

Silver Leads Precious Metals Sell-Off

By: Mike_Paulenoff

The iShares Silver Trust (SLV) is down 20% in 4 trading sessions. Let's notice that the SLV has given back ALL of its near-vertical upside blow-off type action ($37.00-$48.35) after the price structure hurdled the top of its 10-month bullish channel.

The SLV has returned to the vicinity of the extension of the upper channel line, which now serves as support starting at $38.30, into the area of the sharply rising 50 DMA ($37.85), which should contain and reverse current SLV weakness.

Meanwhile, SPDR Gold Shares (GLD) has corrected by a modest 3% (compared with the -20% in the SLV) off of its May 2 all-time high at $153.61, and is nearing a test of key near-term support at $148.00-$146.00, which should contain the weakness prior to the resumption of strength.


See the original article >>

Glencore reveals secrets of success in agriculture

by Agrimoney.com

Choose your battles. Is that the secret of the successful grain merchant?
It would appear so, to judge by Glencore, which for a multi-commodities giant maintains a relatively modest share of the "addressable" global grain trade, at 8.7%, and only 4.5% in oilseeds and oils, despite claiming an enviable record of winning business.
"Glencore estimates that it is awarded at least part of the tender in at least half of the agricultural tenders in which it participates," the company says in the prospectus to accompany its stockmarket flotation later this month.
And even when it loses, "it is sometimes able to supply part of the tender to the successful applicant".
Little wonder that the group's agricultural products segment more than doubled underlying operating profits last year, to $717m, a performance in line with the company average, and making it, unusually, a bigger earner than Glencore's energy products division, which is nearly nine times the size by revenues.
Growing in cotton
Not that winning tenders is the only trick boasted by the division's 8,000 staff, with last year's result also reflecting "tight and dislocated market conditions" – in contrast to a slump in profits in 2009, when low grain price volatility "reduced the number of arbitrage opportunities".
And Glencore also gained traction in cotton, a market it entered in 2008 when wrong bets on volatile prices price, coupled with tight credit, forced a number of merchants into financial difficulties. America's fourth-ranked merchant, Paul Reinhart Inc, filed for bankruptcy protection.
"Numerous traditional and single commodity players were exiting the industry. This lack of competition was seen as an opportunity for another major player," Glencore said, noting that its trading volumes in the fibre reached some 200,000 tonnes last year, from minimal levels in 2009.
This was the reversal of the group's performance in sugar, in which volumes halved to some 500,000 tonnes – a decline which was left unexplained.
Farming results
Furthermore, Glencore's 270,000-hectare farming operations achieved higher production last year despite the poor weather which beset many of the regions in which it operates.
Sure, the group's Kazakh division suffered amid the drought in the former Soviet Union, seeing production fall by more than 60% to 18.6m tonnes. (It is not clear from the prospectus if farm expansion or sales are also involved in changes in output data.)
And the company was not alone in Australia in reporting a bumper harvest, up by more than one-half at 103,500 tonnes.
But it achieved higher production in both Ukraine, its biggest production operation by crop volume, where the corn harvest soared, and Russia.
Volumes rose 16% in Argentina, where Glencore appears to have near given up on wheat (about which many farmers have gripes over government export restrictions) in favour of corn and, in particular, soybeans. The company's harvest of the oilseed doubled last year.
Billionaires
The data are among the raft of revelations about what was a famously secretive business, widely touted as "the biggest company you have never heard of", in the run up to its flotation in London and Hong Kong.
In agriculture, other snippets include an acknowledgment that it is "very active" in trading in sugar on New York's Ice exchange, besides on markets in China, India and Russia.
Glencore also boasts 4.8m tonnes in elevator and silo capacity and owns 250 rail wagons in the former Soviet Union.
Perhaps the most widely publicised detail has been the revelation that the flotation will value the stake belonging to Glencore chief executive Ivan Glasenburg at $10bn, with four other executives becoming overnight billionaires.
Corruption charges
However, it is not all plain sailing, as one unnamed current employee, a former staff member and Glencore Grain Rotterdam have found, who have been charged with corruption "in exchange for information covered by professional secrecy in the course of the applications for European export restitutions".
The case, involving "violation of professional secrecy, corruption of an international civil servant and criminal conspiracy", and which has dragged in the European Commission's agriculture directorate, is a dated one, relating to 1999-2003.
But, with the trial scheduled for this year, that may not prevent the allegations from reaping Glencore unsavoury coverage, now that the media have been alerted.
Will the group regret allowing sunlight in on its operations? That the flotation will create scores of Glencore millionaires, besides the billionaires and give the group a market value of some $60bn suggests otherwise.

See the original article >>

Confirmation of China deal to underpin corn prices

by Agrimoney.com

Confirmation that China was behind one of the biggest-ever purchases of US corn will underpin prices of the grain, even if the US harvest recovers from sowing delays to achieve bumper yields, Commerzbank said.
Acknowledgement by Sinograin, which manages China's central government grain reserves, that it bought 1.0m tonnes of American corn in March, has underlined the country's status as a buyer of the grain – at the right price.
"China has thus confirmed its reputation as an opportunistic market player, buying when prices fall and selling when prices rise," the bank said.
Expectations that Sinograin, which has denied further purchases for now, may buy more the grain if the market tumbles again "should thus stand in the way of a major slump in corn prices, even if the harvest does exceed forecasts".
"More corn purchases are possible in the coming months if prices retreat."
'A slow go'
The comments come amid a dip in grain markets, attributed largely to an easing in the wet weather which has delayed US corn sowings, and southern dryness which has damaged prospects for winter wheat.
In Chicago, corn futures for July delivery lost 1.4% to $7.19 ½ a bushel on Thursday, as of 11:10 GMT, returning to among their lowest levels since late March.
However, the prospect of further planting hold-ups, with more rains forecast for the northern Midwest, remains an "overriding concern", Commerzbank said.
At broker Market 1, Mike Mawdsley hightlighted an eight-to-14 day forecast which "has Montana, South and North Dakota, Minnesota, Iowa, Wisconsin, Michigan, Illinois, Indiana, and Ohio all with below normal temperatures and above normal precipitation.
"Yes, there will be planting done, but it would certainly appear to be a slow go, as well as slow emergence with the cool temperatures ."
High-profile deal
Sinograin's admission comes two months after the US Department of Agriculture revealed a 1.25m- tonne sale of US corn to an "unknown" destination, believed at the time to be China, as crop prices tumbled following the Japanese earthquake.
The deal - America's sixth-biggest ever corn sale - regained prominence this week as traders reported that the first delivery of the order was being loaded in the US Pacific North West. Further details may be revealed in weekly US export data due later on Thursday.
There is talk that corn reserves in China, the second-ranked producer and consumer of the grain, have fallen to some 10m tonnes, a figure which would come in well below official estimates, at the lowest for some 40 years.
Many observers have questioned the accuracy of China's harvest estimates, notably a 164m-tonne figure for the harvest two years ago, despite weather setbacks which some analysts believe cut production below 140m tonnes.

Defensive Stocks Sector Strength Points to S&P 500 Weakness


The recent sector strength of the Consumer staples ETF (XLP) over the Consumer discretionary ETF (XLY) indicates that money is now flowing out of a growth industry group and into a defensive sector. This action normally occurs during a period of weakness in the S&P 500.

Over the past few years, this shift in buying pressure between these two consumer sectors has provided guidance to the short term movements of the broad-based S&P 500. As models are indicating that a low in the index is expected in June, the returning performance of the defensive staples sector over discretionaries adds some additional evidence to the anticipated pullback.


Bottom line: The ratio line between XLP and XLY normally trends in the opposite direction to the S&P 500. Greater relative performance from the Consumer staples ETF (XLP) over the Consumer discretionary ETF (XLY) creates a rising line. This also indicates that money is flowing into the defensive sector. The action usually coordinates with a downward movement in the S&P 500.

Investment approach: With the S&P 500 trading on a stable 14-16 week cycle and an expected low in June (the last trough was in mid-March), this recent shift in performance from the growth sector (XLY) to the defensive group (XLP) adds additional evidence for the expected low. Investors may wish to wait on the sidelines for now and use this coming retracement as a buying opportunity.

See the original article >>

Commodities Bull Market and the Cheapest Money in History


So the cheapest money in history played no role in killing the century-long downtrend in commodity prices...?

A LITTLE over three years ago, we published this chart here at BullionVault – now updated so you can see just how much mischief cheap money is causing...


The second-half of the 20th century saw the cost of raw materials fall by almost 75% in real terms. (It's shown on our chart by the 19 most-heavily traded commodities, courtesy of the Reuters/CRB Continuous Index, adjusted by the US consumer-price index.)

This gift to savers and consumers was itself an extension of a trend beginning almost 100 years earlier for Americans (the end of the US Civil War), and some 150 years earlier in Europe (the end of Napoleon). Yes, there'd been a little "blut und eisen" in the meantime. But just as the oil shocks of the 1970s failed to break the long-term, secular trend – despite doubling real prices inside 3 years – so too failed the far bloodier shocks of World Wars I and II...


See those question marks at the all-time low? We'll get back to what event they might represent in a second. Because right now, "Mrs. Market is...sending us the Mother of all price signals," says the GMO asset managers' Jeremy Grantham, spotting the same break in trend we noted in Feb. 2008.

Grantham's been watching this signal for longer still, but now puts it very succinctly:

"The prices of all important commodities except oil declined for 100 years until 2002, by an average of 70%. From 2002 until now, this entire decline was erased by a bigger price surge than occurred during World War II."

What to do? As a money-manager, Grantham says he's got short-term trades and investments to recommend, of course. But he also plays politician, urging the United States "and every other country [to get] a longer-term resource plan." Being neither money managers nor politicos here at BullionVault, we're spared both of those urges. Which leaves only the urge to figure out why real commodity prices now stand back at their early 1980s' level. Which means trying to figure out what changed in 2002.

"The Monetary Maniacs may ascribe the entire move to low interest rates," says Grantham. "But commodities are made and bought by serious professionals for whom today’s price is life and death. Realistic supply and demand really is the main infl uence."

You'll find this same school of "Money? Schmoney!" analysis flexing its intellect in plenty of other arguments right now, too. Rather than ultra-low interest rates knocking the Dollar lower since – hey! – 2002, "There is a global Dollar overhang that is being unwound" by central-bank reserve managers, reckons Pharo Management portfolio manager Mark Dow, writing for Reuters. "The key drivers of inflation [are] oil and commodity prices, factors beyond the Bank of England's control," says UK economist Roger Bootle of Capital Economics and Deloitte. "Questions remain about the capacity of the ECB to find a local solution to a largely global problem," agrees KBC Bank in Brussels. Indeed, and quite apart from "expansionary monetary policy...other factors, such as growth in emerging market economies, are more likely to be the main drivers," according to research by the Federal Reserve Bank of San Francisco.

Besides, "Sharp increases and decreases in commodity prices have had little, if any, impact on core inflation," as the Chicago Fed declared in its own research last month. Which means that "upward pressure on inflation [is only] transitory," as the Fed's rate-setting committee has decided time and again this spring.

So there you have it. All these very bright people agree that the "monetary maniacs" are wrong. The record-low global interest rates of 2002 did not spark the swing higher in real commodity prices. The even recorder-low global interest rates of 2009 did not revive the commodity market's uptrend after the subprime diversion and banking crisis.

No, "The primary cause of this change is...the accelerated size and growth of China," says Jeremy Grantham – concuring with the San Fran Fed – "[plus] its astonishingly high percentage of capital spending, which is over 50% of GDP, a level never before reached by any economy in history, and by a wide margin."
Quite where China got the money from, however, no one says.


Three trillion dollars is a lot of cash to hoard up in barely 10 years. It's a lot of cash to unleash on the world's commodity markets, too. And "peak oil" or not, us monetary maniacs might just have a point. Real returns to cash do matter.

Doubtless the world really is hitting its straps in terms of natural resources, as GMO's Jeremy Grantham warns. But bringing the scramble forwards by handing out ever-more claims upon those scarce resources – and at the lowest nominal interest rates in history – can hardly be blameless.

See the original article >>

Jobless Claims Surge

by Bespoke Investment Group

Weekly jobless claims this week surged to 474K from last week's upwardly revised level of 429K. This is the highest weekly total since August 2010 (right before QE2 was announced). It is also the fourth straight week where claims have been above 400K, bringing the four week average up to 431K, which is the highest reading in 2011. Needless to say, sentiment heading into tomorrow's employment report is not too positive.


ISM Non-Manufacturing Survey Shows Slowing U.S. Economy

By: Asha_Bangalore

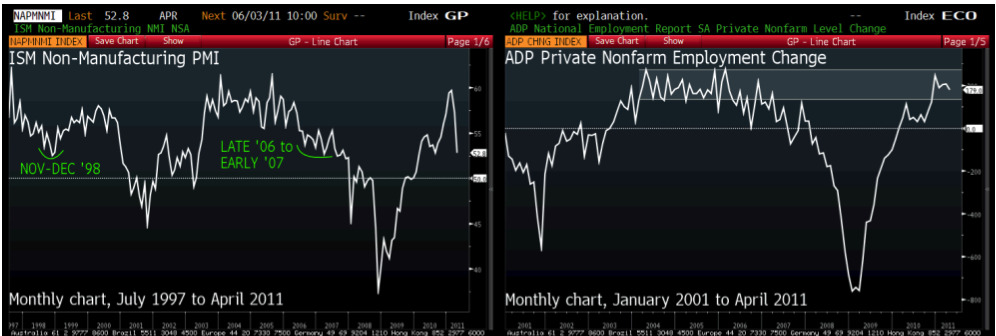
The ISM non-manufacturing survey results point to slowing conditions in the service sector of the economy in April. The composite index declined to 52.8 in April from 57.3 in March. This is the second monthly decline and the lowest since July 2010 (see Chart 1). The composite index is made up of four equally weighted components. Of the four components, supplier deliveries advanced in April (53.0 vs. 51.5), while indexes tracking new orders (52.7 vs. 64.1 in March), business activity (53.7 vs. 59.7 in March) and employment (51.9 vs. 53.7) declined. 


The sum of the composite indexes of manufacturing and non-manufacturing (53.1) is the lowest since August 2010. (see Chart 2). The sum of the composite indexes tracks the year-to-year change in real GDP closely. The recent soft readings of these surveys suggest that real GDP growth could show a moderating trend in the second quarter of 2011. 

Mortgage Purchase Applications for April Point to a Small Increase in Home Sales

For the week ended April 30, mortgage applications for purchases of homes rose 0.3% to 182.7. Mortgage purchase applications of homes rose 1.8% during the entire month of April following a 6.00% jump in the prior month. The recent monthly gain bodes positively for home sales, albeit a small increase is likely compared with the tally of home sales in March when new homes sales rose 11.1% and sales of existing homes advanced 3.1%.


Global Growth Slowdown?

By Guest Author

My friend Marshall Auerback wrote me about two weeks ago with a laundry list of observations pointing to a global growth slowdown, and it’s looking like a very prescient email. Both the ADP Employment Report and ISM Non-Manufacturing Index (NMI) came in light today relative to expectations, although on a stand alone basis they were okay. I don’t want to overstate the bearish case: a net gain of 179,000 jobs in April and modest growth in the services sector (52.8 for the ISM NMI headline, above the 50 mark which separates growth from contraction) both constitute economic progress.
The cyclical economic recovery is intact.
>

>
However, these reports were significant from a market strategy standpoint because they do call into question the notion that the recovery is self-sustaining. GDP growth driven by private consumption & investment should lead to different market outcomes than GDP growth driven by government consumption & investment (or by export growth assuming a weaker dollar). If we assume that the so-called hand-off between public sector stimulus and private sector growth has not been made, consumer names should diverge with staples outperforming discretionary, and precious metals and energy stocks should benefit from dollar debasement policies. The rest of the winners and losers would be determined by the nature of the stimulus: tax cuts would create different outcomes than, say, a package heavy on infrastructure spending.

Furthermore, given the political polarization we’ve seen over the last several years, the magnitude of any stimulus – again, assuming that today’s reports indicate that the public-private hand-off has not been made – is also uncertain. Hesitation by the fiscal authorities (i.e. Congress resisting the exhortation/influence of Treasury and the Fed) could lead to a debt deflation spiral that would crush equities and commodities and send the bond market soaring, while hesitation by the monetary authorities…aw, shucks, “hesitation by the monetary authorities” – who am I kidding? Under the current Chairman, the Fed will most assuredly address signs of economic weakness with “shock and awe” policies just as it did in August 2010. That’s one of the reasons I rarely have a negative word to say about gold. (Chairman Bernanke’s term is up for renewal in January 2014, by the way.)

Today’s sell-off was probably exacerbated by nervousness surrounding the above issues, but I don’t think the sell-off was generated by them. Maybe in their absence we could have rallied earlier and stronger. There’s something else at work that’s pulling equities lower and reversing the risk trade, and all I can do is speculate about what the cause might be:
1. “Sell in May, go away”? That seems absurdly simple, but then simplicity probably has moved more markets than complexity.
2. Getting out ahead of the end of QE2? Maybe.
3. Questions over China’s growth trajectory? This is probably my favorite explanation. Do you know what the dollar has done against the euro this week? Nothing. It’s flat. Yet, commodities have been waylaid. I know that some of the euro’s strength is attributable to rate hike expectations (watch for “vigilance” tomorrow from JC Trichet), but there is nothing to suggest that the dollar is bid, per se – except for the weakness in commodities (particularly silver, nickel and crude oil, which last I checked are all industrial commodities).
4. Silver has got its own special issues, but the weakness in crude and the other base metals is worth considering. We all know that China drives these prices because we hear about it when the prices go up. Well, not only was China’s latest manufacturing PMI weak (52.9), but in the latest quarterly monetary policy report from the PBoC – released last night – we learned that “stabilizing prices and managing inflation expectations are critical.” It sounds like China is not done tightening.
It’s time, I think, to pay closer attention to the China slowdown story. Evidence of a harder-than-expected landing has the potential to reverse the dynamics of the commodities markets, and it would also shake up the global terms of trade.

See the original article >>

A Replay of The Great Escape?

from Chris Kimble

Chris Kimble has an interesting post on blog this morning with a troubling question as the title: Is A Great Escape Taking Placeabout To Take Place In A Wide Variety Of Assets? Here are the two chart four-packs that illustrate his view. Check out his website for further explanation. 


Click to View

Click to View

See the original article >>

+ 6.23 % Also In April! Seventh Good Consecutive Month For Our Galaxy Portfolio Systems!

Nella sottostante tabella sono raffigurate le equity line mensili dei trading systems che compongono il nostro portfolio systems Galaxy ed il riassunto MTM dell’operatività dal Novembre 2009. Galaxy chiude con un ottimo risultato anche il mese di Aprile, dopo un equivalente risultato nel mese di Gennaio e Febbraio, portando a 29.59 % la performance del 2011. Quello appena chiuso è il settimo risultato utile consecutivo a livello mensile dopo la breve pausa alla fine dell’estate dello scorso anno. L’equity continua a svilupparsi in maniera armonica mantenendo un’inclinazione positiva e costante grazie all’elevata diversificazione all’interno del portfolio. I risultati storici di Galaxy Portfolio System sono disponibili ai seguenti link: http://www.box.net/shared/static/nz7u0ztnbp.xls, http://box.net/shared/b9cg6kfa6s. I risultati dei singoli trading systems sono a disposizione al seguente link: http://www.box.net/shared/5vajnzc4cp.

Richiedi la demo gratuita di 30 giorni di Galaxy Combined Portfolio Systems 

In the table below you can see the monthly equity line of the trading systems that make our Galaxy portfolio systems and the MTM performance summary since November 2009. Galaxy ends with a good result also the month of April, after a similar result in the month of January and February, bringing the performance to 29.59 % in 2011. One just closed is the seventh consecutive positive months after the brief pause at the end of the summer last year. The equity continues to grow in harmony while maintaining an upward slope and steady thanks to high diversification within the portfolio. Historical results of Galaxy Combined Portfolio System are available at the following links: http://www.box.net/shared/static/nz7u0ztnbp.xls, http://box.net/shared/b9cg6kfa6s. Historical results of single trading systems are available at the following link: http://www.box.net/shared/5vajnzc4cp.

Request a free demo of 30 days of Galaxy Combined Porolio Systems
 

Galaxy Risultati Aprile


Equity Line Trades, Giornaliera e Mensile di Galaxy / Trades, Daily and Monthly Galaxy Equity Line                                 Free Demo Available
Galaxy Trades Galaxy Time Galaxy Mensile Galaxy Demo2


Performance MTM Mensile di Galaxy Portfolio System con un capitale iniziale di $ 200.000
Monthly MTM Performance of Galaxy Combined Portfolio System with $ 200K initial capital

  Jan
  Feb
Mar
Apr 
May
Jun 
Jul  
Aug
Sep
Oct 
Nov 
Dec 
2009
1.19 %
2.90 %
2010
(4.28 %)
24.49 %
2.99 %
1.76 %
15.62 %
4.35 %
10.60 %
(0.41 %)
(4.73 %)
1.75 %
12.80 %
1.50 %
2011
7.54 %
7.75 %
8.06 %
6.23 %

Galaxy Risultati Mensili image

Your diversification strategy is working correctly?
The diversification is a management technique that mixes a wide variety of investments within a portfolio. The main benefit of adding managed futures to a balanced portfolio is the potential to decrease portfolio volatility. Risk reduction is possible because managed futures can trade across a wide range of global markets that have virtually no long-term correlation to most traditional asset classes. Moreover, managed futures funds generally perform well during adverse economic or market conditions for stocks and bonds, thereby providing excellent downside protection in most portfolios.

The diversification between assets
The diversification between assets that have low correlation between them improves the overall performance of our investments for the same risk, thus reducing our exposure to risk decreases as the so-called "specified risk" linked to a single class of financial products. Basically, if you only held the shares, the result of your trading / investment is overly tied to the fortunes of a particular financial instrument for which you are running too high a risk. A well-diversified portfolio asset class is one of the major components that create the optimal portfolio. Read "The Art Of Asset Allocation" and "Top 10 Rules Of Portfolio Diversification".

The diversification within an asset
Concentrating investments in individual products or securities, you are exposed to a type of risk that can not be controlled, and the risk becomes uncertainty, which is something that is incalculable. is possible, even in this case, reduce the specific risks by trading or investing, for example, not a single product but a basket of products that represents a very large share of the market. Read "The Art Of Asset Allocation" and "Top 10 Rules Of Portfolio Diversification".

The diversification of trading methods
It combines the use of different methods of trading not correlated to improve the relationship between profit and maximum loss. The low correlation between different methods tends to reduce overall losses due to the combined performance of two or more trading systems. It is therefore one of the most effective ways to improve the performance of our investments while reducing risk. Read "The Art Of Asset Allocation" and "Top 10 Rules Of Portfolio Diversification".

The diversification of the trading system parameters
Is to use, within the same trading system, of different sets of parameters. Assuming that a trading account manage an adequate capital for diversification, it is better to diversify sets of parameters rather than making multiple contracts with the same set of parameters. The diversification of the set of parameters helps to minimize risk and strengthen our ability to remain disciplined and consistent psychological application of the trading system. Read "The Art Of Asset Allocation" and "Top 10 Rules Of Portfolio Diversification"

TOGETHER TO WIN: GALAXY PORTFOLIO SYSTEMS
Our goal is to generates significant medium term capital growth independent of stock and bond markets with simple and strict risk trading rules with maximum possible diversification. All our Portfolio Systems are designed assembled and managed with this philosophy. Due to the high diversification that characterizes them, our Portfolio Systems enhance the positive synergies of individual Trading Systems which are composed and dramatically reduce the overall risk. Diversification remains the cornerstone of modern portfolio theory.  Yet, during the financial crisis many "diversifying” investments readily followed the direction of the equity markets as they collapsed in 2008 and 2009. By contrast, our Portfolio Systems have just obtained their best resultsin 2008 thanks to the volatility of the period, the high diversification and the construction model that makes them independent of market equity and bond.


Material in this post does not constitute investment advice or a recommendation and do not constitute solicitation to public savings. Operate with any financial instrument is safe, even higher if working on derivatives. Be sure to operate only with capital that you can lose. Past performance of the methods described on this blog do not constitute any guarantee for future earnings. The reader should be held responsible for the risks of their investments and for making use of the information contained in the pages of this blog. Trading Weeks should not be considered in any way responsible for any financial losses suffered by the user of the information contained on this blog.

'Silver can go as low as $34'

By Jason Hamlin

The big question now becomes “How Low Can Silver Go?” The fundamental situation… supply shortages, surging investment demand and central bank buying, sustained record low interest rates, out-of-control spending, record deficits, debts and the U.S. dollar falling off a cliff, all seem to suggest that the correction will be short-lived. None of these situations have materially improved in the past week and I don’t see any of them miraculously turning the corner anytime soon.

The FED might slowly raise rates later this year, but they would have to rise to above the true inflation rate to have any serious impact on gold and silver. Neither political party seems serious about addressing the budget crisis or reducing our bloated military budget. They continue to bicker about cutting a few million here or there from NPR or Planned Parenthood for ideological reasons. Whether they cut $30 Billion or $38 Billion, it is still just a fraction of our annual budget deficit of $1.5 Trillion.

Despite the strong fundamentals, silver technical chart shows plenty of room for more downside. Furthermore, the last bounce was not nearly as robust or convincing as previous ones. Silver fell through its 20-day moving average on Tuesday and the drop below $40 will test just how many weak hands are holding silver this time around.

If enough buyers emerge, $40 could hold, but any panic selling is likely to force the price down to support at the 50-day moving average of $38.67. I find it likely that this support will hold, but further down we see support at the $36 level, which was a zone of previous resistance and consolidation. Below that is the 100-day moving average of $34, which has not been breached since the Summer of 2010. I believe the likelihood of silver falling below this level and testing its 200-day moving average of $28 is less than 5%.

It is worth pointing out that both the RSI and MACD have yet to reach oversold territory, despite the 15% dip. They are likely to begin flashing oversold on a dip below the 50-day moving average of $38.67, which I believe is the lowest silver will go during this correction.

Remember that as difficult as it can be to stomach in the short term, these corrections are normal and healthy parts of any bull market. The medium and long-term picture is still intact and I remain convinced that we will see $1800 gold and $60+ silver by year end. We are nowhere near a top or end of this bull market as some analysts and reporters are shouting.

Silver has posted an incredible first four months of the year, appreciating by over 60%! But we all know the adage that nothing goes up forever and silver proved it true by finally hitting a wall and correcting by 15% in just three days. The metal continued declining this morning and just tested the psychologically important $40 level.

This correction has been blamed on the COMEX margin increases, reclassification of delivery-eligible silver, bank manipulation, Bin Laden’s death and a whole host of other factors. These certainly seemed to play some part, but I think the simpler explanation is good old-fashioned profit taking. Silver finally matched its all-time high and was nearing $50 after a parabolic-like move, so plenty of investors that bought in around $20 or less likely decided it was a good time to take some profits off the table.

The inflation-adjusted highs are still a significant distance away and the fundamental conditions that created the spike in 1980 are much worse today. Depending on which inflation statistics you want to use, gold still needs to climb to somewhere between $2,400 and $5,000 and silver needs to hit a minimum of $140 and could climb as high as $500 by some estimates. This short term correction will once again prove to be the same thing every other correction has been in the past ten years — a buying opportunity.

See the original article >>

Silver Sell Off

by Bespke Investment Grooup

It is hard to decide which is more noteworthy. Is it that the price of silver has declined nearly 20% in the last three trading days, or that even after this huge decline, silver is still trading above its 50-day moving average? 

Earlier today, we looked to see how silver has historically performed following similar large declines in the past. Subscribers wishing to view the report can click on the link below. If you are not yet a subscriber, sign up today for immediate access.


See the original article >>

S&P 500 Sitting on Support

by Bespoke Investment Group

The past few days have seen quite a few momentum stocks really take it on the chin, but the S&P 500 as a whole has held up relatively well given the three consecutive down days to start the week. As shown below, the technicals of the index haven't really been hit at all yet. The index remains in a nice short and long-term uptrend, and it tested and held key support today that formed from its February bull market highs.


See the original article >>

RETURNS IN DIFFERENT INFLATION ENVIRONMENTS

by Cullen Roche

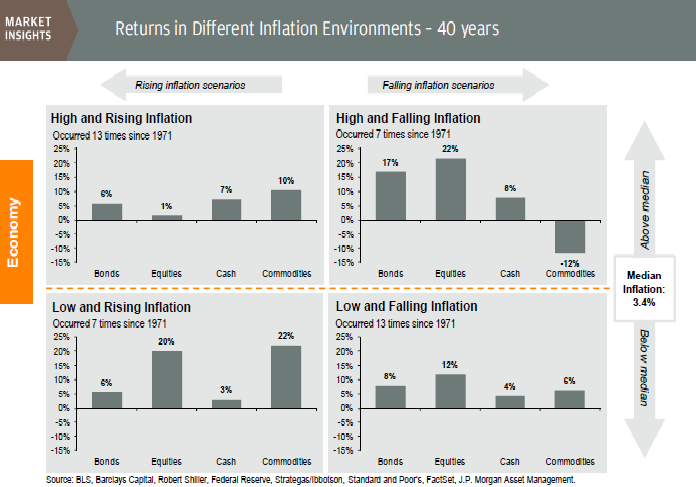
Mike Shedlock posted a useful chart showing market returns in different inflation environments (via JP Morgan). Shedlock is quick to note some flaws in the chart (primarily valuation), however, I think the chart offers a useful framework for various inflation environments regardless of its flaws (no indicator is perfect). 

Given the current inflation rate of 2.7% (and rising) we can conclude that the lower left hand quadrant is the current market environment. No wonder commodities and equities continue to outperform….


See the original article >>

Parabolic Moves are Only Temporary for Silver and Gold


The past few weeks we have been seeing the US Dollar slide to new lows at an increasing rate. The strong devaluation of the dollar has sent precious metals like silver and gold rocketing higher out of control sending them parabolic!

During the past 6 weeks both silver and gold have been rising in a parabolic formation. Meaning the price is going straight up with strong volume as everyone gets greedy and buys into the commodities at the same time. Most of you who follow my work already know that if the general public is piling into an investment rocketing prices higher, you better start focusing on tightening your protective stops and or taking some profits off the table before the price collapses.

Take a look at the weekly chart of Silver below:

Silver was grinding its way higher from July into March of this year. Only in the past 6-7 weeks did we start to see silver open up and run with expanding candles growing at an accelerated rate. This virtually straight up rally is a signature pattern and tells me that price action is now VERY unpredictable and anyone getting involved should be tightening their stops and or taking partial profits on price surges.

Parabolic moves can provide some big gains but most traders end of giving it all back and then some because the price can drop very abruptly as seen on this chart.
Silver1 stocks
The weekly chart of gold below shows much of the same thing but without the extreme volatility that silver has.
Gold2 stocks
Now, if you take a look at the US Dollar chart it’s starting to look very bullish in my opinion. The chart shows a falling wedge which typically means the selling pressure should be coming to an end soon. I’m not sure how large the bounce/rally will be. I do think a quick move to the 75 level is very likely in the near future though.

I find that metals tend to turn just before the dollar does. So I’m very cautious here on buying any stocks or commodities at the moment. The past 2 years we have seen stocks and commodities have an inverse relationship with the dollar so a rising dollar means a market pullback will take place. Sell in May and Go Away…?
Dollar3 stocks
Mid-Week Trading Conclusion:
In short, we exited our SP500 position this week for a nice 6% gain in a couple weeks making that our third profitable back to back index play. At this time I’m not ready to buy or short the market until all the charts line up for another low risk entry point. Things are 50/50 odds here and that’s not good enough for me.
See the original article >>

Pullback May Be Complete


If the [i] [ii] (i) (ii) count is correct, the pullback may have completed at today’s low. If not, then today’s low was likely wave a of (ii). One reason to believe that it may have ended is that the SP500 penetrated and closed above the February high on volume 5% less than the February high. The High Low Logic index has turned down and could issue a buy signal within the next two days.

 stocks
One thing is for sure. If today was the low of wave (ii), then we should see new highs in short order as the market should be in a 3rd of a 3rd wave. A hesitant move toward the May high would suggest that wave (ii) has more work to do.
See the original article >>

Follow Us