Friday, July 1, 2011

Commodity Bubble


Source:
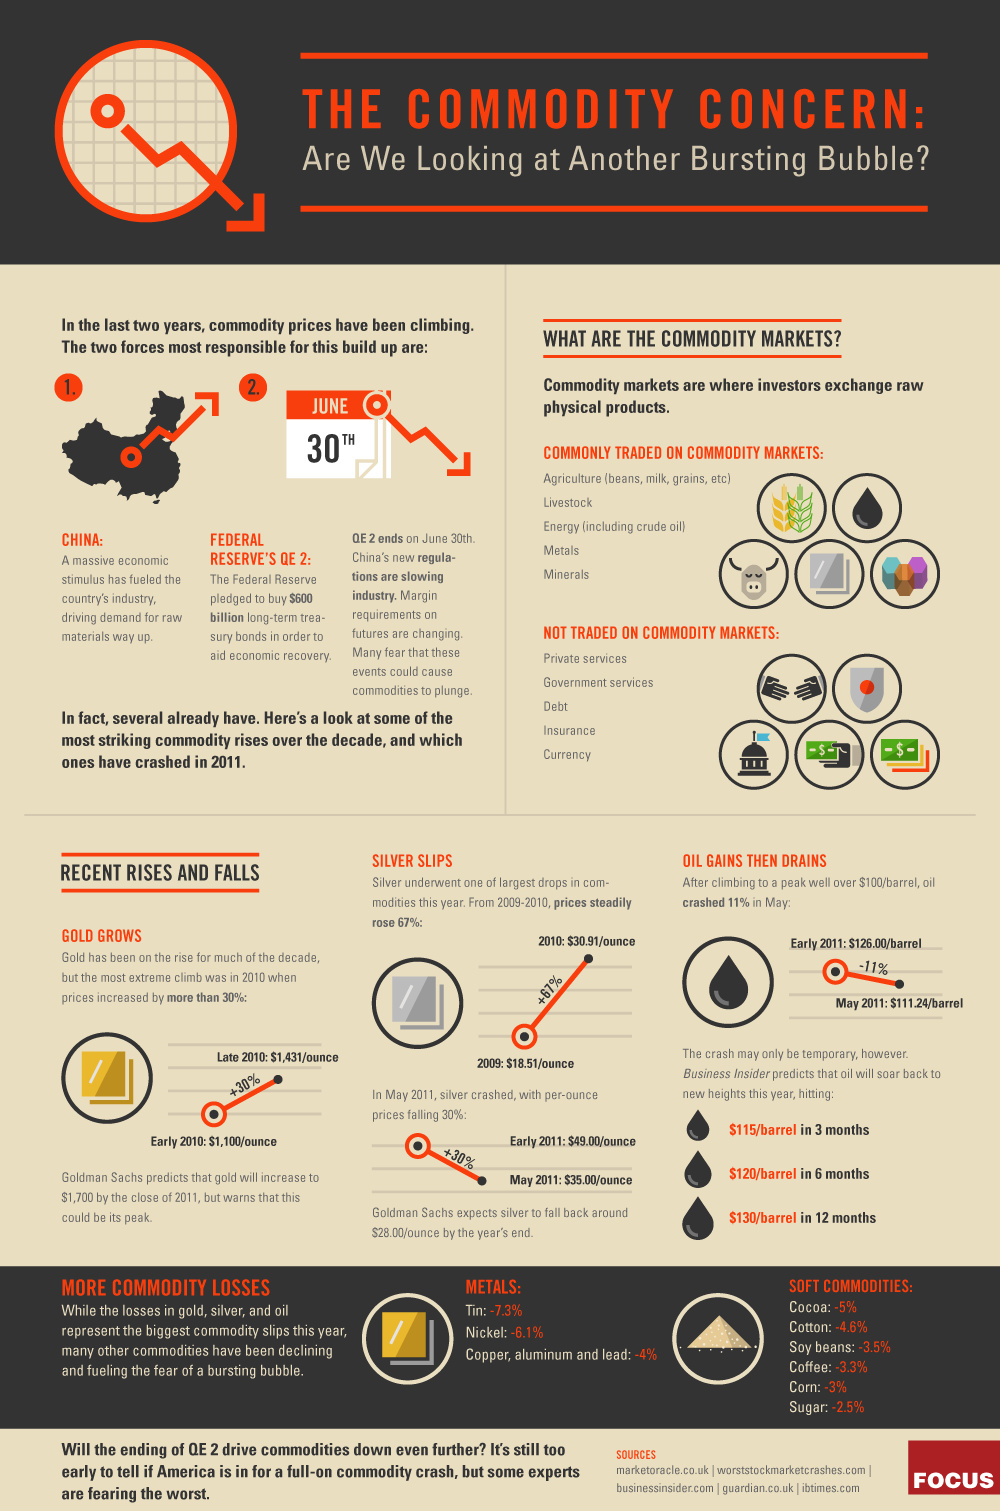
Focus.com, The Commodity Concern

Scepticism spreads over US estimate of ample corn

by Agrimoney.com

Investors continued on Friday to attack US crop data which signalled far more plentiful supplies of corn than had been expected, criticising the estimates as inconsistent and difficult to tally with other evidence.
Chicago corn futures, which initially tumbled 12% on the data, showed signs of stabilising on Friday, with the July lot recouping 1% in morning trade.
An estimate by the US Department of Agriculture that American corn stocks were nearly 370m bushels higher last month than investors had expected "just doesn't add up" in implying a halving in use by livestock feeders year on year, Rabobank analysts said.
"While some substitution by wheat in the feed ration may have taken place at the start of June, we expect it would have been very limited, and certainly not sufficient to support such a low corn usage number," the bank said.
Jon Michalscheck at Benson Quinn Commodities said: "In 2010, the USDA was also noted to have found 300m bushels of corn although the market saw it magically disappear later in the year. So possibly the same act will take place this year."
'Flooding ignored'
However, most of the attacks centred on an estimate that US farmers sowed 92.3m acres with corn this spring, 1.5m acres more than the market expected, and 1.6m acres above a USDA forecast issued earlier this month.
"Just where they have found these acres is the question on everyone's lips," Jaime Nolan at broker FCStone's Dublin office said.
"The figures released seem to ignore flooding and difficulties faced by farmers during the planting season," Agritel, the Paris-based consultancy, said.
In North Dakota alone, while farmers were estimated to have lost out on 2.3m acres of sowings of all crops, data earlier in the week implied losses of more than 6m acres, Rabobank said.
Harvest-time puzzle
Even if these acres do turn out to have been planted – an issue on which the market will get a better idea next month when the USDA releases the results of a resurvey – some analysts raised questions over how many would be harvested, given losses to the spring's heavy river flooding.
The USDA, which three weeks ago made a 400,000-acre allowance for floods in the Ohio and Mississippi and Missouri river valleys, on Thursday reduced by 0.4 points to 8.0% its estimate for the proportion of corn plantings not making it to harvest.
"Over the last decade, the US corn crop has had give where abandonment has been equal to, or greater than 9%," Australia & New Zealand Bank said.
"Given the weather events so far this season, a 9-10% abandonment for 2011-12 isn't out of the question."
Given that a 1% change in abandonment equates to a change of roughly 150m bushels in production, "a higher abandonment rate could easily wipe out the higher [corn] stocks gained from last night's report".
'No need to ration'
Thursday's estimates, at face value, imply a significant easing in the squeeze on US corn supplies, by enough to deal a huge blow to prices of the grain.
The data signal "carryout numbers for 2011-12 back over 1.0bn bushels, implying no need to ration any more", Mike Mawdsley at Market 1 said.
"Larger supplies means not much reason to rally unless weather takes a turn for the worse."
However, other questions that analysts have over the estimates include the apparent inconsistency of higher-than-expected stocks with tight physical market and export supplies.
Some have raised questions over wheat stocks proving larger than expected too, given that the grain should be proving in greater demand if farmers are switching away from high-priced corn.

Morning markets: grains regroup despite fresh data setback

by Agrimoney.com

Was that it?
Sure, Friday bought some further heavy casualties in Chicago. New crop December corn, for instance, the best-traded lot, was 32.75 cents, or 5.2% lower, at $5.89 ¾ a bushel at 07:30 GMT, (08:30 UK time).
But this loss could fairly be attributed to unfulfilled selling the last session, when the contract locked down the daily limit.
(That tumble came on official data showing that US farmers had sown far more corn had been thought, and that stocks left over from last year's harvest were far higher than had been thought.)
Indeed, in some respects, the December lot was doing a touch better early on than might have been expected, given that synthetic trading in the last session indicated that the exchange limit had left $0.37 a bushel in losses unfulfilled.
Price rises...
For contracts unrestrained by trading limits in the last session - notably Chicago's July contracts which, thanks to entering the expiry process, can range freely – further losses were limited.
Wheat for July fell 0.5% to $5.82 a bushel, while July corn added 0.3% to $6.31 a bushel.
And soybeans, which fared relatively well last time, recovered a lot of what they did lose, adding 1.0% to $13.19 ½ a bushel for July delivery, and 1.1% to $13.08 ¾ a bushel for the best-traded, new crop November contract.
But then soybeans came out OK from the US Department of Agriculture data.
Sure, USDA officials found more of the oilseed left over from the last harvest than had been expected. But sowings for this year's crop were pegged some 1.3m acres below expectations.
China worries
Soybeans' resilience was reflected in palm oil, its rival in the oilseed complex, too.
Sure, palm oil for September dipped to a fresh eight-month low of 3,035 ringgit a tonne in morning trade in Kuala Lumpur, getting its first chance to react to Thursday's plunges on western Exchanges.
But the benchmark contract pared losses to stand 0.6% lower at 3,054 ringgit a tonne. And, back in Chicago, rival soyoil for December was 0.3% higher at 55.88 cents a pound, recovering some lost ground.
And this despite some weak economic data from China, a big buyer of oilseeds and vegetable oils, where growth factory output last month was pegged at its lowest rate in more than two years.
An index formed through interviews with purchasing managers came in at 50.9, below the 52.0 recorded in May and expectations of a figure of 51.3 – besides getting near the 50.0 level below which indicates contraction.
Indeed, this survey depressed many other commodity markets, with copper losing ground in London, and both West Texas Intermediate and Brent crude dropping some 0.7%.
Bullish snippets
Can grains maintain resilience?
There are some factors in their favour, notably the scepticism with which analysts are treating the USDA data – and officials have said they will resurvey some states on acres, with results to be released next month.
Furthermore, there are some bullish snippets of news. Weekly export data, overshadowed by Thursday's acreage and stocks reports, showed US corn shipments topping 930,000 tonnes, at the top end of expectations.
"The export sales data should have been considered supportive as it was at a six-week high and confirmed that the recent break in the flat price has stimulated some fresh demand," Jon Michalscheck at Benson Quinn Commodities said.
Too much rain
And weather has turned less benign in some areas.
"In Argentina, excess rainfalls are hampering both corn harvests and wheat plantings. For the same reason, operators are concerned about wheat quality in Ukraine," Agritel, the Paris-based consultancy, said.
It looks like staying rainy in Ukraine too, where harvest has newly begun.
"The late day European weather model still shows a lot of rain coming for Eastern Europe, Belarus and the northern and eastern Ukraine over the next five days," WxRisk.com said.
"That huge persistent low that has lingered over the Ukraine is going to get reinforced by a new low this weekend. Poland, Belarus and the northern and eastern Ukraine will see 60% coverage of 1-2 inches of rain by July 4."
'Sell the rally mentality'
But will investors, and notably funds, take a bullish stance in live trading later, after liquidating 35,000 contracts of corn alone on Thursday?
Certainly, it is the first if the month, a time which often attracts new money.
However, there are plenty of doubts around that the selling is over.
"From a technical standpoint, the wheat markets are once again reaching oversold conditions, but I expect the trade to take on a 'sell the rally' mentality as the corn market searches for value," Brian Henry at Benson Quinn said.
At Market 1, Mike Mawdsley, terming the USDA data "game changers" indeed advised corn investors to "sell rallies until proven wrong".
"Bearish is the understatement. Larger supplies means not much reason to rally unless weather takes a turn for the worse."

See the original article >>

A Failed Global Recovery


The global economy is in the midst of its second growth scare in less than two years. Get used to it. In a post-crisis world, these are the footprints of a failed recovery.

The reason is simple. The typical business cycle has a natural cushioning mechanism that wards off unexpected blows. The deeper the downturn, the more powerful the snapback, and the greater the cumulative forces of self-sustaining revival. Vigorous V-shaped rebounds have a built-in resilience that allows them to shrug off shocks relatively easily.

But a post-crisis recovery is a very different animal. As Carmen Reinhart and Kenneth Rogoff have shown in their book This Time is Different, over the long sweep of history, post-crisis recoveries in output and employment tend to be decidedly subpar.

Such weak recoveries, by definition, lack the cushion of V-shaped rebounds. Consequently, external shocks quickly expose their vulnerability. If the shocks are sharp enough – and if they hit a weakened global economy that is approaching its “stall speed” of around 3% annual growth – the relapse could turn into the dreaded double-dip recession.

That is the risk today. There can be no mistaking the decidedly subpar character of the current global recovery. Superficially, the numbers look strong: world GDP rebounded by 5.1% in 2010, and is expected to rise another 4.3% in 2011, according to the International Monetary Fund. But because these gains follow the massive contraction that occurred during the Great Recession of 2008-2009, they are a far cry from the trajectory of a classic V-shaped recovery.

Indeed, if the IMF’s latest forecast proves correct, global GDP at the end of 2012 will still be about 2.2 percentage points below the level that would have been reached had the world remained on its longer-term 3.7% annual-growth path. Even if the global economy holds at a 4.3% cruise speed – a big “if,” in my view – it will remain below its trend-line potential for over eight years in a row, through 2015.

This protracted “global output gap” underscores the absence of a cushion in today’s world economy, as well as its heightened sensitivity to shocks. And there have certainly been numerous such blows in recent months – from Europe’s sovereign-debt crisis and Japan’s natural disasters to sharply higher oil prices and another setback in the US housing recovery.

While none of these shocks appears to have been severe enough to have derailed the current global recovery, the combined effect is worrisome, especially in a still-weakened post-crisis world.

Most pundits dismiss the possibility of a double-dip recession. Labeling the current slowdown a temporary “soft patch,” they pin their optimism on the inevitable rebound that follows any shock. For example, a boost is expected from Japan’s reconstruction and supply-chain resumption. Another assist may come from America’s recent move to tap its strategic petroleum reserves in an effort to push oil prices lower.

But in the aftermath of the worst crisis and recession of modern times – when shocks can push an already weakened global economy to its tipping point a lot faster than would be the case under a stronger growth scenario – the escape velocity of self-sustaining recovery is much harder to achieve. The soft patch may be closer to a quagmire.

This conclusion should not be lost on high-flying emerging-market economies, especially in Asia – currently the world’s fastest-growing region and the leader of what many now call a two-speed world. Yet with exports still close to a record 45% of pan-regional GDP, Asia can hardly afford to take external shocks lightly – especially if they hit an already weakened baseline growth trajectory in the post-crisis developed world. The recent slowdown in Chinese industrial activity underscores this very risk.

Policymakers are ill prepared to cope with a steady stream of growth scares. They continue to favor strategies that are better suited to combating crisis than to promoting post-crisis healing.

That is certainly true of the United States. While the US Federal Reserve Board’s first round of quantitative easing was effective in ending a wrenching crisis, the second round has done little to sustain meaningful recovery in the labor market and the real economy. America’s zombie consumers need to repair their damaged balance sheets, and US workers need to align new skills with new jobs. Open-ended liquidity injections accomplish neither.

European authorities are caught up in a similar mindset. Mistaking a solvency problem for a liquidity shortfall, Europe has become hooked on the drip feed of bailouts. However, this works only if countries like Greece grow their way out of a debt trap or abrogate their deeply entrenched social contracts. The odds on either are exceedingly poor.

The likelihood of recurring growth scares for the next several years implies little hope for new and creative approaches to post-crisis monetary and fiscal policies. Driven by short-term electoral horizons, policymakers repeatedly seek a quick fix – another bailout or one more liquidity injection. Yet, in the aftermath of a balance-sheet recession in the US, and in the midst of a debt trap in Europe, that approach is doomed to failure.

Liquidity injections and bailouts serve only one purpose – to buy time. Yet time is not the answer for economies desperately in need of the structural repairs of fiscal consolidation, private-sector deleveraging, labor-market reforms, or improved competitiveness. Nor does time cushion anemic post-crisis recoveries from the inevitable next shock.

It’s hard to know when the next shock will hit, or what form it will take; otherwise, it wouldn’t be a shock. But, as night follows day, such a disruption is inevitable. With policymakers reluctant to focus on the imperatives of structural healing, the result will be yet another growth scare – or worse. A failed recovery underscores the risks of an increasingly treacherous endgame in today’s post-crisis world.
Stephen S. Roach, a member of the faculty at Yale University, is Non-Executive Chairman of Morgan Stanley Asia and the author of The Next Asia.

Silver looks vulnerable ...

by Kimble Charting Solutions


Ethanol Tax Credit: Economics vs. Politics

".....the Senate voted 73-27 in favor of repealing a $6 billion tax credit for ethanol producers. The measure would end a 45-cent-per-gallon tax credit for ethanol refiners and a tariff of 54 cents per gallon on imported ethanol. The bill’s passage may be a pleasant surprise — ethanol is, after all, not so great for the environment. But which senators voted in favor of the tax credits is all too predictable."

From the WSJ, "Ethanol Suffers Rare Loss in Senate":

"A broad bipartisan majority of the Senate voted ...to end more than three decades of federal subsidies for ethanol, signaling that other long-sacrosanct programs could be at risk as Democrats and Republicans negotiate a sweeping deficit-reduction deal. The tax breaks, which now cost about $6 billion a year, had long been considered untouchable politically because of the power of farm-state voters and lawmakers. Iowa's role as the site of the first presidential caucuses has further elevated the political potency of the biofuel.
Presidential hopefuls made a quadrennial ritual of going to Iowa and pledging to support the tax breaks, tariffs and mandates that supported production of ethanol motor fuels from corn. This year, however, some Republican presidential candidates have pointedly refused to endorse ethanol tax breaks. Thursday's vote doesn't by itself doom federal support for the corn ethanol industry. The House is expected to reject the repeal as unconstitutional because tax bills must originate in that chamber, and the White House opposes it. But the 73-27 vote signals that once-unassailable programs could be vulnerable."

(Chart Below from WSJ.com Added by EconMatters)

Chart Source: WSJ.com (added by EconMatters)

Paul Gigot of the WSJ pointed out a decade ago that "ethanol is produced by mixing corn with our tax dollars." Hopefully, given the reality of our worsening fiscal situation, the Senate vote today signals that taxpayer funding of ethanol will eventually end, and ethanol will have to survive on its economic and scientific merits. Simply put, without tax dollars, the current political-motivated recipe for producing so much corn ethanol is doomed

Italy Back In Spotlight After S&P Says One In Three Chance It Will Cut Ratings In Next 24 Months


From S&P, which explains why Italian banks have dominated Sigma X trading in the last few days:
Despite Announced Austerity Measures, Italy Still Faces Substantial Risks To Debt Reduction
  • The Italian government has introduced additional fiscal measures for 2011-2014.
  • Italy's weak growth outlook remains the key downside risk to the government's debt reduction plan.
LONDON (Standard & Poor's) July 1, 2011--Yesterday, the Italian government introduced additional fiscal austerity measures that aim to reduce the general government deficit by €47 billion (3% of 2011 GDP) by 2014. Despite these measures, however, we believe substantial downside risks to the government's debt-reduction plan remain, primarily due to Italy's weak growth prospects.

Several of the announced measures, in our view, could indirectly benefit Italian competitiveness: in particular, cuts to higher-bracket public sector wages and the planned rationalization of Italy's complex system of tax deductions. If implemented, adjusting the retirement age in 2014 rather than in 2015 as originally planned would reinforce our opinion that Italy's age-related contingent liabilities are among the lowest in Europe. We also view the agreement between the employers' confederation and Italy's three main labor unions to decentralize wage-setting as an important first step toward promoting wage flexibility.

Nevertheless, in light of Italy's weak growth (per capita GDP growth averaged minus 0.9% between 2005 and 2011) it is our opinion that far more substantial microeconomic and macroeconomic reforms will be required to incentivize private investment and match wage levels with productivity. Without such measures, we believe Italy's economic potential will not be realized. This will imply insufficient wealth creation to deliver meaningful declines in the general government's debt-to-GDP ratio, which was a high 119% at end-2010. As a consequence, we continue to hold the view that there is an approximately one-in-three likelihood that the ratings on Italy could be lowered within the next 24 months, as reflected in our negative outlook.

On the fiscal package itself, we view the latest austerity plans as generally credible, particularly the measures that aim to contain the public sector wage bill and pension spending. We believe, however, that the government could be overly optimistic about how effective its fight against tax evasion will be. We anticipate the government will likely retain its tight fiscal stance and will respond to potential future fiscal slippage with additional measures. The government has also introduced a tax reform package, which includes the simplification of personal income, service, and transaction taxes, while raising VAT by one percentage point.

The negative outlook on Italy reflects Standard & Poor's view of certain downside risks to the government's debt-reduction plan over 2011-2014, and represents our belief that there is approximately a one-in-three likelihood that the ratings could be lowered within the next 24 months. In our view, these downside risks will primarily stem from weaker growth than our current assumption of average GDP growth of 1.3% during 2011-2014. In addition, we believe that extended political gridlock could contribute to fiscal slippage.
If one or a combination of these risks materializes, Italy's general government debt burden could stagnate at the current high level. In this case, we may lower the long- and short-term ratings on Italy. On the other hand, if the government manages to gather political support for the implementation of competitiveness-enhancing structural reforms, paving the way for higher economic growth and faster reduction of its debt burden, the ratings could remain at the current level.

See the original article >>

Where is that Recovery?


After the last week’s good “window dressing” equities performance, it is time to reconsider some facts on the Economy. Our short term targets in SPX have been reached, since bouncing off the 200 day moving average. We should start hitting some resistance levels shortly (1320). The dull summer months might even provide some kind of consolidation/trading range, where volatilities come off, and present a nice set up for the autumn collapse we think will happen. More Technical Charts Updates over the weekend.

What about that Recovery though? The Economy is still not showing overly positive tones. Many Indicators are on the contrary falling, and people feel worse off. Despite the manipulators printing SPX higher as the QE2 ends, one should recheck some indicators below. Gallup reports below;

After surging in May, Americans’ economic confidence receded in early June and remains near its 2011 low, averaging -33 in the week ending June 26. This is down seven percentage points from the week ending May 29 and down a similar amount compared with the same week a year ago.
Economic Confidence Index by Week, 2010 and 2011
U.S. economic confidence peaked this year at -18 in February and then generally declined, reaching -39 during week ending April 24, as gas prices surged and economic activity slowed. Confidence increased in May, averaging -26, likely in response to the news of Osama bin Laden’s death in a U.S. military raid.

Gallup’s Economic Confidence Index combines two measures: one assessing Americans’ views about whether the U.S. economy is “getting better” or “getting worse,” and the second involving Americans’ ratings of current economic conditions as “excellent,” “good,” “only fair,” or “poor.” Both ratings have deteriorated thus far in June.

Fewer Americans See Economy “Getting Better”

In the most recent week, 31% of Americans said the U.S. economy is getting better — on par with what Gallup has measured throughout June, but down from 37% weekly readings during most of May. The latest reading is also down from 36% during the same week in 2010.
Percentage Saying Economic Conditions Are Getting Better by Week, 2010 and 2011
More Americans Rate the Economy “Poor”

Forty-five percent of Americans rated current economic conditions “poor” in the week ending June 26 — three points worse than the 42% readings during the week ending May 29 and a year ago. June’s “poor” ratings are at or near their highest levels of 2011.
Percentage Saying Current Economic Conditions Are Poor, by Week, 2010 and 2011
Implications

The worsening of Gallup’s economic confidence measure during June may be due in part to the dissipation of the “halo effect” surrounding the death of bin Laden. Confidence has now moved back near the April 2011 low. This suggests that the consumer benefits associated with steadily declining gas prices at the pump — down 14 cents per gallon in the past two weeks — are being offset by other factors. One such factor might just be that gas prices remain 82 cents per gallon higher than they were a year ago. Another could be the continuing dismal jobs situation.

Federal Reserve Board Chairman Ben Bernanke last week seemed to add to the growing economic pessimism, noting that the Fed has reduced its 2011 growth forecast for the U.S. economy. Wall Street continues to suffer as a result of the Fed’s apparent confirmation of the economic “soft patch” and the financial problems in Europe. The battle over raising the debt ceiling has not disrupted the money markets to this point, but certainly represents another negative for overall economic confidence.

It may be that declining gas prices will eventually lead to improved consumer confidence and increased consumer spending, which could make the current economic soft patch modest and transitory. At this point, however, Gallup’s monitoring of economic confidence does not support that idea.

And some more Important Charts below. All trends loosing steam, and are soon turning lower. That is NOT a strong recovery. Charts from Stratfor;


Recession Warning Flags Flying Again!


The United States emerged from a grueling 18-month recession just two short years ago, according to the business cycle arbiters at the National Bureau of Economic Research. Yet for many Americans, the “recovery” felt like anything but a rebound. And now, it looks like it’s already coming to an end.
Just consider what we’ve learned in the past few days …

* Personal spending went nowhere in May! That missed the forecast for a gain of 0.1 percent, and it was the worst reading in 10 months. Moreover, the gains stemmed from higher prices not strong underlying demand. Inflation-adjusted spending shrank 0.1 percent, the second monthly decline in a row!

* The Dallas Fed’s latest manufacturing gauge imploded! It fell to -17.5 from -7.4. That was the worst reading in 11 months. It’s not an isolated disappointment, either. The New York and Philadelphia indices also tanked, and the overall plunge we’ve seen in these up-to-date manufacturing surveys over the past couple of months is one of the worst on record!

* Housing keeps sinking like a stone! New home sales fell another 2.1 percent in May, while existing home sales dropped 3.8 percent. Home prices, according to S&P/Case-Shiller, dropped 4 percent from a year ago in April. That was the biggest annual drop in 17 months, and it leaves prices at their lowest level since eight summers ago.

* Consumer confidence is tanking! The Conference Board’s consumer confidence index slumped again to 58.5 in June from 61.7 in May. Not only did that miss economist forecasts, it was also the worst reading in seven months. 

What might we see next? What are the ramifications for stocks? Bonds? Currencies? Let’s take a look …

Why the Second Recession in as
Many Years May Be Looming

How could we possibly be in this dismal situation? Weren’t we told several times over the past couple of years that brighter times were ahead?


Sure, we were. By politicians in Washington. And you probably know the old joke: “How can you tell a politician is lying? His lips are moving!”

The fact is, we didn’t lay the groundwork for a healthy recovery. We didn’t allow the debt destruction that had to take place, proceed. Instead, we tried to bail out and backstop everybody and his sister in order to make things less painful. That means that even now, we’re still too buried in debt to fund a healthy, long-lasting rebound. 

As The Wall Street Journal reported on Monday …
“The Federal Reserve is just days away from ending one of the major steps to aid the U.S. economy — but the effort has done little to solve the original problem: The government and individuals alike are still heavily in debt.”
The Journal goes on to make the same argument I’ve laid out for you:
“The fundamental problem is that reversing the trend of piling on the debt requires some combination of cutting spending, growing income or the economy, and inflation. But wage growth is stagnant and home prices, which underpin much of the debt problem, are still falling.
“Meanwhile, in a vicious circle, businesses aren’t hiring or investing because they know consumers are tapped out. Banks, for their part, are hoarding cash, being stingy with new loans.”
The amazing thing is that policymakers at the Fed and Treasury don’t seem to understand this fact — even as it’s been obvious to me for the past couple of years! Ben Bernanke himself admitted in his most recent press conference that …
“We don’t have a precise read on why this slower pace of growth is persisting … Some of the headwinds that have been concerning us, like the weakness in the financial sector, problems in the housing sector, balance sheet and deleveraging issues, may be stronger and more persistent than we thought.”
That sure is encouraging, eh? It just goes to show you that if you’re counting on the Fed to get things right, good luck! They got the dot-com bubble wrong. They got the housing bubble wrong. And their plan to underwrite an economy recovery has proven to be the wrong medicine for what ails us.

Practical, Real-World Ways
to Protect Your Wealth!

My simple advice: Stop listening to the happy talk coming out of Washington. Take steps immediately to protect your wealth from a looming recession!

One of my favorite vehicles is inverse ETFs — exchange traded funds that rise in value as sectors of the stock market fall. In the first phase of the recession, sectors like real estate and financials got crushed … driving the value of select inverse ETFs through the roof.


See the original article >>

Why Seasonal Trades Are the Solution to Market Volatility

By Larry D. Spears

Given all the volatility in the markets of late it might be time to try something with a high probability - though not a guarantee - of paying off.

I'm talking about "seasonal trades."

Seasonal trades are moves you can make in the futures markets, or now via exchange-traded funds (ETFs), that have a history of producing a profit.

Let me explain.

Seasonal trade opportunities arise from patterns that occur at specific times of the year. They are most apparent in the agricultural sector, where changing weather patterns have an impact on prices.

For example, one such seasonal trade - a bullish October sugar play that has posted a perfect record over the past 15 years, producing an average profit of $1,035 per futures contract in seven weeks or less - launched in mid-June.

That particular trade is keyed to the June conclusion of the sugar harvest in Mexico, the last of the year in the Northern Hemisphere. After that, existing stocks of sugar start to decline and prices are subject to weather scares that could disrupt Southern Hemisphere harvests and new-crop growth in the North. As a result, sugar prices typically tend to rise from mid-June through late July.

Opportunities for seasonal trades are by no means limited to agricultural products. They occur in almost every futures market, including petroleum products, precious metals, stock indexes, and currencies. Often, the reasons underlying these price patterns are obscure, particularly in some of the financial markets, but the reasons aren't nearly as important as the fact that the patterns repeat - and do so consistently year after year.

Moore Research Center Inc. (MRCI), a leading commodity markets statistical firm, tracks more than 250 seasonal trades each year (along with a similar number of intra- and inter-commodity spreads), advising subscribers on the top 15 positions that can be entered each month. To qualify for listing, a trade must have been profitable at least 80% of the time over the prior 15 years - although most, like the sugar trade cited above, have even stronger records.

Similar records and recommendations are provided by SeasonalTrader.com, which follows a wide array of what it calls High Odds Seasonal Trades (HOSTs) and tracks records as far back as the 1960s and 1970s.

There's no question that seasonal commodity price patterns exist - and they can offer major profit opportunities to knowledgeable traders in the futures markets.

But what if you can't afford the large margin deposits required to trade many commodities, don't have a futures trading account, or simply aren't comfortable with the high risks that go along with playing these markets? Is there a way you can get in on the seasonal action?

Up until a few years ago, the answer was usually "no." The only alternative to futures for making such plays was with equally risky and highly leveraged commodity options. However, thanks to the recent introduction of so-called "pure play" ETFs, it's now possible to make seasonal commodity trades in the comfort of your stock brokerage account, with no more cost or risk than you'd have with any purchase of regular common shares.

ETFs and Seasonal Trades

Although the ETFs don't yet have the long-term track record of the commodities on which they're based, their short-term performance seems to indicate they track the seasonal price moves in the underlying futures fairly closely.

Let's look at a petroleum-complex seasonal trade that calls for entry in late July - meaning there's still time to play it.

According to Moore Research, the price of the September crude oil (CL) contract traded on the NYMEX (New York Mercantile Exchange) division of the CME Group has risen from around July 23 until early August in 14 of the past 15 years (a 93% success rate), producing an average profit per trade of $1,278 per contract.

The rationale for this trade is that gasoline consumption hits its highest level in August when driving conditions are best and many families vacation prior to the start of school. Preparation for this demand increase leads to a drawdown in refinery crude stocks, which must be replenished prior to an even sharper rise in demand for heating oil that comes in the fall. Thus, refiners tend to buy more crude during this period, sending prices higher.

As proof of that, prices for September crude oil futures rose from $67.16 a barrel to $69.45 a barrel in late July 2009, and from $78.96 to $81.34 in late July 2010, gaining $2.29 a barrel and $2.36 a barrel, respectively. Since each futures contract represents 1,000 barrels, that equated to respective profits of $2,290 and $2,360 per contract - in roughly 12 days.

Had you chosen to play that seasonal trade with an ETF, the best choice would likely have been the United States Oil Fund LP (NYSE: USO), recent price $35.36. (Note: There are currently five other crude-linked ETFs offering both long and short exposure to oil, as well as 200% leverage in both directions.)

In 2009, you could have anticipated the seasonal move by entering on July 22 at a price of $34.01 per share - and you would have been quickly rewarded. USO prices rose steadily for two weeks, peaking at $38.27 on August 6. Had you closed the next morning on the assumption the seasonal trade had run its course, you could have sold at $38.15, scoring a gain of $4.14 per share, or $414 per 100-share lot. Had you bought 1,000 shares to mirror the size of the 1,000-barrel futures contract, your gain would have been $4,140 - even better than the profit scored by the futures traders.

An almost identical scenario played out in 2010, when prices for the USO fund closely tracked futures prices, climbing from $34.20 on July 21 to $36.91 on August 3, good for an 8% profit in just 14 days - or $2,710 on a 1,000-share position.

Obviously, with Moore Research suggesting 15 seasonal trades per month, all having an 80% success rate or higher, we could cite numerous other examples - but we won't. Rather we'll just note that seasonal moves - either up or down - in July are projected for commodities such as sugar, cocoa, heating oil and natural gas, corn, soybean meal, oil, and silver. Other seasonal trades involving currencies include the Canadian dollar, British pound, Japanese yen, and 30-year U.S. Treasury bonds, among others.

ETFs aren't available on all of those commodities and financial instruments, but they are on many.

Be aware, however, that you should never rely solely on past seasonal tendencies when initiating a new trade - whether with futures or ETFs. Even when you're dealing with a strategy that's worked 80% to 90% of the time for a decade or two, it's a bad idea to just blindly do a trade without knowing what's going on in the world. So, always review both the individual markets and the overall economic situation and other "macro" factors that could impact your trade before placing your order.

Remember, too, that speculative emotion can strongly impact all of the markets on which futures trade - so always use sound money-management techniques and employ protective stops when doing any seasonal strategy.

See the original article >>

The Coming Bond Market Crash: The Three Moves Every Investor Must Make

By Martin Hutchinson

Since last November, the U.S. Federal Reserve has been buying U.S. Treasury bonds at a rate of about $75 billion a month. That's part of Fed Chairman Ben S. Bernanke's "QE2" program, under which the central bank was to buy $600 billion of the government bonds.

But QE2 ended yesterday (Thursday), meaning the Fed will no longer be a big buyer of Treasury bonds.

So starting today (Friday), the U.S. Treasury needs to sell twice as many Treasury bonds to end investors as it had been.

But the problem is, who's going to buy them?

Not China, which is diversifying its trillions in assets to get as far away from the U.S. dollar as fast as it can.

Not Japan, which is trying to rebound from its March 11 earthquake, tsunami and nuclear disaster - and is focusing all its spending on reconstruction.

And - as we've seen -neither is the Bernanke-led Fed.

I'm telling you right now: We are headed for an epic bond market crash. If you don't know about it, or don't care, you could get clobbered.

But if you do know, and are willing to take steps now, you can easily protect yourself - and even turn a nice profit in the process.

Let me explain ...

A Timetable for the Coming Crash

I'm an old bond-market hand myself - my experience dates back to my days at the British merchant bank Hill Samuel in the 1970s - so I see all the signs of what's to come.

Having the two biggest external customers of U.S. debt largely out of the market is a huge problem. Unfortunately, those aren't the only challenges the market faces. The challenges just get bigger from there - which is why I'm predicting a bond market crash.

Steadily rising inflation is one of the challenges. Inflation is a huge threat to the bond markets, and is almost certain to create a whipping turbulence that will ultimately infect the stocks markets, too.

Many pundits will tell you that if investor demand for bonds declines, and investor fear of inflation increases, bond-market yields could increase in an orderly fashion.

But I can tell you that the bond markets don't work like that. Price declines affect existing bonds as well as new ones, so the value of every investor's bond holdings declines. And with many of those investors heavily leveraged - especially at the major international banks - the sight of year-end bonuses disappearing down the Swanee River as bonds are "marked to market" will cause a panic. That's especially true when end-of-quarter or end-of-year reporting periods loom.

That's why we can expect a bond market crash at some point. If you ask me to make a prediction, I'd say that September or December were the most likely months for such a crash.

A Boxed-In Bernanke

One sad - even scary - fact about what I'm predicting is that Fed Chairman Bernanke won't be able to do much about it ... though he'll certain try.

Consumer price inflation is now running at 3.6% year-on-year while producer price inflation is running at 7.2%. In that kind of environment, a 10-year Treasury bond yielding 3% is no longer economically attractive. Since monetary conditions worldwide remain very loose, inflation in the U.S. and worldwide will trend up, not down.

The bottom line: At some point, the "value proposition" offered to Treasury bond investors will become impossibly unattractive. When that happens, expect a rush to the exits.

If Bernanke attempts "QE3" - a third round of "quantitative easing" - he will have a problem. If other investors head for the exits, Bernanke may find that the U.S. central bank is as jammed up as the European Central Bank (ECB) currently is with Greek debt: Both will end up as the suckers that are taking all the rubbish off of everyone else's books.

There's a limit to how much Treasury paper even Bernanke thinks he can buy. And if everyone else is selling, that "limit" won't be high enough to save the bond market.

With Bernanke buying at a rapid rate, the inflationary forces will be even stronger, so every Bureau of Labor Statistics report on monthly price indices will be marked by a massive swoon in the Treasury bond market.

Eventually, there has to be a new head of the Fed - a Paul A. Volcker 2.0 who is truly committed to conquering inflation. Alas, it won't be Volcker himself since, at 84, he is probably too old.

But it might be John B. Taylor, who invented the "Taylor Rule" for Fed policy. The Taylor Rule is actually a pretty soggy guide on running a monetary system. But it has been flashing bright red signals about the current Fed's monetary policy since 2008.

However, since a Fed chairman who is actually serious about fighting inflation would be a huge burden for current U.S. President Barack Obama to bear - and could badly hamper his chances for re-election, any such appointment is unlikely before November 2012.

How to Profit From the Bond Market Crash

Given that reality, it's likely that Bernanke will attack any bond market crash that occurs ahead of the presidential election just by printing more money; there won't be any serious attempt to rectify the fundamental problem, meaning inflation will continue to accelerate.

For you as an investor, this insight leads to two conclusions that you can put to work to your advantage. The scenario I've outlined for you will be:

Very good for gold and other hard assets. Challenging for Treasury bonds; prices will remain weak no matter how vigorously Bernanke attempts to support them.

So what should you do with this knowledge? I have three recommendations.

First and foremost, if Bernanke were not around, I would expect gold prices to fall following a bond market crash. But since he's still at the helm at the Fed, I expect him to do "QE3" in the event of a crash. And that means gold - not Treasury bonds - would become an investor "safe haven."

You can expect gold prices to zoom up, peaking at a much higher level around the time Bernanke is finally replaced. Silver will also follow this trend. So make sure you have substantial holdings of either physical gold and silver or the exchange-traded funds (ETFs) SPDR Gold Trust (NYSE: GLD) and iShares Silver Trust (NYSE: SLV).

Second, if you want to profit more directly from the collapse in Treasury bond prices, you could buy a "put" option on Treasury bond futures (TLT) on the Chicago Board Options Exchange (CBOE). The futures were recently trading around 94, and the January 2013 80 put (CBOE: TLT1319M80-E) was priced around $4.50, which seems an attractive combination of low price and high leverage.

Finally, if you don't already own a house, you should buy one - and do so with a fixed-rate mortgage. A U.S. Treasury bond market crash will send mortgage rates through the roof, so today's rates of about 4.8% will represent very cheap money, indeed. Even if house prices decline by 10%, a 2% rise in mortgage rates would increase the monthly payment (even accounting for a 10% smaller mortgage), by a net 11.8% (the payment on a $100,000 mortgage at 4.8% is $524.67; that on a $90,000 mortgage at 6.8% is $586.73).

Needless to say, the same benefits apply to rental properties financed by fixed-rate mortgages: With lower home ownership and rising inflation, rents are tending to rise significantly.

There's a storm coming in the Treasury bond market. But by recognizing its approach, we can turn the bond market crash to our advantage.

See the original article >>

Let me shoot!

by Flickr

flying kid
victoria spinning
Ruby Spinning, Take Two
I can fly!

Se non vi gira troppo la testa, potete trovare altri bambini che girano felici nella galleria You spin me right ‘round, baby di krmall. Foto di phitar, Mr Din, elladog e r.AI (-).

USDA Reports to Send Shock Waves through Corn Markets


Between this morning’s Acreage and Grain Stocks reports, the U.S. corn supply for the 2011-12 corn year is close to 0.5 billion bushels higher than the industry anticipated.

First, corn stocks in all positions as of June 1, 2011, totaled 3.67 billion bushels, down 15 percent from a year earlier. On-farm stocks at 1.68 billion bushels fell 21 percent from a year earlier, while off-farm stocks, at 1.99 billion bushels, are 9 percent lower. Grain stocks, however, were well above the average trade estimate of 3.3 billion bushels. “The big shocks are in the corn numbers,” says James Bower, Bower Trading, Lafayette, Ind.
 
Soybean stocks of 619 million bushels and wheat stocks of 861 million bushels were also well above expectations of 596 million bushels and 826 million bushels, respectively. “What that shows is that feed demand backed off this spring when prices were high, especially for cattle producers,” says Chad Hart, agricultural economist with Iowa State University. “Producers likely turned to unique alternative feed sources such as processed feed, byproducts, and bakery waste. They were searching for any alternative feed source.”
 
Projected corn acres of 92.3 million will also send shock waves through the market. Projected acreage is 5 percent stronger than last year and the second highest planted acreage since 1944, behind only 2007’s 93.5 million acres. Growers expect to harvest 84.9 million acres for grain, an increase of 4 percent from last year. The average trade estimate for corn acres was 90.8 million.
 
“I’m sure the report is a disappointment to corn bulls,” says Bower. “It shows us that in the Northern Hemisphere if the producer gets an opening, he or she has the horse power to make up (planting delays) in a big way.” According to the Acreage report, even with this year’s significant planting delays, U.S. producers planted 1.6 million more acres than they indicated in the March Prospective Plantings report.
 
“The markets will focus on the corn numbers, which are bearish,” says Bower. Without weather problems during the critical upcoming pollination period, which Bower expects to run from about July 11 to August 14 this year, December corn futures could fall to as low as $5.50 or $5.40, given today’s bearish numbers, he says.
 
“If you go through the report on a state-by-state basis, you can see the impact of (planting-season) weather on some states and how other states compensated for that,” says Hart. For instance, Illinois, Ohio, South Dakota, and North Dakota all lost acreage, while Iowa, Nebraska, and Minnesota gained acres.

The additional corn acres also came at the expense of soybean acreage. “Producers gave up beans and planted corn later than they normally would have in a more typical year,” Hart says. “Prices favored corn this spring and producers responded.” USDA pegged soybean planted acres at 75.2 million acres, down 3 percent from last year.
 
Yield will be a concern in many states moving forward, including Minnesota, North Dakota, and South Dakota, but other states like Iowa, where producers planted an additional 200,000 acres, and Nebraska could make up for yield losses elsewhere. “Minnesota corn got in, but it isn’t necessarily in the best condition,” says Hart, who will be revising his price forecast lower in the wake of today’s reports.
“The wildcard is the 500,000 added acres in Nebraska,” Hart says. “How much of it was planted in the (now-flooded) Missouri River valley?”

Have Farmers Lost Trust In USDA?


This morning’s acreage reports have farmers across the country scratching their heads, many losing faith in USDA’s accuracy.
 
The reports, developed from an early June survey, reveled the corn planted area for all purposes in 2011 is estimated at 92.3 million acres, up 5 percent from last year, and the second highest planted acreage in the United States since 1944, behind only the 93.5 million acres planted in 2007. In preparation for the reports, a discussion board thread was started on AGWEB.com early this morning.
 
"I just threw my rose colored glasses into the trash compactor. Just when I thought we might be able to start trusting USDA to get it right they throw us an out of the ball park corn acres number," wrote BinswOH, an avid AGWEB.com user. "92.3 million acres of corn planted? Are they using estimated seed sales and forgetting to back out the seed sold for replant? Or are they assuming they will make it up by lowering the average acre yield to 150? I have too many questions after reading the report this morning."
 
The USDA estimates corn acreage in Ohio and the Dakotas to have increased over last year as well. Many farmers across the country are wondering how this could be true.
 
"Maybe my eyes aren't working right but it looks like more acres than last year in Ohio and the Dakotas," wrote iaDave, corn farmer and discussion board enthusiast. "I just don't see how that can be from what I have heard."
 
The developing flood situation in the stacked northern states is far from over which is causing farmers disdain in regards to the accuracy of acreage numbers released by USDA for the Dakotas this morning.
"I'm pretty sure they are smoking their socks on the Dakota’s," Iowa55 says. "I was up there two and a half weeks ago and most of the acres that were planted just are not going to make anything in South Dakota. Not all acres were bad but 75 percent were hurt and 25 percent were as good as failed."
 
What crops have been planted are not likely to make decent yields because of the excess water that is destined to reach fields throughout North Dakota and South Dakota as the snow pack melts this summer.
While many farmers in Ohio planted more corn later than originally anticipated, growing a good crop in the region is hopeful at best.
 
"Many acres were planted just because of the crop insurance guarantees, with no real hopes of a harvest or proper fertilizer program," wrote one frequent user, Iowa55, concerning the Ohio crop. "But the acres will count in June, they just will never amount to much or be harvested."
 
Regardless of the perceived inaccuracies of the today’s reports the markets will react in line with the acreage and stock numbers released by the government agency.
 
"For today’s trade we are going to trade dramatically lower corn is 40 to 50 cents lower in the over the counter market," says Tommi Grasafi of Indiana Grain Company.
 
With regard the accuracy of the bearish report Grasafi says that it is a government report but things are likely to change. The price of corn is being driven by the report this morning and will likely continue on that path until the conversation turns to weather over the weekend.

Corn farmers' sowing victory sends prices plunging

by Agrimoney.com

Grain prices plunged more than 10%, with wheat falling below $6 a bushel for the first time since July, after data showed that US farmers had overcome a historically wet spring to plant the second biggest corn acreage since World War II.
US growers planted 92.3m acres with corn, 1.5m acres more than the market had expected. Estimates for US corn inventories as of the start of the month were also pegged higher than had been thought.
Both sets of statistics eased concerns over supplies of a grain which have been forecast to remain historically tight until at least autumn 2012 – expectations which drove corn futures to a record high earlier this month.
"The report was a bearish surprise on corn acres and corn stocks," broker US Commodities said.
"The bull fight is out of the market without a weather threat."
In a further blow to sentiment, the International Grains Council lifted by 17m tonnes, to 858m tonnes, its forecast for world corn production in 2011-12, citing "larger US sowings and improved Black Sea production prospects".
Prices plunge
In Chicago, the July corn futures contract, freed of daily trading limits by the expiry process, tumbed 10% to a three-month low.
Crop prices as of 16:30 GMT
Chicago wheat: $5.86 a bushel, -8.6%
Chicago corn: $6.23 ½ a bushel, -10.7%
Chicago soy: 13.15 ½ a bushel, -1.4%
London wheat: £156.75 a tonne, -7.0%
Paris wheat: E185.00 a tonne, -7.4%
Prices for July contracts on US exchanges, and November contracts in Europe
The weakness spilled over into fellow grain wheat, which fell more than 8% to an 11-month low of $5.80 ¼ a bushel.
In Europe, wheat fell 7% in Paris to E186.00 a tonne for November delivery, the contract's lowest for eight months, London's November wheat contract plunged 7% to a three-month low of £156.50 a tonne.
"The report leaves wheat with a stronger bearish tone despite the technically oversold nature of the current market - and we have yet to see harvest take full root across Europe," Jaime Nolan at FCStone's Dublin office said.
Corn vs soybeans
US Department of Agriculture statisticians, following a farmer survey, pegged corn area at 92.3m acres - 1.6m acres more than they estimated the figure earlier this month, after a wet spring left the pace of plantings well behind normal rates, and was feared to have forced mass abandonment of land.
Key corn and soybean data, diff. from forecasts and (previous year)
Corn stocks, June 1: 3.67bn bushels, +368m bushels, (4.31bn bushels)
Corn sowings: 92.282m acres, +1.52m acres, (88.192m acres)
Soybean stocks, June 1: 619m bushels, +23m bushels, (571m bushels)
Soybean sowings: 75.208m acres, -1.32m acres, (77.404m acres)
"Notable increases in acreage from last year are reported in Nebraska, South Dakota, and Minnesota," the USDA said.
Many of the extra acres appear to have come at the expense of soybeans, for which sowings were seen at 75.2m acres, well below the previous USDA estimate and market forecasts, despite North Dakota farmers achieving record plantings.
Nonetheless, with stocks of the oilseed as of June 1 coming in ahead of forecasts, this cut in sowings was seen unlikely to support prices on Thursday.
Durum hit
Similarly for wheat, sowings fell short of expectations, largely thanks to a 34% slide in seeding of durum, the variety used in making pasta, whose prospects suffered particularly from wet weather in northern states.
Key wheat data, difference from forecasts, and (previous year)
All wheat stocks, June 1: 861m bushels, +35m bushels, (973m bushels)
All wheat sowings: 56.433m acres, -238,000 acres, (53.603m acres)
Includes other spring wheat: 13.627m acres, +278,000 acres, (13.698m acres)
And durum sowings: 1.698m acres, -336,000 acres, (2.57m acres)
"Acreage in North Dakota is down 800,000 acres from last year due to an excessively wet winter and spring followed by severe flooding," the USDA said.
However, wheat inventories were, at 861m bushels, estimated some 35m bushels (1.0m tonnes) above market estimates.


Corn report calls time on grain rally. Or does it?

by Agrimoney.com

Is the rally in grain markets over?
Many analysts foresaw data on Thursday showing US sowings and stocks of corn far greater than had been expected as calling time on the bull run dating back exactly a year, when sowing setbacks in Canada, and growing fears for Russia's drought sent prices soaring.
At Powerline Group, Darren Dohme wrote an "obituary" for corn, saying the fresh data implied US inventories ending 2011-12 at nearly 1.2m bushels, well above the figure of 695m bushels which helped prices of the grain hit a record high earlier this month.
"A memorial service will be held at the Chicago Mercantile Exchange margin department for all those that were still holding long with corn," Mr Dohme said, forecasting prices of Chicago's December lot falling back eventually to $5.55 a bushel, down more than $1 from Wednesday's close.
Weather challenges?
However, many other investors were more reluctant to call time on the rally.
Offre & Demande Agricole said that world corn supplies remained "very tight", leaving production prospects vulnerable to weather setbacks.
"There is no room for a weather problem in corn this year," the French-based group said.
And at New York-based Teucrium Trading, which issues commodity-based exchange traded funds, company president Sal Gilbertie said that, while the highs in corn had been seen for now, he was "not comfortable with calling the end of the bull market".
The higher-than-expected US inventory data appeared to indicate that high prices had been effective in choking demand, particularly among livestock feeders.
"Demand for corn is showing pretty good elasticity," Mr Gilbertie said.
However, that implied that "demand is going to come right back if prices fall", limiting the extent of the fallout.
Timing issue
Furthermore, being based on data on June 1, US corn sowings could in the end prove lower than the 92.3m acres the report suggests, given that rains continued to dog plantings in northern states well into this month, he added.
Benson Quinn Commodities said that this could prove an issue in particular for spring wheat sowings data, which were broadly in line with forecasts.
"More acres could have been lost to excessive rains in Western North Dakota and Montana into the latter half of June," the broker said.
Offre & Demande Agricole said: "This acreage figure can still be subject to later changes."
'Simply don't add up'
Indeed, the USDA said it would resurvey plantings data for North Dakota, South Dakota, Minnesota and Montana in regard to planted acreage, areas badly affected by the persistent rains.
Even so, many analysts said that other states needed looking at again too, with Darrell Holaday at Country Futures calling a cut of only 100,000 acres to the estimate for Indian sowings, and 200,000 for Ohio plantings, "difficult numbers to swallow".
And the estimates of higher corn stocks "simply don't add up", given data on use, and may represent a higher-than reported harvest last year, Mr Holaday added.
"The USDA will lose a lot of credibility with the stocks number."
At PitGuru, Matthew Pierce said: "Where the hell is all this corn? Why didn't all these longs of cash corn deliver against the July contract overnight?" a reference to the start of the expiry process, when the physical aspects of futures kicks in.
"Why are basis offers at the Gulf of Mexico skyrocketing if the US has so much corn?"

Follow Us