by Tom Aspray
Greece leaving the euro, war in the Ukraine, and lousy Retail Sales data could not keep the stock market down last week. In this week’s technical review, I point out that several of the major averages have staged marginal upside breakouts, but most market analysts are not impressed.
Instead the focus seems to remain on how much the stronger dollar has hurt earnings, which they feel do not justify the current high levels of the major averages. Others are worried about what type of ripple effect the low crude oil prices will have on the economy.
Many may wait for the preliminary reading on GDP that is due at the end of the month. As I discussed in Barron’s Roundtable-Too Cautious Like 2013? the bullish panelists are only expecting gains of 10% or less. Many seem to think that the market needs a 15-20% correction to get in line with the fundamentals.
Others remain convinced that, as one analyst said, “Stocks will be ‘ripped to smithereens,’” or that are already in a recession or bear market. In the most recent trading lesson Tell Tale Signs of a Correction I took a look at what type of warning signs we typically see before a 15-20% market correction. I concluded that we currently do not see such warnings but that did not rule a 5-10% market correction.
With this week’s strength, a 5-10% correction is looking less likely, but a convincing upside breakout will make it even less likely. I have not seen anyone discussing the potential for stocks to melt up from current levels. This could be a rally like we saw in 2013 when the Spyder Trust (SPY) was up over 32%. If we get a confirmed breakout, a 3-6 week rally to significant new highs is likely, which would clearly surprise the majority.
In a December column (Is the Bull Market Only Half Over?) I discussed the following quote from Sir John Templeton, “Bull-markets are born on pessimism, grow on skepticism, mature on optimism, and die on euphoria.” If we are in this type of bull market now, we have not yet reached the optimism phase.

Click to Enlarge
There are some technical reasons that I think we could see a much stronger rally from now than the market expects. They are based on breakouts above long-term resistance and what a market typically does after such a breakout.
To look at these periods, I use quarterly close only charts of the S&P 500. The first example is what happened after the market top in 1929. The chart covers the period from 1929 to 1954 when the S&P 500 was finally able to surpass this key resistance, line a. It took the market twenty-five years to overcome this resistance and the market’s reaction was very powerful.
The chart on the right covers the period from 1946-1981 as the S&P rose from the breakout level in 1954 at 30 to a high in 1972 of over 121. The S&P then formed a new long-term trading range using the 1962 and 1974 lows, along with the 1972 high. It took eighteen years before this trading range, lines c and d, was completed in 1980 (point 2).

Click to Enlarge
One gets a different perspective on the 1980 breakout in the chart of the period from 1955 through 1997. After the breakout at point 2, the S&P 500 corrected back to the breakout zone in a fifteen month correction that took the S&P 500 down 23%. This market decline was accompanied by a high level of bearish sentiment. From the 1982 correction low, the S&P 500 started a multi-year uptrend that finally peaked in 2000.
Another range developed using the 2000 and 2007 market highs and the intervening lows (lines e and f). This trading range lasted for thirteen years and was completed in the first quarter of 2013, point 4, as the S&P 500 moved decisively above the resistance at line e.
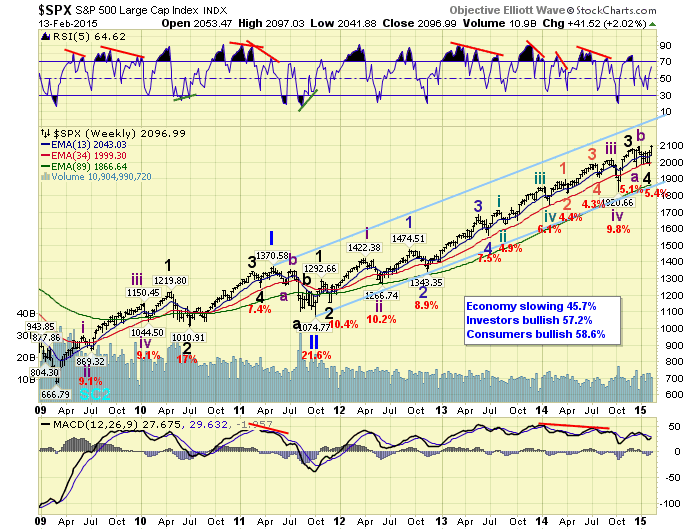
I would expect that the completion of such a trading range would result in a significant multi-year rally. From the chart, it is clear that the S&P 500 has had little in the way of a correction since the upside breakout.
If this breakout was the start of another longer-term bull market, then one or more significant corrections are likely before it is over. In fact, one is possible before the year is over, but the current technical evidence suggests it may come from significantly higher levels.
Many investors continue to be fixated on if and when the Fed will raise rates. The next meeting is on March 18. As many of you have noticed in the past year, the stock market turns soft heading into the meeting, so would expect the uncertainty to grow as we get closer.

Click to Enlarge
The weekly chart of the 10-Year T-Note yield shows that yields have risen since the end of January as support going back to early 2013, line b, was tested. There is strong resistance in terms of yield at 2.20%, so that is where any further rise in rates is likely to stall.
There are no signs from the weekly studies that yields have bottomed as the MACD is still in a solid downtrend. I would expect to see more signs of bottoming before there is clear evidence that yields have really bottomed.
There also has been quite a bit of interest in the gold market in 2015 as many gold bulls are proclaiming the start of a new bull market. Both gold and the gold miners have had a very nice rally as the Market Vectors Gold Miners (GDX) is up 15% so far in 2015.
I did not recommend buying as my long-term analysis did not indicate that a major low was in place. I was also concerned that gold typically tops out in February so that the rally might be short-lived. But I did miss a great trading opportunity.
One technical tool that I have used for many years in the commodity markets is the Herrick Payoff Index (HPI) developed by the late John Herrick. Early in my career, I had the pleasure of meeting John at several conferences. The HPI uses open interest, volume, and price to determine whether money is flowing in or out of a commodity.
I have featured it periodically in my daily columns and pointed out in Crude Oil Money Flow Turns Positive that the HPI was signaling positive money flow after the close on February 2, which favored a sharp rally in crude oil.

Click to Enlarge
Some of my readers have wondered what the HPI is telling me about the gold market. The weekly chart of Comex Gold shows that the rally topped out four weeks ago at the converging resistance, lines a and b. The next good weekly support is in the $1180-$1200 area with the monthly projected pivot support at $1195.
The weekly OBV did not form any positive divergences at the lows and looks ready now to drop back below its WMA. The weekly HPI moved above the zero line on Friday, January 9 and gold rallied the following two weeks. The HPI has turned lower but is holding above its WMA and the zero line. This is positive. I will be watching the weekly HPI closely as the correction proceeds as the daily HPI (not shown) is currently negative.
The economic calendar was light last week as Retail Sales were weak on Thursday, declining in January at the same rate as December. Some are attributing this to the possibility that consumers are spending more on services. Gasoline sales dropped 9.3% and are down over 16% in the past two months.
The University of Michigan mid-month reading on consumer sentiment dropped back to 93.6 after the January reading of 98.1, but it is still in a positive trend. With the markets closed Monday, the first reports are on Tuesday with the Empire State Manufacturing Survey and the Housing Market Index.
On Wednesday, we get Housing Starts, PPI, Industrial Production, and the FOMC minutes, which could cause some volatility Wednesday’s afternoon. On Thursday, we get the flash PMI Manufacturing Index as well as the Philadelphia Fed Survey. It looks like many of the manufacturing gauges have softened in the past few months, but it is still in a positive trend.
What to Watch
The stock market rally tried to stall on Friday, but then accelerated to the upside in the afternoon. The almost 2% gain in the S&P 500 and other major averages was a clear positive for the technical studies. I had argued a week ago in Do Stocks Have Enough Juice to Breakout? that such a breakout could occur.
A few of the key market averages like the NYSE Composite had closed January below their quarterly pivots (see Pivot Table here) but reversed the next week to close back above them.
The weekly technical studies are generally positive, but some of the daily studies—especially the OBV—are lagging. To further support the view that stocks can accelerate even higher from here, we need to see a close well above the all time highs in the next week or so. Such a move is consistent with the new weekly and daily highs in the NYSE Advance/Decline line.
The defensive sectors like the utilities were hit hard last week, but the longer-term technical picture discussed last week suggests the decline will turn out to be a buying opportunity, though the pullback could last a while.
At the end of January, it was clear from the monthly charts (Any Warnings from the Monthly Charts?) that the major trend was positive. I have found that when you are in a choppy daily environment, relying on the longer-term charts is best.
The AAII survey saw an increase in the bulls last week as the bullish % rose from 35.49% to 40%. The change in the bears was even more severe as the bearish % went from 32.42% to 20.33%.
One industry group that I recommended in January was the semiconductors and we were able to get long the Market Vectors Semiconductor (SMH) near the correction lows. I reviewed this group last week in Are These Tech Stocks Ready for Lift Off?

Click to Enlarge
There have been some significant improvements technically as 5-day MA of the % of S&P 500 stocks above their 50-day MAs has completed its bottom formation, closing Thursday near the mean of 64.3%. Typically, it will now move towards the 80% level as more stocks move above their 50-day MAs.
The weekly chart of the NYSE Composite shows that it completed its short-term flag formation, lines a and b, last week. The weekly starc+ band is at 11,305, along with the quarterly projected pivot resistance. The target from the flag formation is in the 11,500 area.
Follow Comments Following Comments Unfollow Comments 

Click to Enlarge
The weekly NYSE Advance/Decline made new highs over the past two weeks as it continues to lead prices higher. The former highs have been overcome, yet the NYSE is still below the September high of 11,108. The daily A/D line (not shown) is in a strong uptrend and is well above its clearly rising WMA.
The weekly on-balance volume (OBV) has moved back above its flat WMA—which is a plus—but it is still well below the late December high. The daily OBV is also lagging.
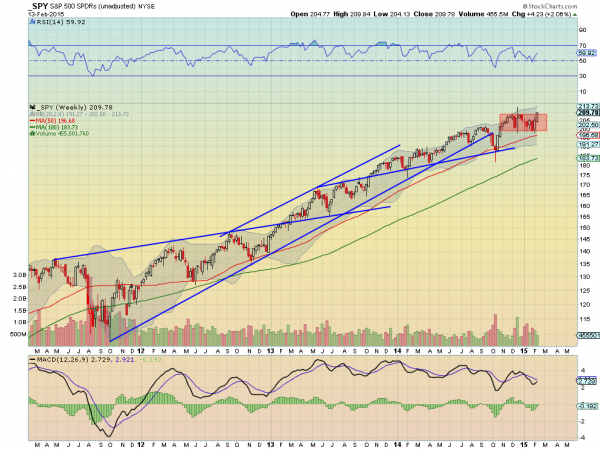
S&P 500
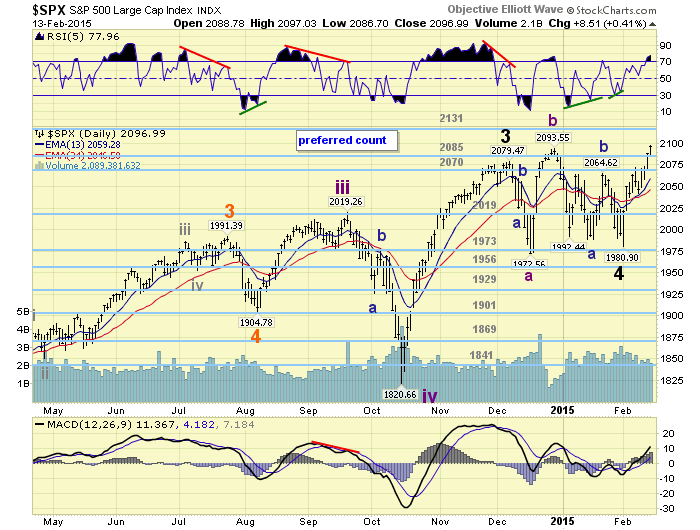
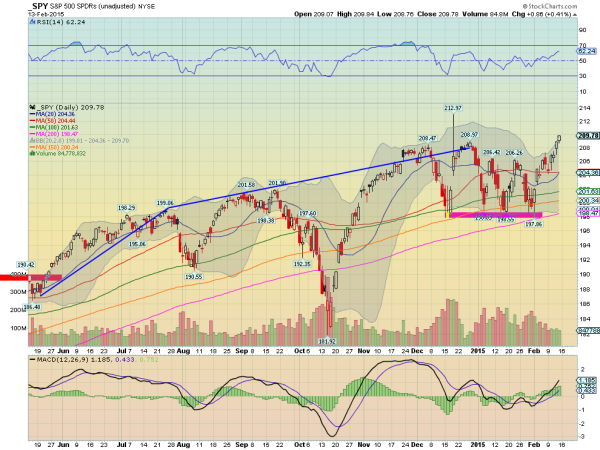
The daily chart of the Spyder Trust (SPY) shows that it dropped back to its rising 20-day EMA last Monday before turning higher It has held above the quarterly pivot at $199.42 on a weekly closing basis but just by a fraction. The starc+ band and the resistance from the prior peaks, line a, is in the $212 area. The weekly starc+ band is at $215.58.
As I noted last time, the daily close above $206.50 was significant. There is minor support now at $207.24 with the rising 20-day EMA at $205.24.
The daily S&P 500 A/D line broke through its resistance, line b, at the start of the month and could test its all time highs this week. The A/D line is above its now rising WMA.

Click to Enlarge
The daily on-balance volume (OBV) is much weaker as—while it’s now above its WMA—it is still below the January highs. Stick with the previously recommended long positions.
Dow Industrials
The SPDR Dow Industrials (DIA) is now very close to the all time highs at $180.56 as the Friday high was just a few cents lower. The daily starc+ band is at $183.08 with the weekly at $185.65.
DIA has short-term support now at $177.50-$178.50 with the 20-day EMA at $176.98.
The Dow Industrials A/D line has broken its downtrend, line h, but is well below its prior highs and is acting weaker than prices.
The daily on-balance volume (OBV) is in a short-term uptrend and well above its rising WMA. The weekly OBV (not shown) will close above its WMA this week.
Nasdaq 100
The PowerShares QQQ Trust (QQQ) accelerated to the upside last week after it overcame the upper boundary of the trading range, line a. The daily starc+ band is at $107.56 with the upside target from the trading range in the $109-$111 area. The quarterly projected pivot resistance is at $115.62.
The Nasdaq 100 A/D line moved through its downtrend, line c, at the start of February. The daily A/D line is still below the all time high at line b.

Click to Enlarge
The daily OBV is back above its WMA, but is still acting weaker than prices. The weekly OBV (not shown) is close to moving back above its WMA this week.
There is first good support at $104.58 with the now rising 20-day EMA at $103.58.
Russell 2000
The iShares Russell 2000 (IWM) moved well above the all time highs from late December in Friday’s session. The daily starc+ band is now at $123.74 with the quarterly projected pivot resistance at $132.98.
The Russell 2000 A/D line is back above its WMA, but is well below its December high. The A/D line now has important support at line g. The daily OBV has barely moved with prices, while the weekly is back above its WMA but also below its previous highs.
For IWM there is some support in the $119.50-$120 area with the rising 20-day EMA now at $118.83. We are still long IWM from our January recommendation and would stay with them.
See the original article >>


