by Greg Harmon
Last week’s review of the macro market indicators suggested, heading into the week that the equity markets were coming off of a good rebound higher but showed signs of exhaustion Friday. Elsewhere Gold ($GLD) looked to continue to pullback while Crude Oil ($USO) tried to move higher off of a bottom. The US Dollar Index ($UUP) might continue to consolidate the rise, pulling back mildly, while US Treasuries ($TLT) were biased lower in their uptrend.
The Shanghai Composite ($ASHR) looked to continue its pullback from a major run higher and Emerging Markets ($EEM) continued to consolidate in a bear flag in their downtrend. Volatility ($VXX) looked to remain low but slowly rising slowing the wind behind equities to move higher. The equity index ETF’s $SPY, $IWM and $QQQ, were all in a consolidation pattern in the intermediate term, despite the moves higher last week. The IWM looked the strongest and ready to test the all-time highs this week while the SPY was close behind but the QQQ a bit weaker.
The week played out with Gold continuing lower before a small bounce Friday while Crude Oil held another test of support in its bull flag. The US Dollar did continue the sideways consolidation while Treasuries continued down to new 6 week lows. The Shanghai Composite reversed back higher, in what could be a bear flag, while Emerging Markets looked messy in a tight range. Volatility made a new 2015 low as it neared a critical level. The Equity Index ETF’s saw this as good news, with the SPY and IWM making new all-time closing highs and the QQQ 14 year highs. What does this mean for the coming week? Lets look at some charts.
SPY Daily, $SPY 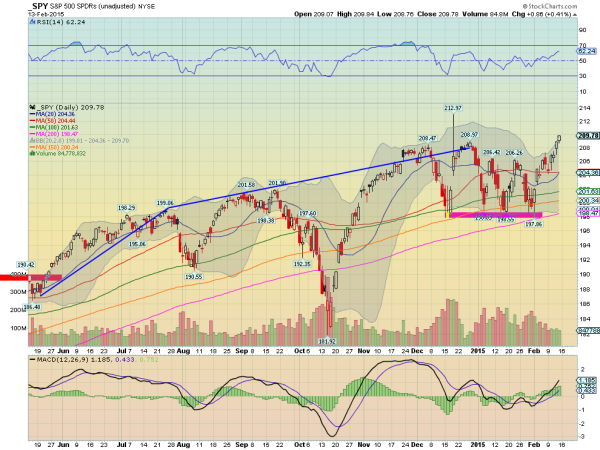
The SPY ended last week at the 50 day SMA with a Spinning Top doji, and Monday confirmed it higher. This also confirmed a break of the range since the start of the year. The rest of the week continued higher with Thursday a new all-time high close and followed up with another on Friday. The Bollinger Bands® have opened higher allowing the move to continue on the daily chart as the 20 day SMA turns up. The RSI on this timeframe is making a two month high as it continues into the bullish zone over 60. The MACD is also pointing higher.
Moving out to the weekly timeframe sees the strong candle piercing the consolidation zone that has held the SPY since late October. The RSI is making a marginally higher high and rising. It never left the bullish zone. The MACD is about to cross up, also supporting more upside price action. There is resistance (maybe) at the spike to 212.97 with a Measured Move to 224 above. Support lower may come at 209 and 206.40 followed by 204.30. Continued Upward Price Action.
SPY Weekly, $SPY 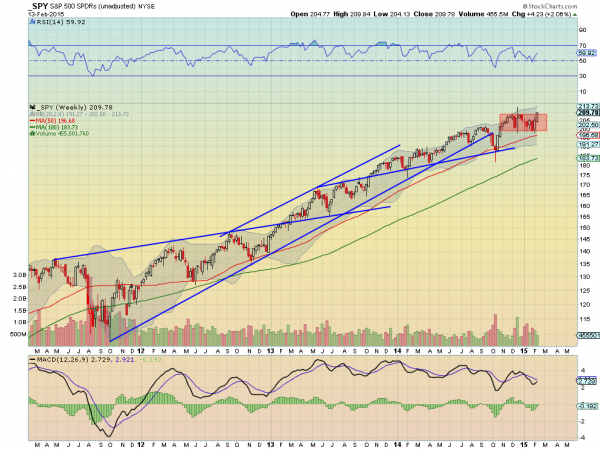
Heading into a shortened February Options Expiration week the equity markets look strong, breaking long consolidations to the upside. Elsewhere look for Gold to lower in the short term in the longer consolidation while Crude Oil consolidates, and may be ready to reverse higher. The US Dollar Index looks to continue in a consolidation range while US Treasuries are biased lower.
The Shanghai Composite looks to continue to pullback in the uptrend and Emerging Markets look to hold in the bear flag, and might prove it a reversal higher. Volatility looks to remain subdued and now drifting lower, keeping the bias higher for the equity index ETF’s SPY, IWM and QQQ. Their charts all look strong on both the daily and weekly timeframes. If you had to pick a weakness then the gaps in the QQQ chart and move out of the Bollinger Bands® may signal short term exhaustion not seen in the SPY and IWM. Use this information as you prepare for the coming week and trad’em well.
No comments:
Post a Comment