Saturday, June 25, 2011

Pork dynamics test golden economic rule

by Agrimoney.com

Is there a flaw in the economic rule that buyers only pay up for items in short supply?
It might appear so, to judge by the pork market. The price of wholesale US pork, the so-called cut-out, has hit a record $99.27 a hundredweight, latest official data show.
That's up $2.36 on the day, and a rise of 18% year on year, with loin seeing a particular rise, at $120.15 a hundredweight, up 30% from a year ago.
Yet data this week also showed the US having a mass of pork supplies. Pork in cold storage in America has reached 545.1m pounds, nearly 100m pounds more than a year earlier, and some 30m pounds more than the market had expected.
Indeed, the figure was blamed for fuelling a rise of 1.0% in hog prices on Thursday, even when cattle rose.
The apparent contradiction between high prices and rich supplies "is certainly a strange one", Don Roose, at broker US Commodities said.
Sign from butts
Analysts scratching their heads for explanations have come up with two.
The first is a matter of detail, with the cold storage data including not just meat set aside for inventories but product in transit for export too – that is quite some volume, given that officials expect US pork shipments to jump 15% this year to 4.87bn pounds.
Signally, stocks were particularly high of frozen pork butts, a popular shipment to South Korea, which has been a key importer of meat this year after an outbreak of foot-and-mouth disease ravaged its domestic industry.
'Backward looking'
The second is down to timing.
The stocks report, which gave data as of the end of May, is "by its nature backward looking," Alton Kalo, at Steiner Consulting, said.
"It is looking at what happened in April and May," when prices fell, encouraging processors to store pork rather than sell it, rather than the more positive dynamic since.
And, even so, the drag from high stocks could be seen on some cuts.
"Belly prices normally increase into May and June. This would explain when belly prices pulled back this time," Mr Kalo said.
'Prices to dip'
But not all the analysis is so upbeat for producers. For one, even at record price, pork carcasses were not covering the hog costs, which have, on cash markets, hit a series of record, mostly $103.51 a hundredweight in Iowa-Minnesota.
"Hog prices are going to have to come back."
Furthermore, for poultry farmers, a rise in chicken in cold storage cannot so easily be explained away, given flagging exports and low prices.
"Breasts are selling at $1.22 when you have thought they would sell at $1.50-1.60 at this time of year," Mr Kalo said.
Data later
The comments come ahead of a quarterly US Department of Agriculture report on US hogs and pigs, later on Friday, expected to show little change in either of the three main dynamics – national herd size, animals kept for breeding, and kept for marketing – despite high corn prices raised feed bills.
"Producers have already liquidated so much of their hog herd in the US already," Mr Roose said, with numbers falling heavily in the end of the last decade, hit by a double whammy of first high corn costs then the world recession.
Furthermore, given the factory nature of modern hog farming, and potentially order commitments, it was "no so easy to slow it down".
Producers may be taking a "wait and see" attitude, to assess whether high grain prices will persist, he added.

Brazil fears cloud world's return to sugar surplus

by Agrimoney.com

ABN Amro echoed forecasts of a return to a sugar production surplus – but not by as far as some other observers, warning that the threat of disappointing Brazilian production left the market facing "another season of uncertainty".
World sugar output will jump to 169.3m tonnes in 2011-12, well ahead of consumption, pegged at 161.5m tonnes, the bank said.
However, the estimate of 7.8m-tonne production surplus is below some other forecasts, with Czarnikow earlier this month pegging the gap at 10.3m tonnes, and Swiss-based Kingsman expecting a 10.6m-tonne figure.
"It has become more apparent that the 2011-2012 Brazilian harvest will seriously undershoot expectations, and that disappointment will hardly be compensated for by a gradual return of India to export availability," ABN said.
"There is yet another season of uncertainty to negotiate – possibly even more than one," if Brazil's waning sugar productivity, a hangover from a dearth of investment during the world recession, proves "a structural as opposed to a merely transient problem".
'The big question'
The comments follow a weak start to 2011-12 for sugar output in Brazil's Center South region, which is responsible for most of the output in the world's top producing, and exporting, country.
While dryness in May allowed mills to catch up some production lost since February, when frequent rains slowed cane harvesting, this dearth of rain itself will come with a hangover later in the season, in terms of stunting development of the crop.
Raizen, the joint venture between Brazilian sugar giant Cosan and Anglo-Dutch oil goup Shell, warned earlier this month that Center South sugar output could fall to 31.1m tonnes, compared with industry estimates of nearly 35m tonnes.
"The big, and unanswerable, question is - how far will Brazil's cane and sugar output in 2011-2012 drop below initial expectations?" said ABN, whose research is undertaken with the VM Group.
"If the Brazilian harvest does undershoot by as much as 30% consistently throughout the rest of its season, then the price will surely rise further."
'Worries pre-eminent'
The comments came as sugar futures, once again, swung between positive and negative territory in New York, although not as strongly as in the last session, when the July lot slumped 5.6% after India announced consent for an 500,000 tonnes of exports, only to close in positive ground.
"It seems worries about Brazil's output are still pre-eminent," Nick Penney at Sucden Financial in London said.
New York's July contract closed 0.2% lower at 27.54 cents a pound, with London white sugar for August ending up $0.10 at $734.60 a tonne.

Fundamental friday ...

by Kimble Charting Solutions


See the original article >>

30 MILLION BARRELS – A DROP IN THE BUCKET

By Carl Swenlin

Yesterday the administration released 30 million barrels of crude from the nation’s strategic reserve. This represents about a day-and-a-half of our current usage, so it is really just a drop in the bucket and not likely to have a significant effect on the price of oil or gasoline.
On the daily chart below you can see that there was a sharp one-day drop that touched the $90 level, but it closed slightly above Monday’s low. More important, we can see that crude has been falling in price for about seven weeks, and a declining trend been established.
Screen shot 2011-06-24 at 10.28.23 AM
Taking a longer-term look with the weekly-based chart, we (who are looking for lower oil prices) get more encouragement as we see that the long-term rising trend line has been penetrated, and the weekly PMO is falling below its EMA — both indications that the decline should continue. Currently, prices are sitting on top of a support zone between 70 and 90, and, while lower prices may be coming, it will probably take some work to eat through that support.
Screen shot 2011-06-24 at 12.01.58 PM
Bottom Line: Releasing some of our strategic oil reserve was a tactical move that will probably have little effect on the long-term movement of oil prices. Fortunately, prices were headed lower well ahead of yesterday’s announcement. We can’t argue, however, that the move will probably give the down trend a temporary nudge. As of 5/16/2011 United States Oil Fund (USO) is on a Trend Model NEUTRAL signal, which means we have a medium-term sell signal in a long-term bull market. Being neutral is intended to avoid the decline.

Yuan Schizophrenia

by Menzie Chinn

Or more on China-U.S. exchange rate pass through

Tuesday’s Wall Street Journal illustrated the conflicted nature of American views regarding real yuan appreciation. The front page article by Hilsenrath, Burkitt and Holmes argued “Change in China Hits U.S. Purse”. On the back page of the C section was a countering article, “No appreciation for the rising yuan”, by Orlik, that noted the moderate impact on prices of imported goods from China.

The front page article stressed the fact that as the yuan appreciates, and Chinese labor costs rise, then the price of imported goods that constitute a large part of the bundle of goods purchased by lower income households also rise, thus pushing up the overall cost of living.

That epoch [of cheap imported goods from China] appears to be over. Prices of imported goods are climbing becoming a source of inflationary pressure. A wide areity of common products made abroad… are landing on U.S. docks with higher price tags.
From the back-page article:

A rising yuan has actually done little to force of the price of China’s exports. Data collected by the U.S. Bureau of Labor Statistics show the price of U.S. imports from China in May up just 2.8% year on year. That is higher than in past years, but it still means only a fraction of the yuan’s gains are so far being passed through into higher prices.
Can both articles be right (or both wrong) at the same time?

Interpreting the Statistics in the Context of the Literature

Neither of the articles graphically illustrate the relationship between exchange rates and import prices implicitly described in the text. Hence, I provide Figure 1.
yuanschiz1 economy
Figure 1: Log USD/CNY nominal exchange rate (blue), and price of goods imports into the US from the PRC (red), both normalized to 2010M06=0, 2010M01-2011M05 period. Source: St. Louis Fed FREDII, BLS, and author’s calculations.


The issue at hand is exchange rate pass-through, which I discussed here and here. It is useful to recall the identity, in logs:

p$Import = s$/¥ + p¥Export

Where p$Import is the log dollar price of imported goods from China, s$/¥ is the log exchange rate, in number of USD per CNY, and p¥Export is the log CNY price of Chinese exports to the US. Taking the first difference:

Δp$Import = Δs$/¥ + Δ p¥Export

A percentage point change in the exchange rate should, ceteris paribus, induce a percentage point change in the dollar import price. Of course, not all else is held constant, and the yuan price might change. In other words, Chinese exporters might choose to absorb a part of a yuan appreciation in profit margins.

In this post on Chinese export pass through in to US imports, I cited a study by Cui et al. (2009), that identified an exchange rate pass through coefficient of around 0.5, consistent with my own estimates of around 0.52 over the 2005M07-2010M12 period for imports into the U.S. Viewed in this light, the behavior of prices of imported Chinese goods over the last year has been fairly in line with expectations.

I am always wary of examining relationships over too short a period; hence Figure 2 presents the same series over the 2005M01-2011M05 period.
yuanschiz2 economy
Figure 2: Log USD/CNY nominal exchange rate (blue), and price of goods imports into the US from the PRC (red), both normalized to 2005M06=0, 2005M01-2011M05 period. NBER defined recession dates shaded gray. Source: St. Louis Fed FREDII, BLS, NBER, and author’s calculations.


Figure 2 appears to indicate that exchange rate pass through was lower during the longer period. However, the price is also determined by costs, and over part of the sample period (2003-05 in particular), unit labor costs were probably dropping due to rapid productivity growth, as discussed in this post.

What is true is that, in line with my arguments at the IMF forum on a new development model for China at the Fall 2010 Bank-Fund meetings, resumption of CNY appreciation has given cover for other East Asian countries to allow their currencies to appreciate (as pointed out in the Orlik article). Import prices from the Newly Industrializing Countries (NICs) have as a consequence also risen.
yuanschiz3 economy
Figure 3: Log import prices from Newly Industrializing Countries (NICs) (teal), and from the PRC (red), both normalized to 2010M06=0, 2010M01-2011M05 period. Source: BLS and author’s calculations.


The Impact on Overall Price Level versus Relative Price Changes
As I have noted before [1], I have found the argument that higher Chinese export prices would translate into higher US inflation a bit overwrought — not because it is a qualitatively incorrect implication, but rather because on quantitative grounds, non-oil import prices do not appear to be important determinant of overall inflation in industrial countries.

For instance, as noted here, the pass through of aggregate import prices into US consumer prices has appeared to be declining over time. From Mishkin’s 2008 survey of exchange rate pass through and monetary policy:

The correlation between consumer price inflation and the rate of nominal exchange rate depreciation can indeed be high in an unstable monetary environment in which nominal shocks fuel both high inflation and exchange rate depreciation. But a salient feature of the data is that this correlation has been very low over the past two decades for a broad group of countries that have pursued stable and predictable monetary policies. Moreover, the evidence suggests that even countries in which inflation and exchange rate depreciation appear to have been fairly closely linked historically have experienced a sizeable decline in pass-through following the adoption of improved monetary policies.
And, from a more recent DeutscheBank analysis (Hooper, Mayer, Spencer, Slok, “Exchange rate and commodity price pass-through in Asia,” Global Economic Perspectives, New York: DeutscheBank, June 17, 2011, not online):

We employ a recursive VAR approach to modeling Asian inflation in
which we include international oil, food and core consumer prices, the
exchange rate, domestic money supply and output as determinants of
inflation.
We find very weak pass-through of exchange rate changes to consumer
prices. This suggests that exchange rate appreciation itself is unlikely to
significantly reduce inflation. In fact, only in India, the Philippines, South
Korea, Thailand and the US would we consider the exchange rate passthrough
effect to be significant and even there it is generally small and
short-lived.
These assessments are at variance with the perspective of a significant and pervasive impact from China [2], although persistent Yuan undervaluation might have a different effect than discrete changes in exchange rates.

So, as I have pointed out before, faster CNY appreciation will lead to a change in the relative price of Chinese and other imported goods, rather than inducing a price level increase, facilitating the switch of US production toward tradables. This is key to rebalancing the US economy. The empirical evidence (i.e., econometric studies) suggest that higher import prices do not manifest themselves into substantially higher general prices, so inflation is not the primary concern here. That does not deny that certain households will be impacted more than others by those relative price changes.

The Enduring Mystery of Slow CNY Appreciation
That being said, Orlik’s article does highlight certain important points:

The brutal truth for U.S. manufacturers is that improvements in productivity in Chinese firms, and willingness to accept lower margins, are counterbalancing the impact of a rising yuan on their competitiveness.


As important, the yuan’s gains against the dollar have not been enough to compensate for the dollar’s fall against most other currencies. The yuan has actually fallen 3.7% on a trade weighted basis in the last year, and is down 8.4% against the euro. That is especially bad news for the manufacturing sectors of crisis-afflicted Greece, Spain and Portugal. Those who find themselves competing with Chinese manufacturers will find life even tougher.
The outlook for appreciation is little better.? High inflation might encourage Beijing to let the yuan rise slightly faster. But the weight of the argument is shifting in the other direction. Concerns about growth will strengthen the export lobby’s argument for exchange rate stability.
Perspective is important. While it is true that the trade weighted nominal yuan had depreciated over the last year, the real yuan has barely budged; and over a longer horizon, the yuan has trended upward in real value against other currencies.
yuanschiz4 economy
Figure 4: Log real trade weighted yuan from IMF (dark blue), and from BIS (pink), both normalized to 2005M01, 2005M01-2011M05 period. NBER defined recession dates shaded gray. Source: St. Louis Fed FREDII, BLS, NBER, and author’s calculations.


That being said, CNY appreciation should be faster, even from the Chinese perspective. Eswar Prasad, who was head of the IMF’s China desk for two years, shares my puzzlement in his recent testimony to the U.S.-China Economic and Security Review Commission:


A currency appreciation would serve the dual objectives of tamping down inflationary
pressures and helping to shift the balance of growth towards private consumption.
Indeed, a more flexible currency would eventually allow the central bank a much freer
hand in changing interest rates to meet the twin objectives of high growth and low
inflation. A currency appreciation would help rebalance growth by increasing the
purchasing power of domestic households. This would happen directly through the fall
in the price of imported goods and also by giving the central bank room to raise deposit
rates, giving households a better rate of return on their savings.


All of this makes it surprising that China has not used currency appreciation more
aggressively as a tool in the fight against inflation and as one way of promoting more
balanced growth. It seems that a huge political bar has to be crossed before the
Chinese leadership accepts the use of currency policy as a tool against inflation. The
twelfth five-year plan has little to say on this subject other than the ritual affirmation of
steps to improve the exchange rate formation mechanism.
One can only hope that Chinese policymakers see the wisdom in faster CNY appreciation, and soon, as inflationary pressures in China remain unabated (although, Lardy sees slowing inflation in 11Q3).

One More Reason to Like the Short Side of the Market


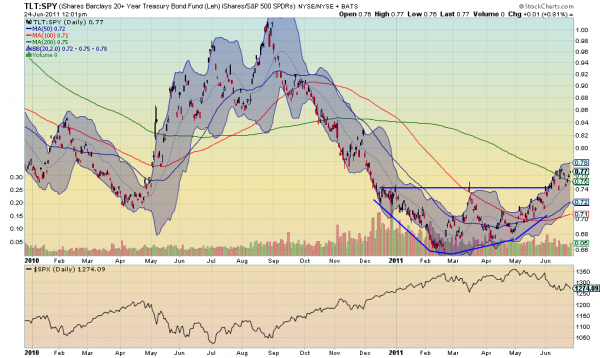
Yesterday I wrote that the S&P 500 was starting to look even better to the short side (link below). Let me give you one more reason to start looking that way if you are not already. Below is the ratio chart of iShares Barclays 20+ year Treasury Bond Fund (ticker: $TLT) against the S&P 500 SPDRs (ticker: $SPY).
tlt spy 18 month e1308932585163 stocks
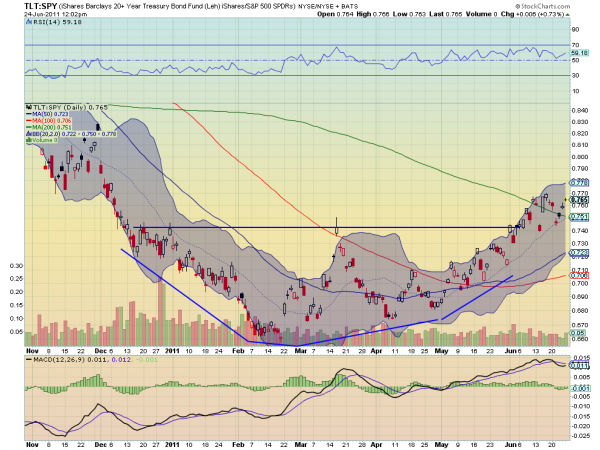
On the bottom scale for comparison is the S&P 500 Index. Notice how closely the ratio follows the shape of the Index. Now focus in on the last six months of the ratio. Not only as it based and is
tlt spy1 e1308932608584 stocks
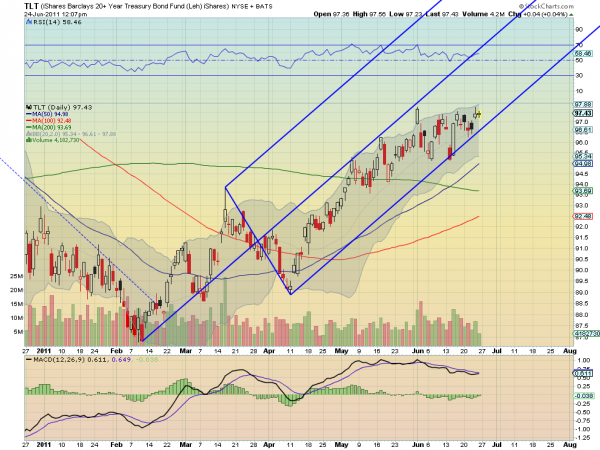
rising, but it is now putting a floor at the previous top of the base. But a ratio chart is influenced by the relationship between two stocks, so lets look at the prognosis for the $TLT in the final chart.
tlt1 e1308932639224 stocks
This shows that Treasuries are being drawn towards the lower Median Line, but with little downside. If this line holds then the ratio above will continue higher, and the Relative Strength Index (RSI) and Moving Average Convergence Divergence (MACD) indicator suggest that it will hold. This is not a guarantee of a lower S&P 500 but the planets are aligning.

Managing bond portfolios with yield curve relationships

by PAUL D. CRETIEN

Computer programs enabling analysts to calcualte minor changes between interest rates and yields throughout the fixed income world create exploitable opportunities for the bond trader. Here we will review the efficient relationships between various rates and yields to arrive at several conclusions: 1) that the yield curves on government securities are the prime determinants of interest rates in every market; 2) that forward rates are not predictors of future interest rates, but are determined by the need to conform to the current government bond yield curve, and 3) that the terms "forward" and "futures" are misleading if Eurodollar rates and forward rates are tied continuously and directly to government securities yields-to-maturity.

Yields at specific maturities for bonds and interest rate futures represent one side of the rate-yield coin. For any maturity, the yield is the end product of a sequence of shorter-term rates that progress in terms of geometric mean rates to the listed yield for a bond or interest rate futures contract. Knowing the yield at a given maturity and the immediately preceding yield permits calculation of the rate of interest (the forward rate) for the corresponding short-term period. Interest rates that cover a single short-term period are forward rates, while yields are the result of linked forward rate sequences.

Because of the relatively large number of short-term rates for eurodollar futures — 40 quarterly rates leading to yields-to-maturity up to 10 years — these contracts are ideal for analyzing long- and short-term interest rate markets. Trading through each day shows continuous pricing patterns for the 40 quarterly Eurodollar futures rates. Eurodollar yields are not listed, and must be calculated from the chain of geometric means computed from short-term quarterly Eurodollar futures rates, beginning with the London Interbank Offered Rate (Libor).

Conversely, the yields on U.S. Treasury notes and bonds at different maturities are known, while the implied 90-day forward rates leading to yields at specific maturities are not listed and must be calculated by reversing the sequence of geometric means from the longest-term yield back down the yield curve. When both sets of calculations are complete, as shown on "Eurodollar and Treasury forward rates" (below), we can see that the computed Eurodollar yields are intrinsically tied to the U.S. Treasury yield curve, and that the computed Treasury forward rates are aligned closely with Eurodollar quarterly rates. 


The Eurodollar yield curve is higher than the U.S. Treasury yield curve because of the risk differential between risk-free government securities and 90-day dollar deposits, and the need for Eurodollar futures to offset their lack of convexity — a straight-line price change at $25 per basis point compared to the convex bond price curve. On "Two yield curves" (below) the risk/convexity spread of Eurodollar yields over Treasury yields is approximately 50 basis points on April 19, 2011. 


"Two yield curves" shows how closely correlated the Eurodollar yield curve is with the U.S. Treasury yield curve. Each Eurodollar quarterly rate must be in its proper place for the two curves to fit together, and a shift in Treasury yields must be reflected in Eurodollar rate and yield changes. At the same time, the Treasury yield curve immediately determines, through arbitrage, the yields and prices of other interest rate futures, including two-, five- and 10-year T-note futures and futures contacts on interest rate swaps.

Just as the Eurodollar yield curve can be used to describe the shape and individual quarterly yields along the U.S. Treasury yield curve, the 90-day interest rate futures of non-U.S. markets should respond to their individual government security yield curves. For example, "Short sterling rates and yields" (below) shows 90-day short sterling futures rates and the yield curve that is created from quarterly sterling rates. The risk-convexity spread between the yield curves is 50 basis points for most of 16 quarters of futures delivery dates. 


Similar to the implied forward rates computed from the U.S. Treasury yield curve, forward rates for the United Kingdom can be found by reversing back down the government yield curve. The implied forward rates approximately are parallel to — and slightly lower than — the short sterling rates. The government yield curve in each country or market is the determinant of short-term interest rate futures as well as the forward rates on government interest-bearing securities. 

Four currently-traded interest rate futures contracts are shown on "90-day interest rate futures" (below). In addition to Eurodollar rates listed by CME Group, these include euribor, NYSE Liffe Eurodollar and short-sterling futures. Although they start at different rates, the four contracts converge at approximately 4% after 16 quarters on April 14, 2011. With the Federal Reserve holding U.S. rates for one-quarter delivery dates at extremely low levels, the 1.50% euribor rate (for 90-day euro-related rates) looks surprisingly high in comparison. The shortest-term rate on 90-day sterling futures is in the middle at 1.00%. 


The curves of 90-day rate-to-yield ratios also vary between interest-rate futures markets. These are the "flex" curves described in "Eurodollar futures: Rate, yield and price structures" (May 2010). When interest rates are at a low level, as they currently are in the United States, the ratio of rates-to-yields will increase. As shown on "Ratios of rates to yields" (below), on April 19, 2011 Eurodollar futures rates topped a two-to-one ratio over yields at approximately the two-year, or eight-quarter, mark in number of quarters to maturity. At the same time, the ratios for the European Central Bank (ECB) on average increased from 1.0 to 1.4.


Tracing ratios
The ratio of rates-to-yields is not a predictor of rate changes, but can be an important factor when rates change. As interest rates rise in the United States — which they invariably will do at some point — the ratio will fall, rewarding long positions in Eurodollar futures over a range of expiration dates compared to the more stable yields on T-note and interest rate swaps futures at the same maturities. 

On April 22, 2011 the price of a five-year T-note futures contract was 116-07, or $116,227, with a yield of 2.525%. An immediate increase of 100 basis points in yield would result in a new price of $111,255 — down $4,972 due to the increase in yield. A spread trade using a two-to-one ratio of March 2016 Eurodollar futures against the five-year T-note produces a slight loss, with the long-side Eurodollar futures down 2 x $2,500. However, "Ratios of rates-to-yields" shows that the increase in yield should be accompanied by a decrease in the rate-to-yield ratio from 1.80 to 1.40 or lower. This should give an edge in trade results to the long Eurodollar futures as they lose less than the short T-note futures. 

At any time, the structure of Eurodollar yields at different maturities is determined by the sequence of short-term (quarterly) rates, with the underlying objective of matching the U.S. Treasury yield curve. The same process is at work in different interest-rate markets, although the levels of rates, yields and ratios of rates-to-yields vary.

Whether or not a trader believes that interest rates can be predicted by looking at forward rates or the yield curve — or whether changes in government bond yields precede or follow shifts in forward rates — it still is worthwhile to observe the relationships between quarterly rates and yields at various maturities. Changes in the curves of quarterly rates, forward rates or longer-term yields provide the speculative profits and losses as well as the benefits of hedging that are the underlying reasons for the existence of the market for interest-rate futures and options.

Fireworks Coming Early?

by Tom Aspray

Something’s got to give as we approach Independence Day, as the quixotic action last week hurt both quick-hit traders and longer-term investors. But an early rally next week would improve the outlook greatly, writes MoneyShow.com senior editor Tom Aspray.

As someone keeps a close eye on not only the US, but also overseas markets, last week was tough. There were violent swings in many key markets

Last week’s trading had something for everyone. As the rally in the stock market fizzled last Wednesday, it was taken calmly by most. Then the IEA’s action on oil reserves Thursday gave all the markets—but especially traders in the oil pits—a full-body slam.

Those who were buying puts and shorting stock-index futures early in the week were very happy, but the last hour rally Thursday took away many smiles. The 30-minute, 13-point upside reversal in the S&P 500 was one of the more dramatic moves I have ever seen.

The heavy volume suggested a potential selling climax, but the market’s failure to close above the prior week’s highs on Friday means the jury is still out. If nothing else, Thursday’s action likely shook the confidence of those who are betting on a much stronger market decline.

Though both long term and short term technical evidence suggests that we are in the process of forming a bottom, there are several storm clouds on the horizon that can’t be ignored.

The weakness in stocks on Friday was spurred by the sharp declines in many of the European banks. The markets are not only concerned about how much exposure they may have in other weak Euro countries besides Greece, but also how much exposure US money-market funds have to the banks’ debt.
chart
Click to Enlarge

The top-left chart above shows the sharp slide in Barclays PLC (BCS) as it gapped lower Friday on heavy volume. It is down 28% from early March, and has broken below major support (line a). The on-balance volume (OBV) is in a solid downtrend (line b), indicating that money is flowing out of this stock.

Even though Switzerland is not a Euro country, and has the strongest currency in the world, the Swiss bank UBS AG (UBS) has also been hit. It is down 15% since the start of May. It has also broken short-term support (line c), and its OBV looks weak.

The sentiment in the junk-bond market also saw a dramatic change recently, as $5 billion has come out of junk-bond funds in the past two weeks.

The chart of the SPDR Barclays Capital High Yield Bond ETF (JNK) shows the drop through weekly support from the fall of 2010 (line e). Volume was very heavy on the break, but the OBV gave a good warning as its uptrend (line f) was broken in March.

This may be a further warning for equities, as these bondholders are worried about another recession and a pick-up in defaults by bond issuers. If you are in some of the other junk-bond ETFs, like iShares iBoxx $ High Yield Corporate Bond ETF (HYG) and PowerShares Fundamental High Yield Corporate Bond Portfolio ETF (PHB), I would watch the action closely.

Commodity investors were also not immune, as precious metals reversed course, and many of the commodity indices also took a beating last week. My long-term outlook for the commodity markets still suggests that this correction will be a buying opportunity, but not until we see prices bottom out.

No real surprises last week from the economic reports, and there is a fairly full calendar this week. Personal income is reported Monday, followed by consumer confidence on Tuesday.

We also get more information on the housing market, with the Case-Shiller Home Price Index report Tuesday, followed by pending home sales on Wednesday.

Jobless claims numbers come on Thursday. Finally, just before the long weekend, we get consumer sentiment, the ISM Manufacturing Index and the monthly reading on construction spending.

WHAT TO WATCH
chart
Click to Enlarge

S&P 500
The Spyder Trust (SPY), after rallying to a high last week of $129.81, closed not far above the widely watched 200-day MA of $126.52. Friday’s weak close suggests this level may be broken. This makes the March lows at $125.28 (line a) even more important.

A close under this level could cause a quick downdraft to the $123.40 to $122.30 area (line b), which corresponds to the 38.2% support and the October 2010 highs.

Such a decline may be signaled in advance by a drop in the S&P 500 A/D line below the recent lows (line d). If last week’s lows in the SPY are broken, but the A/D line holds its lows, it would be a short-term positive.

The S&P 500 A/D line has much more important support (line e), and needs to move back above resistance (line c) to turn positive. Key resistance now stands at $129.81, and a close above it should signal that the decline is over.

Dow Industrials
The rally in the Diamonds Trust (DIA) appears to have stalled at $121.91, not far below 38.2% resistance at $122.36. The daily downtrend and the 50% resistance are at $123.57.

The daily A/D line on the Dow Industrials broke its short-term downtrend (line g) last week, which was an encouraging sign. It needs to now move above last week’s high to complete the bottom formation.

The key support level to watch is last Thursday’s low at $118.41, followed by 38.2% support at $116. The March lows sit at $115.51.

Nasdaq-100
The PowerShares QQQ Trust (QQQ) rebounded most impressively from last Thursday’s lows, as it closed higher for the day. Still, the resistance at $55.37 to $55.47 needs to be overcome to turn the focus on the upside.

Last week’s lows of $53.62 held above the 38.2% support level at $52.83. Volume was lower on Friday’s decline.

Russell 2000
The iShares Russell 2000 Trust (IWM) held well above the recent lows at $77.23, and closed Friday above the prior week’s highs at $79.68. Next resistance stands in the $82 area.

This is a positive sign…but there may be some distortion, as the yearly rebalancing of the Russell Averages occurs after the close.

The 38.2% support from the 2010 lows sits at $76.11.

First daily resistance stands at $79.68, and a close above this level should signal a rally to the resistance at $80.50.

Follow Us