 |
Friday, April 4, 2014
Time to Ditch Stock Market Swinging Cyclicals?
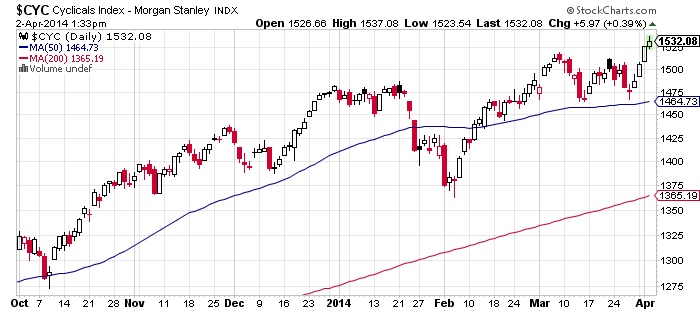
| George Leong writes: The stock market appears to be getting somewhat top-heavy. Scanning through my screens, I am quite amazed to find that the majority of S&P 500 stocks are well above their respective 200-day moving averages, which makes opportunities much more difficult to come by for the average investor who might look at their portfolio once a week or month. In 2013, we saw staggering upside moves in some of the momentum stocks, such as Google Inc. (NASDAQ/GOOG), priceline.com Incorporated (NASDAQ/PCLN), Netflix, Inc. (NASDAQ/NFLX), and Chipotle Mexican Grill, Inc. (NYSE/CMG). These are the top players in their respective areas. But that was then. Now, we are seeing a renewed interest in some of the safer names in the stock market, which is why the Dow Jones and S&P 500 outperformed in March. My view is that while there will still be money to be made in some of the more speculative and momentum plays in the stock market, we could also see a pause for investors to digest the gains made. Cyclical stocks, or those companies that swing with the economy, are still worth a look, but should the economic renewal stall and jobs creation dry up, it might be time to look elsewhere. Here I’m talking about those sectors such as auto, furniture, retail, travel, and restaurants. Everyone is spending when all is good and people are making money on the stock market, but spending will curtail on any signs of slowing and a drop in confidence. The Morgan Stanley Cyclicals Index shows the uptrend in the cyclical stocks.
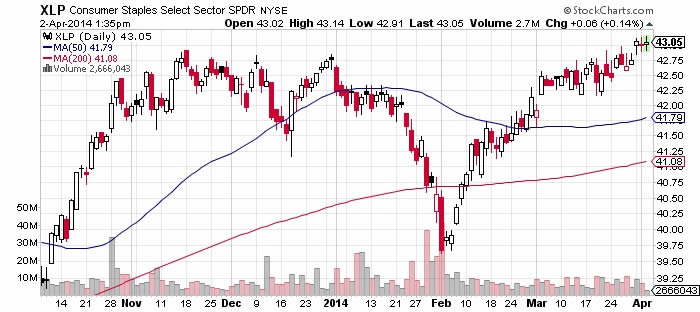
The area that will perform best in an economic downturn is the defensive sector—the area that comprises boring companies that make products that are used every day. When the economy is growing, these stocks manage to produce average returns, though they underperform cyclicals. However, in a downtrending economy, defensive stocks tend to outperform. The chart of the Consumer Staples Select Sector below shows the rally in defensive stocks since February.
Defensive sectors in the stock market include utilities and consumer staples. Some of the top proven defensive stocks include the likes of Kimberly-Clark Corporation (NYSE/KMB), The Travelers Companies, Inc. (NYSE/TRV), CVS Caremark Corporation (NYSE/CVS), and The Clorox Company (NYSE/CLX). Boring stocks, but they will deliver excellent long-term returns. So the idea now is to monitor the stock market and look for clues on where the money is going. This year may turn out to be the year for defensive plays with excellent dividend flows and the ability to make some capital gains while seeking capital preservation. |
Peak Bubble 2.0: The Market Is Now Exactly As Overvalued As It Was At The Last Bubble Peak
by Tyler Durden
| According to this chart from JPM the market's forward P/E ratio now is precisely 15.2x. What was it at precisely the last bubble peak on October 9, 2007? 15.2x. Everyone knows what happened next.
Source: JPM |

Geopolitical risk spoils party again
By Phil Flynn
| Back On! Just when it looked like the petroleum complex was going to collapse under the weight of ample crude supply geopolitical factors is sending oil higher again. Veiled refines by Gazprom about the low stocks of gas in the Ukraine was another way of saying that the Ukraine was stealing gas. This of course would be a justification in Russia’s eyes to cut off supply. That comes as Russia moved to raise gas prices by a mere 80% on the Ukraine to punish the country for not falling under the thumb of Russian President Vladimir Putin. Russia In the meantime recalled its ambassador to NATO for consultations just two days after NATO member countries suspended cooperation with Russia over the Ukraine crisis. Just when the market wanted to sweep the risk of a European gas supply cutoff under the rug it seems that that risk is back in play. |
|

| Reuters reports that the latest rise will be to $485 per 1,000 cubic meters - two days after Gazprom announced a 44% increase in the gas price to $385.5 per 1,000 cubic meters from $268.5 due to unpaid bills. This is much more than the average price paid by consumers in the European Union. The market was also disappointed with events in Libya. Hopes that a deal with rebels would reopen Libyan ports and start oil flowing right away were dashed when East Libyan rebels denied they had a deal. Bloomberg Ali al-Hasy, spokesman of self- declared Executive Office for Barqa region, comments by phone, denying press reports that Zueitina oil port to be handed over in days to PM Abdullah .“This is not true, we will first wait for the government to confirm the agreement reached yesterday with its Representatives,” Al-Hasy says. “We will then hold a press conference to announce the details of the agreement and the handing over mechanism of all the ports. It can all be done in a week after the government gives its approval.” Still there is still hope that this can be worked out but not before this weekend. So with Russia rattling and uncertainty on Libya the market will have a hard time selling off. Another drop in natural gas supply is adding to fears that we will get back to adequate storage by next winter! Is this market a price spike waiting to happen? U.S. nat gas inventories fell to a dangerously low 822 billion cubic feet meaning that producers will have to produce a record amount of gas something they might not be interested in doing with oil above $100 a barrel. Most nat gas producers are saying they will be producing less gas not more leading to worries that we will be short of supply when old man winter comes rolling around again. Not that he ever left. We have had a long term target of $700 on gas by 2015 and have written that and reported on the Fox Business Network that it will be almost possible to get to full storage by next winter. I am not alone in that assessment. The Wall Street Journal reported that natural-gas prices are too low and put the U.S. at risk of not having enough gas in storage next winter and even beyond, say Citigroup analysts in a note published yesterday. They point out like I have that supplies are at 11-year lows, after a tough winter fueled demand for gas-powered indoor heating and ate away at a majority of the nation's stored gas. The Journal says many analysts and traders argue that booming production levels, which are projected to hit another record high this year, will allow stockpiles to replenish. Citigroup has argued against this theory for months. A group of Citigroup analysts, led by energy strategist Anthony Yuen, published a note Thursday stating that production growth is likely to be less vigorous than current prices reflect. "The market seems to think future supply should be robust, summer could be mild and winter would unlikely be cold," the analysts write. Production will likely expand by 3 billion cubic feet per day compared to last year, the bank says, but that will leave inventories with just 3.45 trillion cubic feet of gas in storage by the end of October. In comparison, the five-year average for the final week of October is 3.848 tcf. Lower-than-expected production growth could even reduce supply levels through 2015, the bank says. As producers see more profit in drilling oil, which has climbed close to $100 a barrel in recent weeks, the count of natural-gas drilling rigs could fall too low to maintain robust production growth, even as drilling becomes more efficient, the bank says. Other risks include an unusually hot summer and reduced exports of natural gas from Canada. Front-month natural-gas prices recently traded up 1% at $4.407 a million British thermal units, with contracts for delivery in the spring and summer months holding between $4.40 and $4.50. Any of the above factors "could change abruptly," catching the market off-guard, according to Citigroup. "Prices should incorporate these high probability risks." I totally agree! Citi is right on! How about gold? Kitco reports that, “All eyes in the gold market will be on the monthly U.S. jobs report due out Friday, as traders look to see whether the economic recovery is strong enough to alter perceptions of how quickly the Federal Reserve might tighten its monetary policy. Some say the market may not react either way as violently as it has in the past, since policy-makers are already thought to be fairly committed toward tapering their monthly bond-buying program known as quantitative easing. However, market players are also thinking about just how quickly the Fed might start to raise short-term interest rates, although this is not expected until next year. Expectations are for the March jobs report to show the strongest employment gains in several months. “I don’t think the reaction will be as big as maybe some of the last ones we’ve had,” said Frank Lesh, broker and futures analyst with FuturePath Trading. “But in general, if you get a real strong number, I would expect that to be bearish gold.” And vice-versa, he continued. “Gold is still very sensitive to U.S. economic data…although it seems to me as if gold is sort of more accepting of the fact that tapering does continue. I don’t see as much concern in gold now that it’s started.” Phil Flynn, senior market analyst with Price Futures Group, commented that Fed Chair Janet Yellen, earlier this week, seemingly tried to send a message that she remains dovish and rates will remain low for some time. Previously, she had come off as more hawkish in mid-March when she suggested that short-term rates could start to rise as early as six months after the end of quantitative easing. “Having said that, the strength of the jobs market is one of the critical factors the Fed is going to look at to determine whether they should increase or decrease the pace of tapering and ultimately when interest rates should actually start to rise,” Flynn said. Thus, a “blockbuster number that knocks our socks off” is likely to hurt gold initially on ideas policy-makers might hike rates “sooner rather than later,” Flynn said. “On the other hand, if it’s a terrible report, it would probably get the market speculating that the time frame to start raising rates in 2015 could be even later….and if it’s bad enough, tapering could even slow. That would be more accommodative and would mean a weaker dollar and could get us a little bullish (in gold).” An as-expected report could mean some volatility both ways, with gold perhaps then resuming its uptrend, he added. |
Joe Friday-Bullish inverse Head & Shoulders for Gold Miners in play!
by Chris Kimble
|
CLICK ON CHART TO ENLARGE The Junior Gold mining ETF (GDXJ) finds itself at key price point right now. The ETF broke above falling resistance and it is now testing it as support, for the first time. At the same time this support test is taking place, GDXJ could be forming a bullish Reverse Head & Shoulders pattern. Joe Friday....IF this read is correct, GDXJ should move higher in price. |

Draghi Rebukes Lagarde and is Weidmann Going Soft?
Thanks a Bunch, but Keep the Advice to Yourself Please …The most amusing moment of Mr. Draghi's press conference after yesterday's ECB board meeting, was when he proceeded to put down the IMF's Ms. Lagarde who had only one day prior to the meeting admonished the ECB to step up its money printing efforts so as to counter allegedly 'too low' inflation (see “Lagarde Worries About ‘Not Enough Inflation’ Again”). The ECB once again left policy unchanged, instead continuing to rely on threats and/or promises (depending on whether one is a saver or a debtor, one can interpret its announcements as either one or the other) of what it would do if 'required'. As the WSJ reports, Draghi actually looked 'cross' for once, seemingly losing his usual detached cool. We think it's just theater, but anyway, here is what the WSJ wrote:
(emphasis added) As the WSJ points out though, the IMF actually isn't shy to dispense unsolicited advice to the Fed either, and in fact often does so close to FOMC meetings. In any case, it would be a big mistake to conclude from this that Draghi and Lagarde actually differ a great deal in their views. Our feeling is that Draghi merely wants to 'keep his powder dry' so as to be able to deploy further monetary loosening measures when the next panic strikes. As long as the waters are calm, why should the ECB do anything? The members of the council would probably see that as a waste of ammunition. Draghi certainly didn't hold back in terms of promises of what the ECB might yet end up doing (we are confident that it will indeed eventually implement all these steps). 'Unconventional measures' would be deployed, Draghi pointed out, all well 'within the central bank's mandate' – including 'QE' type interventions and the introduction of penalty rates ('negative interest rates') on excess reserves held by banks at the ECB. We think this latter proposal is certain to fail to have any effect, because banks will simply move their funds from the ECB's deposit facility to the current account facility. In any case, the object of these deliberations is precisely the same alleged 'problem' mentioned by Ms. Lagarde: 'too low inflation'. According to Draghi, the ECB board is merely not sure yet whether the recent decline in the euro area's HCPI is a 'transitory' or a 'structural' phenomenon. However, according the pundits at Bloomberg, “Europe's war against deflation” (laughing out loud is hereby expressly encouraged), is “already lost”. One can of course always hope, but somehow we doubt that the ECB's printing press is as rusty as these pundits assume. Meanwhile, the year-on-year growth rate of the euro area's true money supply remains at 6% at the time of writing. Some deflation!
The euro area's true money supply. All that 'deflation' could make one dizzy! - click to enlarge. Is Jens Weidmann Going Soft?This brings us to BuBa president Jens Weidmann, who recently signaled that he would be prepared to vote in favor of both types of policy 'if necessary'. The financial press was duly astonished at this seeming u-turn:
(emphasis added) With Weidmann changing his tune, there is seemingly no longer an obstacle to the deployment of 'QE' by the ECB. So has Weidmann really changed his views? We are actually not so sure about that. These statements may well have been the result of careful political calculations on Weidmann's part. While we don't want to rule out that the German government has given him a talking to behind closed doors and 'ordered' him to change his stance, there are other possibilities as well. For one thing, Weidmann may feel that by signaling that he is dropping his opposition to 'QE', the actual implementation of the policy may become 'unnecessary', due to the market reaction his statement provokes. In other words, if his comments lead to a weakening of the euro, the ECB will be less inclined to actually push for 'QE'. For another, Weidmann is surely aware at this point that the council would simply outvote him if/when push comes to shove. Since it is already certain that he will be outvoted, he has nothing to lose by signaling his seeming 'conversion'. On the contrary, it may help him increase his clout, since it can no longer be argued that he is simply refusing to support any measures proposed by others on the ECB's board. He is a team player now, instead of a continual thorn in the side of the council. As Commerzbank chief economist Jörg Krämer remarked in this context:
However, Mr. Weidmann may soon find that push indeed will come to shove and that he will then be forced to actually declare himself one way or the other by actually having to vote on such unconventional measures.
The euro against the dollar, weekly. The current level is seen as much too strong by Europe's mercantilist politicians – click to enlarge. |


Cyclical Reasonings
by Marketanthropology
| Beta continues to get squeezed, while the SPX skirts within a hair thin distance of yet another all time high. This week, the markets navigated through another stodgy den meeting at the ECB that was expectantly absent of action but full of promise - and into another monthly jobs report this morning that some might describe in the same way. Click to enlarge images
|


The European Open Mouth Committee – Real and Psychological Factors
ECB: What is its Talk Actually Worth?Many people are beginning to wonder these days how long the ECB's trick of promising action instead of delivering action will continue to 'work' (allow us to interpose here, that we believe the less they do, the better it is). To understand the activities of the ECB in recent times, one must keep in mind that central bankers far and wide have become convinced that their ' forward guidance' is an extremely powerful tool in the central banking 'tool-box'. We would argue that this is only a half-truth. It is true that psychological factors are an important driver of financial market activity, but if one analyzes historical contingencies on a case by case basis, one soon realizes that whatever psychological effects one was able to observe were always supported by real forces. In order to bring this into context with the ECB, it has often been argued that Mario Draghi, by merely holding out the promise of 'OMT', managed to steer the euro area's sovereign bond markets from panic to relative calm. Lately the 'calm' has actually evolved into a state of utter complacency:
Spain's 2 year government note yield: from total panic to serene complacency. Meanwhile, Spain's public debtberg has continued to grow by leaps and bounds – click to enlarge. The Real FactorsWe never believed that this was a realistic assessment, and felt that the promise would eventually be 'tested' by the markets. This certainly hasn't happened yet (quite on the contrary, markets act as if there were no longer any problems at all), but we are indeed able to enumerate the 'real' factors that have been the root cause of the improvement. In no particular order, these were: 1. A decline in trade and current account imbalances within the euro area, and the associated decline in the TARGET 2 payment system's imbalances. This was achieved by means of grueling recessions in the periphery and the re-nationalization of government debt financing (more on this below).
The decline of TARGET-2 imbalances in the euro-system - click to enlarge. 2. A vast surge in government debt purchases by banks on a national basis (said 're-nationalization'), with Italian banks and Spanish banks buying truly stunning amounts of the debt issued by their own governments. We cannot prove it, but we do believe that there exist sub rosa agreements that have made this possible. We can e.g. describe the process in some detail with respect to Italy: when the ECB announced it would offer 3 year LTRO funding (which would be extended 'if necessary') to euro area banks, the Italian government extended 'guarantees' to numerous debt securities held by Italian banks, in order to make them eligible for discounting with the ECB. It was a bit as if Worldcom were offering to prop up Enron. Here is how one of the tricks employed worked in detail: a) banks buy properties (old army barracks, office buildings, etc.) belonging to Italy's government, paying for them with Italian government bonds. b) the government leases the properties back from the banks. c) the banks turn these properties into ABS (asset backed securities). d) Italy's government 'guarantees' the ABS. e) the banks pawn the ABS at the ECB for ultra-cheap LTRO funding and use the funds received to buy more Italian government bonds. f) lather, rinse, repeat, ad infinitum. Note that the ECB is now effectively the owner of Italian army barracks, among other things.
Bank holdings of government debt by country, changes over several time period. Note the huge surge between Nov. 2011 and Mar. 2012 at Italian and Spanish banks (in blue) – click to enlarge. 3. A sudden strong increase in euro area money supply growth (which had collapsed close to zero year-on-year at the crisis peak), occasioned by the activities described under point 2, namely the massive extension of bank credit to governments in the wake of the LTRO. Note that it is completely erroneous to assert, as some observers have done, that the accumulation of excess bank reserves on the ECB's balance sheet means that banks 'are not using the money'. People saying this simply don't understand double-entry bookkeeping, or how money is actually created in the modern-day fractionally reserved pyramid scheme. We have discussed these points in great detail previously, but let us just reiterate here: the accumulation of excess bank reserves is definitely not an obstacle to the growth of circulation credit in the real economy. The opposite is actually true.
Euro area true money supply growth rate, year-on-year. Note the post LTRO surge – click to enlarge. 4. Other measures taken by the ECB that served to reliquefy the technically insolvent banks in the periphery, such as lowering the reserve requirement to a mere 1% (making 100:1 leverage possible with respect to the demand deposits of customers!), and a continual lowering of the eligibility standards for assets pledged with the ECB for refunding purposes (the ECB has ended up looking like a hopelessly over-leveraged hedge fund stuffed with toxic crap as a result). 5. And lastly, the fact that after several years of truly severe economic downturns, the economies in the periphery had been purged of a great deal of malinvested capital. At some point even the most painful recessions end of their own accord, namely at the point when capital has become cheap enough to compensate for the remaining risks and thus entice investors to step in, and the portions of the capital structure that have become entirely useless have been largely written off. Thus a recovery in euro area economic activity became a realistic prospect, almost regardless of the words and deeds of the central bank. 6. Lastly, several countries have enacted economic reforms, which although they don't nearly go far enough, have contributed to restoring a modicum of confidence. Conclusion:Our contention therefore is: the only reason why verbal intervention seemed to suddenly 'work' is that the underlying real factors supported it. Readers may recall that prior to 2012, the crisis continued to worsen, no matter what EU politicians or ECB board members said. It follows from this that 'verbal intervention' will cease to work once the underlying real factors are no longer supportive. With euro area money supply growth rates slowing down sharply recently, this point is presumably coming ever closer. Although a lot of malinvested capital has been liquidated or re-purposed as noted above, we can be fairly certain that the central bank's manipulation of interest rates and the money supply has arrested the liquidation process and created new malinvestments taking the place of old ones. Moreover, many of Europe's underlying structural economic problems remain unresolved, and the indebtedness of governments has continued to grow. Banks and sovereigns meanwhile are even more entangled than they were before. |


Dow Theory Confirmation – The Scandal
by Greg Harmon
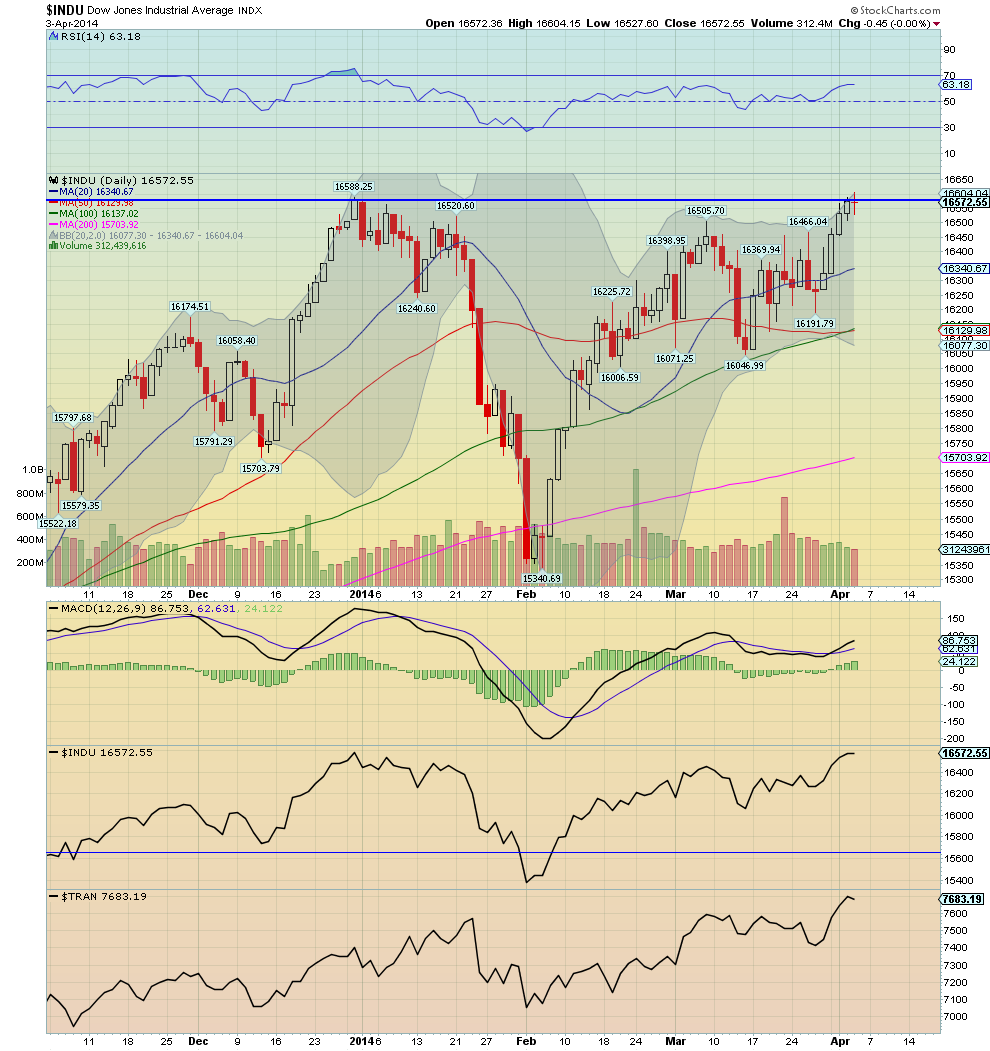
| Where Lorde is getting tired of being told to put her hands up in the air, I am getting tired of hearing the markets are rigged. In what I hope is the last time I hear it, Bob Pisani spent 10 minutes talking about it after he was given an award at the MTA Dinner last night. It has a overall a good speech and he also does not want to hear it, but talking about it for 10 minutes is an odd way to explain how you don’t want to hear it. End the discussion and lets move on already. And for us technical geeks I have just the thing to shift focus too. The Dow Theory confirmation signal that came Thursday. Or maybe did not show up. This has the makings of a real controversy. Here is the crux of this exciting issue. The Dow Jones Industrial Average made a new high touching 16588.25 in December 31, 2013. And Thursday it touched 16604.14 as the intraday high. There you have it. A new all time high in the Industrials to go along with the new all time high in the Transports. The Dow Theory confirmation signal. Primary trend higher is reconfirmed. But not so fast. Back in the days of Dow the only price there was to work with was the closing price. And if you look at the closing price on December 31, 2013 it was 16576.66. Thursday’s closing price was only 16572.55. In fact Wednesday’s close at also fell short. So to purists there is no confirmation of a new all time high. It still needs 4.11 points higher on a closing basis to achieve it. You can argue that in today’s world with instantaneous information sharing that the intraday level should suffice. But the counter argument is that this theory has stood for a very long time. Should it be messed with?
As a back story there are many that look at the Dow Theory with the Transports and Industrials (two of the 3 sectors including Utilities at the time) and see it as outdated. They have replaced them with the S&P 500 and the Nasdaq 100. Maybe the Dow Theory does not matter. The plot thickens. And then there are so many other indicators and signals that many question what value Dow Theory carries. To my perspective it carries a lot of weight because there are a lot of people that use it. But there are many other indicators and signals that also carry a lot of weight. Using many of them at once, what I call the mosaic approach, reduces the reliance on one quirky signal. I come down on the side of the the Industrials still needing to confirm on a closing basis. Where do you stand in this controversy. |
Natural Gas Weekly: Consumption sets winter record
U.S. Energy Information Administration
Natural gas consumption sets winter record, with residential/commercial sectors surpassing 50% shareTotal natural gas consumption in the United States rose to a record average of 90.6 billion cubic feet per day (Bcf/d) this winter, according to data from Bentek Energy. Cold weather drove total consumption up by 8% over last winter's levels, despite higher prices. Increases occurred in all major natural gas sectors, but particularly among residential and commercial consumers, whose combined consumption rose to more than half of total U.S. consumption this winter. Natural gas consumption also rose in the electric and industrial sectors, but to a lesser degree than in the residential and commercial sectors. This was largely because power generators' and industrial customers' consumption of natural gas is less sensitive to weather and more sensitive to price than is consumption from homes and businesses.
Residential and commercial consumption The contiguous United States saw a daily average of 23.5 heating degree days (HDDs, the variation of temperatures below 65 degrees Fahrenheit) this winter, 13% more than the average for both last winter and the previous five winters. Residential and commercial consumers increased their consumption to a greater degree in response to these colder temperatures than consumers in other sectors, as most of the natural gas consumed by homes and businesses directly involves space heating. This made the residential and commercial sectors less likely to curtail consumption when prices rose to more than $5.00/MMBtu on days between the end of January and the beginning of March. Residential and commercial consumption rose by 14% this winter, driving their share of total U.S. consumption to more than 50% for the first time since the 2010-11 winter season.
Industrial sector consumption Prolonged periods of bitterly cold temperatures this winter also contributed to higher levels of industrial sector consumption, because large industrial facilities needed additional gas for space heating. However, since like electric generators, industrial customers more frequently purchase natural gas with spot and futures contracts whose prices fluctuate daily, this winter's 33% price increase limited industrial consumption growth, which rose by only 2%, to 21.5 Bcf/d. As a result, the industrial sector's share of total U.S. natural gas consumption decreased to 24% this winter, from 25% last winter and 26% during the 2011-12 winter season. |


USA and EU: Banks Just Not Lending
by Pivotfarm
| So, they might be on the opposite side of the Atlantic Ocean, but the Europeans and the Americans have one thing very much in common. Their banks just aren’t lending to private individuals and let alone businesses. “Why not?” I hear you ask! It’s simple: the banks have better things to do with the Quantitative Easing that they have kindly agreed to take on; a lot better than giving it to the businesses. Heaven forbid, they might actually do something and earn a profit from it. There’s, it seems, a finite amount of profit in this world that somebody seems to have decreed as the maximum limit. The banks don’t want to let their share of the corporate finance pie go. That’s why. It’s not difficult to grasp; it’s not convoluted and painstakingly hard to get your hear around. The banks just don’t want to in a sultry sulky way, sitting in their corner, playing on their own. EU The banks are hoarding in the EU today and even more so ahead of the European Central Bank's ‘Stress Tests’. The Stress Test, or the European Central Bank’s Asset Quality Review is probably the biggest event that is going to happen all year long for Mario Draghi. Consumer spending and small and medium-size enterprises have financing that are loan-dependent in the European Union and the Asset Quality Review will (and already is) inevitably having an impact upon that. Eurozone economic growth has current estimates for next year standing at 1.8%. But, what Draghi wants is to see the opening up of alternative sources of lending to SMEs and private consumers so that the onus doesn’t lie entirely on the banks. But the AQR is based upon figures at the end of 2013 and it was thought that to look good banks would hold back on loans at that time. If the AQR were entirely at fault, then that would have righted itself in the early part of 2014. This is clearly not the case and we are still seeing a fall in the number of loans being made. The Eurozone lending to the private sector fell yet again in February. Perhaps the banks are partly to blame but who would take out a loan today given the economic situation that the messy EU has gotten itself into? The private sector has got cold feet. Loans to the private sector fell in the most recent data released by 2.2% year-on-year in February. That was after a 2.3% decline in January. The ECB has fixed the level of 4.5%, but it is well below what they would like. USA Would you believe it if you were told that the banks are now lending as much as they were in 2007? Would you see the knock-on effects in the USA of such fervent business activity, buzzing around you? But, not only is the Federal Reserve now a little worried that the banks are lending as much as in 2007 (although, please show us the effects if this is true), they still have more cash deposits and reserves than ever. The current dollar amount in banks stands at $10 trillion, which is $2.5 trillion more than being lent out ($7.5 trillion). Back in 2008, with the financial crisis there was a fall-short of $205 billion in favor of loans (exceeding deposits). Corporate borrowing currently stands at $1.7 trillion. February 2013 saw the biggest increase since 2008 in commercial and industrial loans (amounting to $38.3 billion). The banks are still hoarding money from the people that certainly need it in the US economy. The banks might be seemingly lending, but they are not lending enough and certainly not to private individuals or SMEs. The only ones they are deciding to lend to are the big fish, the blue-chip companies and the industrials, the ones that are benefitting already from the Federal Reserve’s Quantitative-Easing money on the stock market. The etymology of ‘to lend’ is an old Norse word that meant ‘to give as a gift’ or ‘to let have’. I can’t see anyone letting anyone outside of the banking circles have anything these days. Well, just like the Norse Viking settlers in Greenland, gorging themselves on seals and disappearing from the face of the Earth, the banks too will be in for a vanishing trick one day, because they will have been making pigs of themselves and gluttonously stuffing their bellies with a great big stash of Federal Reserve cash. Let’s hope that 500 years after their disappearance someone digs up something from an excavation that leads them to the real reason why the banksters vanished from the planet. No wonder the economy looks as if it has a face like a smacked butt these days, is it really? |
If Reflation Is Here, Then Gold Is Your Ultimate Hedge
By: GoldSilverWorlds
| Today’s market situation shows similarities with the reflationary periods of 1897 to 1914 and 1933 to 1939. As we all know, they ended in inflation and war. We are currently in a highly deflationary environment, and the banks are fighting this by pumping up trillions of liquidity in the system, hoping for a sustainable recover. At the same time, however, strongly opposing forces are at play destabilizing the whole globe (think of the Middle East, Africa, Ukraine). Given this evolution, and given that history rhymes, what can we expect going forward? Claudio Grass, managing director of Global Gold in Switzerland, sound money and monetary history specialist, discusses his view on the ongoing trend based on history with Casey Research (source). After 2008, the central banks tried to counter deflation by printing huge amounts of money. But the velocity of money, which is the credit in the system, is 30% down compared to 2008. It means that all the newly created “money” has not gone in the real economy. Most of the money has gone in the stock market, real estate market and government bonds. This could go on for a while. The outcomes, however, are limited. Deflation is one of them, but central banks will do whatever they can to avoid that. On the other hand, we can see hyperinflation, or a deflationary collapse, which both have the same outcome at the end of the day. This view is confirmed by Ray Dalio, who is the initiator of the following chart. If his expectations are correct, the chart suggests that we are about to experience a huge deleveraging, or, in other words, a long-term debt cycle fueled by the easy money of the past.
The chart could suggest that it represents a natural cycle, but one should not forget that these cycles are mostly artificial, as they are created by central banks and banking industry. So the cycle is rather created by mankind. The government debt bubble cannot be solved in a natural way, which leaves the option that debts will be wiped out. The gigantic artificial liquidity is simply not going to create wealth. If it were that easy to create wealth out of nothing, we could hand over every person $1,000,000 on a monthly basis (we all know this is not working). Currently, the system is going through a destabilization which coincides with the fight between the West and East. Meantime, most gold has moved from the West to the East for the last 14 or 20 years, which marks the shift of wealth from East to West. We now see the balance of power game, which is visible for instance in Ukraine. This is similar to the situation before WWI, when the British Empire followed the balance of power doctrine to Europe (they supported the second strongest in Europe to keep the balance of power). Likewise, the world experienced two huge reflationary periods, i.e. from 1897 till 1914, and 1933 till 1939 (before and after WWI). At the end of the day, most likely in the future it will be harsh. The question is: what will people make out of it? Will they understand that the actual system is not the one people should look for (that the government cannot protect them and that the government cannot give anything for free). Or will they chose for a system like the one in Switzerland, which still has a decentralized political system with a federalist structure, limiting the power of the government and politicians, coming much closer to a natural order than any other state on this planet? In this context, gold is and will be the canary in the coalmine. Rising gold prices reveal stress in the paper money system. The irony is that the paper price of gold suggests a bear market, while the physical market is very bullish. Since the price correction in April last year, the demand for physical gold tripled or quadrupled, depending on the area. 70% of all the gold refining goes through Switzerland. Claudio Grass confesses: “When I talk to the refineries here, their books are filled up until 2016. We definitely have to ask the question: if prices are based on supply and demand, why do we have such a low gold price versus a spiking physical gold demand?” Today’s artificial gold price is not sustainable longer term. The mining industry could reduce the capacity, some mines could even go bankrupt. That might result in a shortage if current gold owners do not sell their gold holdings and jewelry [which are being melted down for shipment to meet the demand in the East currently]. Claudio Grass believes that a loss of trust in paper money is brewing. Today’s circumstances already signal it, especially when looking at the geopolitical situations in North Africa, Asia and the borders of Europe (Ukraine). Participants are increasingly signaling a loss of trust in Western currencies, i.e. the dollar and the euro. With this de-stabilization the Western currency market becomes smaller. The financial system must come down (crash) before it can be rebuilt based on sound foundations. That will come with the crash of all paper currencies. In that transition period, gold will be the king, protecting the wealth and the hedge against the artificial wealth in the system. History has shown that debt defaults have occurred several times and the financial system has collapsed several times. In each instance, the only form of money that survived, was gold and silver. What the value would be is difficult to say. Besides, forget about dollars or euros, being paper currencies. That is not the correct measurement criteria. |

My Wish for 2016: We Finally Get a President Who Doesn't Kiss Wall Street's Rear End
by Charles Hugh Smith
| Is there any hope that we might actually elect a president with the mandate and courage to take down Wall Street instead of kissing its rear end in humiliating obeisance? |
How markets will react to Friday's employment report
By rod david
| If Friday’s Employment Situation report isn’t a surprise… then the market will be disappointed. Trending shallowly into Wednesday’s confirmation, and dipping most of Thursday, suggests the market is defensive — albeit while sitting at new highs. Cautiously optimistic. Yeah, what could surprise that posture. Pattern points… (Setups and technicals) Thursday’s dip into negative territory was recovered to essentially unchanged. Clearly, that’s where the market wants to greet Friday’s Employment Situation report. That doesn’t make one reaction likelier than another. But it is interesting for what was avoided. For example, dipping intraday created room to absorb initial buying pressure. One path down would have been to absorb an initially favorable knee-jerk reaction up. But that dip is already recovered. A new high close was just a handful of points higher, which would have fulfilled the outstanding objective of Tuesday’s confirmed breakout. Reacting down could have left no unfinished business above, but optimism remains in-check. Thursday’s low did leave outstanding an oversold RSI at 1875.50. But there is no time schedule required for its eventual retest. A knee-jerk reaction down to it would more likely recover to launch a rally into the afternoon, instead of breaking lower. But even a knee-jerk reaction up wouldn’t be assured of trending up into the close. What’s Next… (Outlook and opportunities) There usually isn’t relevant price action the night before Employment Situation reports, and no preliminary position is suggested — especially with the close being at unchanged. Look for at least one update overnight or ahead of the Morning Market Tour… My thoughts on the day’s econ calendar are linked here. |
The Energy “Crisis Curve” is Accelerating in a Dangerous Part of the World
By: Money_Morning
| Dr. Kent Moors writes: Sitting in a new land of plenty, Americans rarely notice disturbing energy trends elsewhere in the world. But in the course of my global work, it’s impossible not to recognize there are serious energy shortages developing in other parts of the world. In fact, I’m beginning to see worrisome indications this “crisis curve” is now accelerating. Oddly enough, the latest danger signals are coming in from parts of the world normally thought of as net energy producers: The Middle East, North Africa and Central Asia. Now, there are new concerns that this brewing energy crisis may well be the next serious step in an ongoing “Arab Spring.” And while countries like Saudi Arabia, Kuwait, and the United Arab Emirates have largely been untouched by this sweeping regional political unrest, elsewhere matters are getting worse. Suddenly, energy has become a bigger trigger point in a highly volatile part of the world… A Fast Growing Electricity Crisis Over the past week, new warnings have emerged in Egypt, Yemen, and Pakistan that the situation is deteriorating. In Egypt and Yemen, the crisis is a direct result of political strife. Both countries are facing a massive collapse in electricity availability because of the unrest. Egyptian energy officials are now publically stating the country could face a grid shutdown in the next few months, an effect of a systemic breakdown in both the generation and distribution components. In fact, even as Cairo seriously looks at massive imports of coal to arrest a fuel supply shortage, there are increasing questions about the ability of the infrastructure to even support it. Meanwhile, in Yemen, the problem is a direct result of opposition attacks on the electricity generation facilities themselves. As for Pakistan, they have been in dire straits for some time, as we have discussed here previously. The country has suffered through increasingly frequent blackouts and the inability to provide industries regular power for more than a few hours each day. That has a direct, and very negative effect, on production, employment and overall economic conditions. The Pakistani government in Islamabad had put their hopes on a combination of natural gas imports – pipelines from Iran and Turkmenistan, along with liquefied natural gas (LNG) coming to proposed new onshore and offshore terminals. But the LNG possibilities are facing significant investment difficulties along with a time delay for implementation that the country may not be able to weather. Then there is the added uncertainty of sourcing a regular supply of gas as the feeder stock for the LNG. Recently, there have been some indications it may come from Iraq, where the rise in oil production has resulted in a surfeit of associated gas that needs to find a market. Separate production in the autonomous region of Kurdistan in the Iraqi north is another possibility. Both, however, require their own pipeline systems – almost certainly running through Turkey – to move out the gas. What’s more, there is also the question of where the LNG would be liquefied for the tanker traffic to any receiving terminal the Pakistanis come up with. The primary conventional natural gas pipelines also have significant roadblocks and have experienced inordinate delays. The Iranian venture is now dead until such time as Western sanctions against Tehran are eased. The Turkmen venture is supported by Washington. Yet it is also dependent on the participation of an avowed enemy. India. In this case, the proposed pipeline would cross both Pakistan and Afghanistan. Yet the demand in both of these markets together is too small to justify the project. So the pipeline won’t be built unless it can reach just inside the border of India. This is the reason why the pipeline is known as the TAPI (Turkmenistan-Afghanistan-Pakistan-India). No India, no TAPI. Gaming the Energy Chessboard Of course, India has a huge energy shortage crisis of its own, one that has already cut into its economic performance and threatens to have a multiplier effect throughout the country. And while it has numerous domestic drilling efforts in the planning stages, including some huge proposed projects offshore in the Bay of Bengal, these will not be nearly enough. The Indian economy has been hit hard on the energy front from two directions. The first has been the sanctions against Iran. Aside from China, India has been the largest market for Iranian crude. In fact, Indian refineries are largely designed to operate on Iranian grade oil. But the collapse in international currency exchange to pay for the imports (a direct result of the global banking sanctions) added to the rising price and made matters very difficult for New Delhi. The second factor is perhaps the most obvious. India’s population has for some time exceeded the country’s ability to support it with any system of reliable energy. That population continues to grow. As a result, India has been negotiating with Pakistan for pass through access to the Turkmen gas. That would allow both nations access to essential energy, while Pakistan would also receive revenue from transit fees on the gas going over the border. Nonetheless, negotiations have been excruciatingly slow. The process has hardly been helped by radical groups in both countries who are set against any cooperation at all. Then there is the problem that TAPI has to move through areas controlled by radical groups in both Afghanistan and Pakistan. Neither central government can provide security in these regions nor has anybody come up with a genuine idea of who could provide the necessary protection. So once again, energy becomes the chessboard upon which geopolitics is played out. But you should note this very carefully: Energy prices are determined by the worldwide play of supply and demand. That means energy problems abroad will come back to effect even the most oil and gas endowed of nations Like us |
Rail Traffic Bouncing Back Strongly
By Cullen Roche
| There was a good deal of skepticism earlier in the year about the impact of weather and a slow start to the economy in 2014, but if rail traffic is any guide then we’re starting to see a significant bounce back. Intermodal traffic just reached its highest weekly reading in 5 months and has recorded its strongest three consecutive weeks since 2010. Here’s more via AAR:
|
No Earnings, Big Problems
by Bespoke
| Both the Dow and the S&P 500 held up well today, falling slightly but not suffering any kind of major setback. But not all was well in the market by any stretch, as we saw a lot of the "high-fliers" take nosedives once again. Companies can have the best long-term growth prospects in the world right now, but if they don't already have earnings, they're getting taken to the woodshed. A month ago, investors were paying sky-high premiums for companies that make no money now but have huge growth prospects, but those premiums are falling fast. In the Russell 1,000, there are 85 stocks in the index with negative trailing 12-month P/E ratios (negative earnings). Those 85 stocks were down an average of 1.78% today, and they're down an average of 3.9% over the last month. The other 932 stocks in the Russell 1,000 were down just 20 bps today on average, and they're up an average of 2% over the last month. Below is a look at the biggest losers in the Russell 1,000 today. There were 36 stocks in the index that fell more than 3.5%, which is a high number for a flat day in the market. As you can see, the large majority of the biggest losers today were stocks with negative or sky-high P/E ratios. And most of them were stocks that have also taken huge hits over the last month as well. Stocks like FireEye (FEYE), ServiceNow (NOW), Workday (WDAY), Palo Alto Networks (PANW), Tableau Software (DATA), Splunk (SPLK), Under Armour (UA), Facebook (FB), SolarCity (SCTY) and Pandora (P) are all names that have sky-high valuations and sky-high expectations, but they all got slaughtered today. These kind of stocks were market darlings in 2013 and early 2014, but the tide has shifted quickly since the beginning of March. Investors clearly want to own companies with strong fundamentals right now, and they're exiting the "high-fliers" that they were willing to own just a few weeks ago at a remarkable rate. What has really been amazing is that all of these huge declines have come during the earnings off season, and most of the companies that have taken hits did very well following their last earnings reports. The first quarter earnings season is coming soon (next week), so all these companies that have taken big hits lately will have a chance to prove investors wrong. Some will do so, and some won't.
|

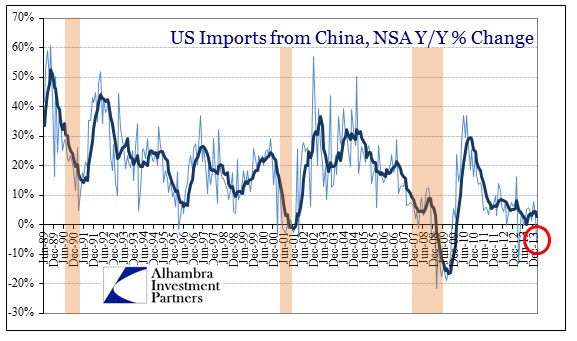
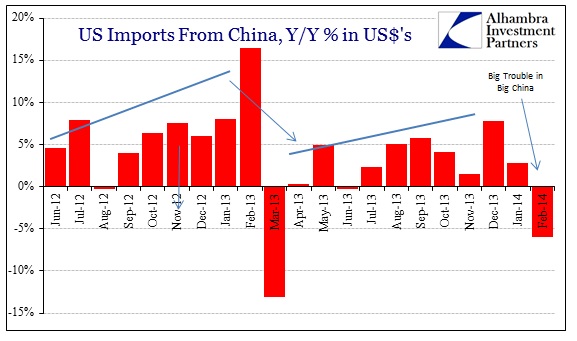
The Meaning of Weak February Imports: US Economy Not Decoupling, Not Accelerating
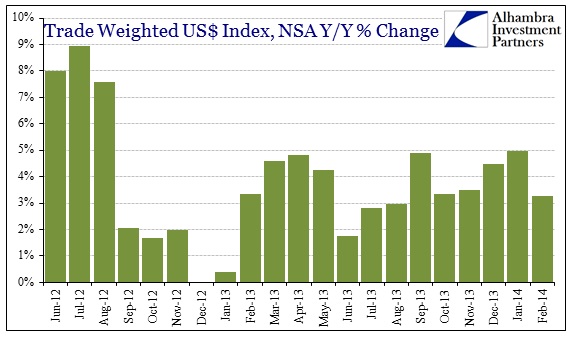
| The word decoupling has made a comeback in recent months. In 2008, it was believed that the world would be able to withstand a slowdown in US growth, as global markets would “decouple” from the primacy of US consumers. In some ill-conceived instances, it was even argued that financial markets would as well. Of course, we know that the interconnected nature of global finance (through eurodollars mostly) rendered such thoughts nothing more than flights of fancy, but the cursory attractiveness of this idea has persisted in real trade terms. The current incarnation seeks to solve the “mystery” as to why the US seems relatively robust in the face of obvious slowdowns elsewhere – most notably and dangerously with China. In a bit of a reversal, the US is thought decoupled and isolated from emerging markets turmoil (which includes both economy and finance). Even in a very basic sense of global trade and the supply chain, that could only be the case if there was a durable and evident internal change within the US. In other words, that would mean a total reversal of offshoring. There is a much easier explanation for this sort of “mystery”, namely that the original premise if flawed beyond repair. Looking at actual data (as opposed to sentiment surveys and other corruptions) you see quite clearly that the US is in no way different than the rest of the world. In fact, trade data, including today’s release, makes plain how the US fits within the wide reversal of the global supply chain, and thus global trade. I don’t usually refer to the US dollar indices of various types because I don’t consider them all that helpful. The US dollar “price” is driven far more by finance than trade, but I refer here to the trade weighted dollar index to eliminate any currency factor from the discussion. A “stronger” dollar is believed to be, in the simplest of orthodox terms, favorable toward imports, i.e., US consumers can purchase more imported goods per dollar.
According this index, the US dollar has continued to rise in relatively steady fashion, meaning currency terms should be favorable toward imports.
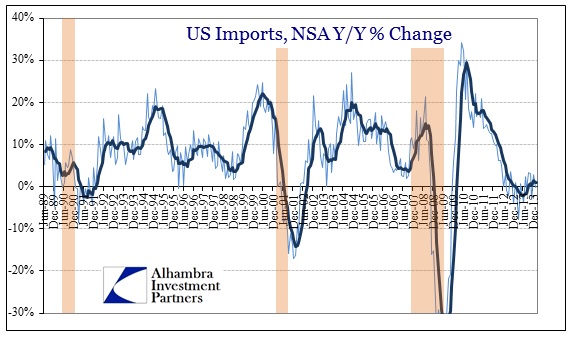
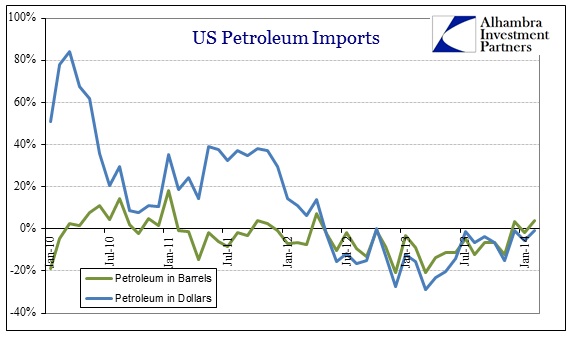
Looking at the actual data, we see that US demand for imports is at levels far more consistent with recession than anything else. While I have eliminated the US dollar as a potential culprit, there is the fracking boom in energy to consider. US imports historically have been driven by petroleum, so an increase in domestic energy production may well be the source of diminished pace of importation.
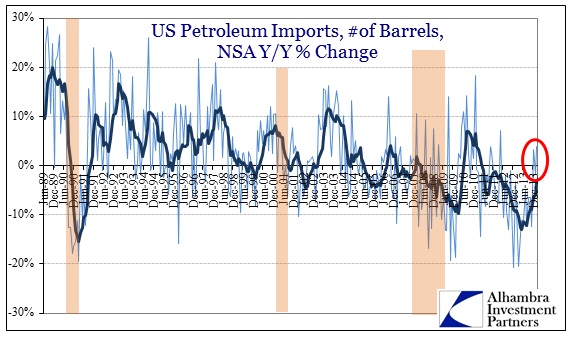
And that has been the case for much of the past two years. US imports of oil have fallen considerably. However, in two of the past three months US imports of oil have gained Y/Y – something that has not occurred since the end of 2011. So while the fracking and shale processes have dampened enthusiasm for foreign energy, we are beginning to see signs of an end to that marginally.
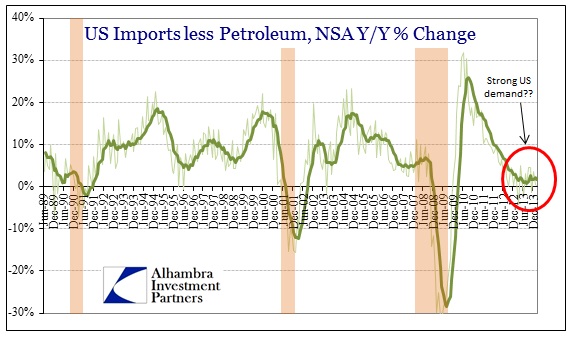
If we eliminate petroleum from the import figures, the pace of US demand for foreign goods still looks recessionary.
With those factors in mind, US trade in terms of the supply chain – US consumers buy products from manufacturers in Asia, who in turn buy resources from Brazil, Australia and elsewhere – shows exactly what you would expect given recent turmoil in exactly those places. American end market demand for the next level’s (namely Asia) produce is clearly a cause for contraction and instability further down the line.
First, and maybe most importantly, is China. The initial trade data on the Chinese side indicated a February collapse in exports to the US. That was pretty much confirmed by the Census Bureau estimates in dollar terms.
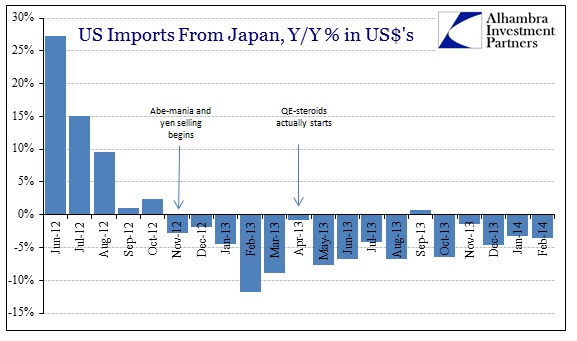
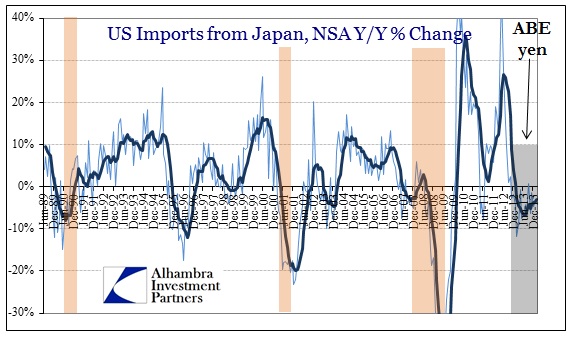
Given this data, we don’t have to wonder why the process of defaults has begun in the weaker Chinese firms. Without “unlimited” credit growth, there is no way businesses at the margins can continue to survive under these lackluster trade conditions. An export economy cannot long continue toward trend growth without similar and concurrent growth in its end markets (or else it will have to find other sources of growth, such as property bubbles). That also applies to Japan. In what can only be classified as a direct rebuke of Abenomics, Japan’s second largest export market refuses to “realize” and take advantage of the weaker yen. Again, a stronger US dollar against the yen is supposed to (according to orthodox theory) make Japanese goods far cheaper and more competitive in US terms. So it was simply expected that US imports of Japanese goods would surge.
Perhaps the entire economics profession needs to rethink the idea of ceteris paribus when constructing its theories and models. This data simply confirms all sides of the global trade contraction. There is no growing US demand for imported goods despite every orthodox measure to make it so. Further, that lack of US demand is eroding the supply chain as it wraps in various manners around the globe. There is no decoupling because there is no American economic acceleration. |
The Economic Catastrophe That Is Abenomics Sends Japanese Gas Prices To Five Year Highs
by Tyler Durden
| While we have heard all the usual excuses that "Japan had no other choices" and that Abe simply had to slay the "deflation ogre" (it is still unclear why deflation is bad for the common man, if quite clear why it is disastrous for massively insolvent and overlevered banks) the simple truth is that it was clear from the very beginning that Abenomics would be an abysmal failure. Ironically, in recent months the cheerleaders of Japan's last ditch effort to delay the inevitable have gotten a second wind: "look at all the inflation" they say, and point to it as evidence that Abenomics is indeed working. There is a problem - it is inflation of all the wrong "non-core" items. That inflation, it was also clear from the beginning, would surge. Read our take on just this from September:
In other words, all Japan managed to do is import the bad "non-core" inflation, which has sent food and energy prices through the rood (confused why the rest of the world is suffering from an episode of acute deflation? look no further than deflation-exporting Japan) and made "non-core" purchases like food and gas increasingly more unaffordable to the ordinary Japanese consumer. Today it just went from bad to worse, because as Nikkei reports, gasoline prices at the pump surged to a 5-year high in Japan this week, due to tax increases. The Oil Information Center says the average retail price was 164.1 yen, or about 1.6 dollars, per liter, as of April 1st. That's an increase of about 4.9 cents from the previous week.
More from Nikkei:
Actually gasoline sales, and all other sales will be weak for a long, long time. Why? The one reason all the above-mentioned cheerleaders of Abenomics fall strangely silent when it comes to the one all important, beneficial inflation that by now should have arrived. That of wages. Unfortunately for Japan and those same clueless economist cheerleaders, as we reported on Tuesday, in February Japan announced that not only has there not been any base wage inflation, but wages have now declined for a Lehman-crisis like 21 consecutive months.
So what next? Well, more pain until the locals get so sick of Abenomics, that Abe meets yet another prematue, Diarrhea-coated exit. Because while the Japanese stock market, which is still down materially YTD and hence instead of providing a "wealth effect" is merely adding to the "misery effect", may provide some temporary solace to those - about 20% or so - who are invested, everyone else is looking at even faster wealth destruction as the value of the Yen continues to slide, as "non-core" products like food and energy continues to rise to multi-year highs, and as wages continue to slide. This is what we said last time to summarize the dead end Japan is about to crash into head first:
All the same is true now. Only this time it's even worse. |


Subscribe to:
Comments (Atom)