Friday, June 7, 2013

Evening markets: rain fears lift new crop corn, soy futures

by Agrimoney.com

Oats got it right after all.

The grain, by Chicago tradition a leading indicator, had attracted comment by early on looking keenly to extend its succession of winning sessions to eight.

And it ended Friday with a 2.3% gain to $4.07 ½ a bushel for the July contract, taking its headway so far this month nearly to 9%.

Other grains indeed, more or less, followed after a humdrum start, although there was reason other that the adage "oats knows" given for the increases.

'One significant weather debate'

The main one was the wet tone to the Midwest weather outlook, when farmers are looking to wrap up their corn sowings and catch-up on soybean plantings too.

Prices appreciated from a weak start thanks to forecasts of "a wet weekend of weather and concerns about finishing corn planting, especially across Iowa, offering support", Benson Quinn Commodities said.

Not that all the forecasts are in agreement.

"The market has come down to one significant weather debate," Darrell Holaday at Kansas state-based broker Country Futures said.

"The GFS model has continually indicated a system moving down through Iowa at midweek next week and the European model indicates that system will stay north and will not move down through Minnesota, Iowa and Illinois."

'Not want to get caught short'

Why this matters is that planting looks set to be halted again this weekend, notably in the key state of Iowa, as a band of rains moves through.

"If the midweek system does not occur, farmers will be back in the field by midweek and would likely finish up by June 15," Mr Holaday said.

However, for now, Benson Quinn said that "the trade does not want to get caught short if Iowa does see upwards of 2 inches of rain" this weekend, as some forecasts show.

And this ahead of Monday when the US Department of Agriculture will unveil its next set of keenly-watched planting progress numbers.

Key figure

"Trade looking for corn to be 95% planted and beans 70% planted come Monday's crop progress report," Benson Quinn said.

At Chicago broker Rice Dairy, Jerry Gidel said: "I'm not sure how they will get above 93%," after wet conditions this week," although in Illinois they may have managed a better shot and got something done."

But the exact figure matters, given that the sowing season is now approaching its close, and with every percentage point equating to nearly 1m acres of corn that could end up abandoned, or switch to another crop.

New crop December corn added 1.9% to $5.58 ½ a bushel, with its chart picture improving too as it crossed decisively back above its 100-day moving average.

'Roll starts today'

For soybeans, the end of the sowing window is a little more distant, making the rains a little less crucial – and, indeed, with the prospect of some lost corn acres switching to the oilseed.

Still, investors injected risk premium on the idea of farmers maintaining a below-normal pace, and the new crop November lot added 1.9% to $13.30 ¼ a bushel, a four-month high for the contract.

That was significantly better than old crop July soybeans could manage, ending up 0.1% at $15.28 ¼ a bushel, depressed by the onset of the Goldman and UBS commodity index rolls, in which index funds sell out of nearby lots, ahead of expiry, and switch into later-dated contracts.

"Goldman roll starts today – selling the July and rolling long positions to the September and November contracts," Benson Quinn said.

Old crop July underperformed too, in adding 0.5% to $6.66 ¼ a bushel.

'Not backing off at all'

Soybeans' decline was also hastened by the drop in soymeal, included in the UBS index for the first time this year, which fell 0.3% to $452.50 a short ton for July delivery – while soaring 2.2% to $396.60 a tonne for December delivery.

The moves defied continued surprise over the extent of near-term US soymeal exports, which came in at a solid 134,000 tonnes for old crop in the latest US export sales data, released on Thursday.

That took the total exported or ordered for 2012-13 to 9.2m tonnes, well above the 9.0m tonnes forecast by the USDA fort the whole season.

"Old crop soymeal sales were at higher end of trade expectations which leads to concerns the USDA is understating soybean crush," Paul Georgy at Allendale said.

Country Futures' Jerry Gidel said: "Importers are not backing off at all. And this when Argentina is meant to be around the corner with all the supplies you could need."

Japan wheat snub

Wheat lost around too, albeit not a huge amount, with Chicago's July contract ending down 0.2% at $6.96 ¼ a bushel.

It can be tricky for the grain to rise at this time of year anyway, as harvest ramps up, bringing a spike in supplies and so adding price pressure.

But weakness was exacerbated by a refusal by Japan, as it purchased 164,000 tonnes of wheat from Australia, Canada and the US, to buy US western white wheat for a second week in a row over the finding of genetically modified plants in Oregon.

The refusal added to ideas that the GM furore, involving a Monsanto strain of which development stopped eight years ago, has legs yet.

'Large wheat stocks are left'

Minneapolis spring wheat did a little better, in holding its ground at $8.05 a bushel for September delivery, given some support by the rain delays to sowings in North Dakota – even if farmers over the border in Canada are doing better at planting.

But in Europe, Paris wheat for November eased 0.2% to E204.00 a tonne, while London wheat for November fell 0.2% to £175.25 a tonne, the contract's weakest close in seven months.

"The UK balance sheets would suggest large wheat stocks are left," David Sheppard at UK grain merchant merchant Gleadell said.

"With weather conditions improving, limited demand and harvests set to commence soon [on the Continent], old crop values could soon lose their premiums over new crop, and long holders should consider selling."

Softs soften

For soft commodities, macro markets had more of a say in price moves, and in particular a return to the Brazilian real to depreciating against the dollar.

As the dollar recovered on Friday - helped by some well-received US jobs data, albeit statistics which unnerved some markets such as copper in raising the threat of a removal of quantitative easing – the real topped 2.15 to the greenback, its weakest level since May 2009.

With Brazil the main producer and exporter of many soft commodities, such as arabica coffee and sugar, that sent New York's dollar-denominated futures prices lower too.

Raw sugar for July dropped 0.3% to 16.43 cents a pound, with July arabica coffee faring particularly badly, slumping 1.9% to 126.95 cents a pound.

Cotton, for which Brazil is not such an issue, eased the minimum 0.01 cents to 84.86 cents a pound for July as investors pondered what to make of China's announcement that it is reviewing its controversial stockpiling programme.

See the original article >>

The Obama Energy Agenda: Gas Prices 2013

by Randy

The Obama Energy Agenda: Gas Prices 2013 infographic

Employment - The Macro Trends

by Lance Roberts

The May jobs report came in better than expected at 175,000 jobs with the labor force ticking up slightly from the lowest levels since 1979.  With the markets deeply oversold on a daily basis the report provide the catalyst necessary for traders to return to the stock market.  However, what we need to know from an economic perspective, as well as a long term investment view, is what does 175,000 jobs actually mean?  Putting economic data into context gives us a much better picture of where the overall economic trends are and what we should be expecting in the months and quarters ahead. 

Population Growth Still Outpacing Employment

As we discussed yesterday in "4 Tools Of Corporate Profitability" the issue of increases in population relate directly to employment growth.  As I stated:

"...despite increases in employment in recent months it has been a function of population growth rather than a improved outlooks by businesses. The issue of population growth is ignored by most analysts and economists when discussing employment. However, when businesses are geared for a certain level of demand, increases in population will incrementally increase demand requiring fractional increases in business productivity and output. However, in order to keep costs minimized businesses have resorted to temporary hires rather than full-time employment which incurs additional costs of benefits and health care. The expectation is that temporary workers will eventually become full-time employees, however, with the impending effects of higher health care costs due to the Affordable Care Act - temporary hires may be the new normal. The chart below shows full-time employment relative to the population."

Employment-population-growth-060713

There is little debate that the current labor market is very tight.  We know this by looking at the median duration of unemployment, which remains extremely elevated from a historical perspective and the labor force participation rate remains near its lowest levels since 1979.

employment-duration-and-participation-060713

Within this context we can surmise that businesses are maintaining minimum staffing levels to meet current demand.  As stated above increases in population create additional demand which is met with incremental hiring.  Unfortunately, many of those jobs are in the low wage paying service based categories which keeps wages and income growth suppressed.

The Real State Of Employment

In order to put perspective on the current employment situation we need to step back and take a look at the long term view of employment in the U.S.  The chart below shows the growth in the number of employed persons since 1948 along with a growth trend line.

Employment-RealSituation-060713

While growth in the labor force ebbed and flowed over time remained contained within a 5% band above and below the long term trend line.   That is until 2008 when the deviation from the previous 60 year trend plunged to over 11%.  As of May 2013, despite claims of economic and employment recovery, the deviation of employed persons from the long term growth trend is a negative 11.5%.  This is only 0.2% above the historic low of 11.7%.

If we dig a little deeper into the data from 2009 to present we can see the real disparity in hiring trends.  The chart below shows the change in full-time versus part-time employment.

Employment-Full-Part-2009-060713

While there is no argument that full-time employment has most definitely improved since 2011 it has been part-timers finding a bulk of the jobs.  Since 2009 part-time employment is up 1.3 million while full-time is only up 418,000.   This goes a long way to explain the surge in food stamp participation rates.

Economic Reports Don't Support Further Gains

One important point to remember is that corporate hiring decisions are grossly affected by the overall strength or weakness of the economy.  In the recent post "Economic & Employment Composites Indicate Further Weakness" I specifically addressed the employment issue stating:

"If you strip the employment components out of the EOCI index and weight them into their own composite index we find that the hiring intentions of employers is clearly weakening. The chart below shows the Employment Index smoothed with a 4-month average and compared to the annual rate of change in Total Non-Farm Employees."

STA-Employment-Index-vs-Employment-052013

"As with the EOCI index above - employment activity clearly peaked in early 2012 and has begun to wane. The recent uptick in the employment index, remember this is a 4-month moving average, is due to the effects from the uptick in economic activity from "Hurricane Sandy." This index will turn down in the next couple of months as the recently monthly data points have declined.

What is clear from the two composite indexes is that the broad economy, and by extension underlying employment, has clearly peaked and has began to weaken. This is well within the context of historical trends and time frames. While the mainstream analysts and economists continue to have optimistic views for a resurgence in economic activity by years end the current data trends, both globally and domestically, suggest otherwise."

Part-Time For Economic Reasons

This problem with part-time employment is that it does not increase economic prosperity.  Part-time employment, as discussed in the "Labor Hoarding Effect," has been an aggressively used tool by corporations to suppress wage growth, reduce overhead costs and increase profitability.  The problem is that with the Affordable Care Act gearing up to start in 2014 even more businesses will resort to part-time employment to reduce the increased health care tax burden. I stated that:

"The issue of 'labor hoarding' is an important phenomenon that is likely obscuring the real weakness in the underlying economy. Without an increase in the demand part of the equation businesses are likely to continue resorting to further productivity increases to stretch the current labor force farther to protect profitability. However, as we may currently be witnessing, businesses may be reaching the limits of what they can do to continue increasing profits at the bottom line while revenue declines at the top. The implications for the financial markets going forward are clearly negative."

There has been little improvement in the number of people working part-time for economic reasons.  However, as I stated, such weak employment leads to dependence of government subsidies which explains the rise in disability claims and food stamp participation as individuals seek to make ends meet.

Employment-Parttime-060713

The problem is that suppressed wage growth leads to weaker consumer demand which keeps businesses on the defensive to protect profitability.  This can be seen by the commercial lending versus job trends chart below.

Employment-commerciallending-060713

Depsite historically low borrowing rates for businesses the demand for loans appears to have peaked for the current economic cycle.  In turn if businesses are cutting back on borrowing for capital investments the need to hire additional employees will likewise be scaled back.

"Muddle Through" Employment

One thing is for certain -- the job market is very tight as layoffs and discharges have reached the lowest levels since the turn of the century.  While this is leading to lower initial jobless claims it is not translating into higher levels of full-time employment relative to the population.  This is shown in the chart below.

Employment-fulltime-joblessclaims-060713

The "good news" is that for those that are currently employed - job safety is high. Businesses are indeed hiring; but prefer to hire from the "currently employed" labor pool rather than the unemployed masses. Furthermore, the weak state of employment is likely to keep the Fed engaged in its current liquidity programs for longer than previously expected.  With the debt ceiling debate just around the corner and weak economic reports it is simply too soon to start taking away the "punch bowl."

It is not surprising that with an economy that is mired at a near 2% economic growth rate that employment is "muddling" right along with it.  While the economy is indeed creating jobs, as I previously stated, it is a function of population growth rather than a sign that the economy is on the road to recovery.

What is clear is that current detachment between the financial markets and the real economy continues.

See the original article >>

The Caracas Stock Market, The “Best” In The World, Is Not As Good As It Seemed

sg2013010385352

Caracas Stock Index during 2012

I keep reading these articles about the Caracas Stock Market being the “best” market in the world in 2012 and I am a little amused by the explanations, which tend to concentrate on the fact that President Chávez was ailing. There is a pretty good article here, but I am quoted in it, so I prefer to give my complete opinion.

Let’s start at the beginning, what is the definition of best?

If best is the market that went up the most, the question is: In what currency? Because if the Caracas Stock Index went up 302%, it did so in Bolivars, the local currency, which is fixed, controlled and established by Government fiat at Bs. 4.3 to the US$.

But…

the unspeakable, illegal, black market rate, which does not exist, actually devalued 50% in 2012, so that in US currency, if you managed to find someone that sold you US dollars, the Venezuelan Stock Market,went up “only” 150%, which brought it from the top performing market in the world, to the top performing market in the world, because the second best was Greece, up only 32%.

But again, the best?

Try to find some shares, without raising the price…

Well, let’s say the best market is the one that is covered by many analysts. How many do cover the Venezuelan Stock Market?

Umm, I think I am the only person left. Yeap! The only person that still writes regularly about the Caracas Stock Market in the world. If I am not, please write to me, we should talk once in a while, we are a pretty lonely hearts club, if you exist (I write a weekly report with market and company news and a monthly report for Veneconomy)

But let’s recall that the Venezuelan Government intervened, trampled over and busted 48 brokers in 2010, turning the market into a less of a market, as the most important players were simply wiped out. Some jailed. By now, only bank brokers actually do most of the tradings. The market has been diminished, minimized.

How much? Well, the stocks that trade in the market have a value of about US$ 7 to 8 billion in an economy worth about US$ 300 billion, that is all the market is worth.

But. How much is traded every day? Well, not much. Because the average daily trading volume was US$ 500 thousand in 2012. Not much. Think about it. If ten clients buy fifty thousand dollars, that is it!

Even worse, only 43 days in the year had a volume of more than half a million dollars. And 136 days had volume of less than US$ 50,000. Yeap! More than half the days of the year had volume of barely US$ 50,000. And all this at the official rate!!! Use the parallel rate and it gets really depressing, divide by four!

In fact, there were many days (about a dozen) in which no stocks traded. Not at all. Not one. In fact, there were 105 days in which less than 10,000 shares traded. An some of them are worth less than one Bolivar. Even worse, there were 24 days in which less than 1,000 shares traded.

So, why did stocks go up so much in 2012?

Easy:

1) Banks make money hand over fist in Venezuela thanks to revolutionary stupidity or largesse, they pay big dividends. As an example, Banco Provincial had a return on equity of 48% in 2012. It’s dividend grew 35% and for the full year, it paid a 14% dividend. Add the capital gains and the total return on its shares was 213% in a country where a CD pays 10% and inflation closed at 19.9%, if you believe Government figures. (I don’t, they said it would be 20%, funny, a 0.1% error and the third worst inflation in the world) Nice investment if you can get some shares, which is really hard.

2) Since Venezuela has strict foreign exchange controls, there are very few ways to protect the value of your money. You can buy “real assets” like a car, real state or other hard goods. But if you are an insider at any of the companies that trade, you can buy your own stock, which is cheap and most likely pays a good dividend too. In fact, much of  the large volume in the market were large “cross trades” performed by the broker of the bank whose shares were being traded.

3) Of the 16 shares in the Caracas Stock Exchange, three don’t trade. Cemex I and II, because the Chavez Government nationalized the company, paid Cemex for its assets, but left the minority stockholders hanging out to dry (So did Cemex). The shares have not traded since August 2009. Sivensa no longer trades either. The Government nationalized  half of the company in 2010 and the other half recently leaving the company with few assets.

4) You can buy Government owned companies, like CANTV and Banco de Venezuela, in the expectations that if there is change, they will be worth more or even privatized.

5) Investors know that a devaluation is coming, which benefits industrial companies or banks that are allowed 15% of their capital to be in foreign currency. Investors tend to rush to buy first, before this happens. Think Japan the last month, the currency devalues, the stock market goes up.

6) And yes, people did play Chavez’ illness. However, the market went up all year, whether he was fine or not, as shown in the graph above. Note the big spike in October right before the election, as some overly optimistic Venezuelans drove shares up. But also note that it went down, but recovered fast and by the beginning of November it was rising going to all time highs by December 1st.

But in the end, realities are what they are: It is impossible for a foreigner (or almost) to buy local shares. He would have to exchange currency at the official rate and or the black market, Foreign investors simply don’t like that. But even if they could, how much could they invest in a market that does US$ half a million a day?

Not much really, because these statistics are distorted by large cross trades.

So, the Caracas Stock Market is simply an oddity. Only Venezuelans allowed. A weird “market” which is not truly a market and whose movements respond to many weird variables and distortions created by the Chavez administration over the last 14 years.

But it is not the “best” market in the world, just the one that mathematically went up the most in a currency that nobody knows what it is worth.

And given the volumes, it takes very little to move prices.

But do you want a good investment in 2012? If you had bought PDVSA 2022 bond in US$, you would have paid 84% on Jan. 1st 2012. It was up to 117.5% today and you collected 12.75% in interest thanks to the stupid “revolution”. That gives you a total return of 55.41% in 2012 in US$, not in some controlled, trapped currency, called Bolivars. And a liquid bond, not some illiquid stock, quoted in Bolivars.

¡Viva la revolución!

Time to sell? You bet, very soon, very, very soon.

See the original article >>

The Obamacare Effect on Unemployment

by Mike "Mish" Shedlock

Initial Reaction
The establishment survey showed a gain of 175,000 a reasonably good but not spectacular print. The bright spot was involuntary part-time employment only rose by 26,000 so most of the jobs were (for a change) full-time jobs.
The civilian labor force rose by 420,000 for a change, enough to raise the unemployment rate 0.1 percentage points to 7.6%.
The Participation Rate rose 0.1 to 63.4%, just off the low of 63.3% dating back to 1979.


Obamacare Effect
Given there was not a huge jump in part-time employment this month, the bulk of the Obamacare effect of employers reducing hours from 32 to 25 (and hiring hundreds of thousands of new employees to make up the hours) may have mostly played out.


Nonetheless, expect lingering effects because any new business will be affected, as will businesses seeking to expand. See personal anecdotes at the end of this post for additional discussion.


May BLS Jobs Statistics at a Glance

  • Payrolls +175,000 - Establishment Survey
  • US Employment +319,000 - Household Survey
  • US Unemployment +101,000 - Household Survey
  • Involuntary Part-Time Work +26,000 - Household Survey
  • Voluntary Part-Time Work -12,000 - Household Survey
  • Baseline Unemployment Rate +0.1 - Household Survey
  • U-6 unemployment -0.1 to 13.8% - Household Survey
  • The Civilian Labor Force +420,000 - Household Survey
  • Not in Labor Force -231,000 - Household Survey
  • Participation Rate +0.1 at 63.4 - Household Survey


Revisions
The change in total nonfarm payroll employment for March was revised from +138,000 to +142,000, and the change for April was revised from +165,000 to +149,000. With these revisions, employment gains in March and April combined were 12,000 less than previously reported.


Recall that the unemployment rate varies in accordance with the Household Survey not the reported headline jobs number, and not in accordance with the weekly claims data.
Quick Notes About the Unemployment Rate

  • In the last year, those "not" in the labor force rose by 1,741,000
  • Over the course of the last year, the number of people employed rose by 1,596,000 (an average of 133,000 a month)
  • In the last year the number of unemployed fell from 12,695,000 to 11,760,000 (a drop of 935,000)
  • Long-Term unemployment (27 weeks and over) was 4,357,000 - a decline of 1,028,000 from a year ago
  • Percentage of long-term unemployment is 37.3%. Once someone loses a job it is still very difficult to find another.
  • 7,904,000 workers who are working part-time but want full-time work. A year ago there were 8,116,000. There has been little improvement in a year. This is a volatile series.


May 2013 Jobs Report
Please consider the Bureau of Labor Statistics (BLS) April 2013 Employment Report.
Total nonfarm payroll employment increased by 175,000 in May, and the unemployment rate was essentially unchanged at 7.6 percent, the U.S. Bureau of Labor Statistics reported today. Employment rose in professional and business services, food services and drinking places, and retail trade.


Click on Any Chart in this Report to See a Sharper Image


Unemployment Rate - Seasonally Adjusted

Month to Month Changes

click on chart for sharper image


Hours and Wages
Private average weekly hours were flat at 34.4 hours. Average hourly earnings of all private workers rose $0.01 to $23.89. Average hourly earnings of private-sector production and nonsupervisory employees was also up $0.01 to $20.08.


Real wages have been declining. Add in increases in state taxes and the average Joe has been hammered pretty badly. For 2013, one needs to factor in the increase in payroll taxes for Social Security.


For further discussion of income distribution, please see What's "Really" Behind Gross Inequalities In Income Distribution?


BLS Birth-Death Model Black Box
The BLS Birth/Death Model is an estimation by the BLS as to how many jobs the economy created that were not picked up in the payroll survey.
The Birth-Death numbers are not seasonally adjusted, while the reported headline number is. In the black box the BLS combines the two, coming up with a total.
The Birth Death number influences the overall totals, but the math is not as simple as it appears. Moreover, the effect is nowhere near as big as it might logically appear at first glance.


Do not add or subtract the Birth-Death numbers from the reported headline totals. It does not work that way.


Birth/Death assumptions are supposedly made according to estimates of where the BLS thinks we are in the economic cycle. Theory is one thing. Practice is clearly another as noted by numerous recent revisions.


Birth Death Model Adjustments For 2012

Birth Death Model Adjustments For 2013


Birth-Death Notes


Once again: Do NOT subtract the Birth-Death number from the reported headline number. That approach is statistically invalid.


In general, analysts attribute much more to birth-death numbers than they should. Except at economic turns, BLS Birth/Death errors are reasonably small.
For a discussion of how little birth-death numbers affect actual monthly reporting, please see BLS Birth/Death Model Yet Again.


Table 15 BLS Alternate Measures of Unemployment

click on chart for sharper image


Table A-15 is where one can find a better approximation of what the unemployment rate really is.
Notice I said "better" approximation not to be confused with "good" approximation.


The official unemployment rate is 7.6%. However, if you start counting all the people who want a job but gave up, all the people with part-time jobs that want a full-time job, all the people who dropped off the unemployment rolls because their unemployment benefits ran out, etc., you get a closer picture of what the unemployment rate is. That number is in the last row labeled U-6.


U-6 is much higher at 13.8%. Both numbers would be way higher still, were it not for millions dropping out of the labor force over the past few years.


Labor Force Factors

  1. Discouraged workers stop looking for jobs
  2. People retire because they cannot find jobs
  3. People go back to school hoping it will improve their chances of getting a job
  4. People stay in school longer because they cannot find a job


Were it not for people dropping out of the labor force, the unemployment rate would be over 10%. In addition, there are 7,904,000 workers who are working part-time but want full-time work. A year ago there were 7,618,000. There has been no improvement in a year. This is a volatile series.
Grossly Distorted Statistics


Digging under the surface, much of the drop in the unemployment rate over the past two years is nothing but a statistical mirage coupled with a massive increase in part-time jobs starting in October 2012 as a result of Obamacare legislation.


Personal Anecdote
As a personal anecdote, I was in the Traverse City, Michigan area this past week, a very nice town with nice shops in the downtown area. I asked one of the clerks about the number of hours she was working and they were reduced from 32 to 25, same as with numerous other shops on the same street. She did not understand why. She does now.
I have asked waiters in many cities similar questions over the past few months and have received many similar answers.


Multiply this scene by hundreds or thousands of shops in thousands of towns and the reduction from 32 to 25 hours coupled with additional hiring to make up the needed hours played a significant role in distortion of normal hiring patterns and unemployment statistics.

See the original article >>

3 Big Reasons Commodity ETFs Aren’t Getting the Job Done

by Attain Capital Management

The tendency of investors to jump on board with an investing thesis just before it turns sour is almost legendary. Attracted to the hottest investments like moths to a flame, they flutter in just in time to see the fire go out, and get stuck in a puddle of rapidly-cooling wax. Forgive us for stretching that metaphor, but you get the idea – chasing hot investments is as problematic as it is popular.

And when the boom in commodity prices in the early 2000s hit, it was no exception. Investor dollars lined up by the billions seeking commodity exposure, and financial engineers responded by providing a retail option for the masses – commodity ETFs.

The idea behind them was simple. Take some of your stock exposure and diversify it into another asset class, one which has been going up like crazy and feeds into the fear/excitement/confusion over the growth of China. Investors were asking, “where do I sign up?”

Have commodity ETFs been the diversifier people were looking for? Has that China thesis played out? Has an allocation to commodities helped portfolio performance? Not by a long shot… Most commodity ETFs continue to have three big problems: high volatility, -50% to -90% down moves, and a built-in performance drag from the so called negative roll yield.

What Goes Up…

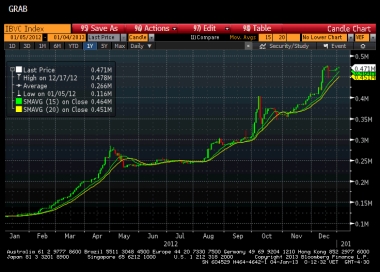
But first, back to the beginning. The dot-com crash didn’t just cap off the ‘90’s with a gut-punch to most portfolios – it also sparked investor demand for some true diversification – alternatives exposure. As usual, investors waited until after they had experienced the worst of the downturn in stocks before starting to look for something that wouldn’t be plummeting at the same time as their equity allocation. And taking a look around from 2002 to mid-2008, commodity prices were running up like mad.

Commodities were doing great

Source: Dow Jones-UBS Commodity Index Total Return Index. Disclaimer: past performance is not necessarily indicative of future results.

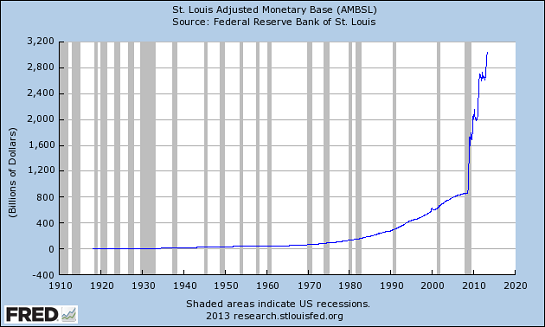
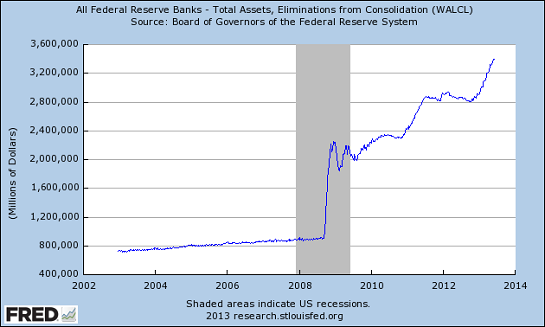
It wasn’t long before the trend had generated its own buzzword – the “Commodity Supercycle.” The thesis was that we were on the cusp of a huge run up in commodity prices. Jim Rogers and others like him trumpeted the praises of long-only commodity investments to anyone who would listen (and, in his case at least, continues to trumpet). Commodities had much higher to go, they said. Resource-hungry China and the rest of the developing world were going to send demand for raw materials soaring. After the financial crisis hit and central banks the world over responded with monetary easing, the “commodities must go higher” crowd had another argument in their arsenal – that rampant inflation would soon send commodity prices even higher.

And with so much demand for these products, companies were falling over each other to launch new commodity ETFs. Today there are hundreds to choose from, including single market funds, sector funds, broad commodity index funds, leveraged and inverse leveraged funds… And in the space of a few years, they have amassed huge sums of capital – currently nearly $140 billion is invested in commodity ETFs.

Must Come Down…

And then… Oops. Talk about bad timing. From 2008-present, commodities have been in one seriously ugly bear market. (And this is why we say long-only isn’t such a good idea after all).

But lately, commodity prices have lagged

Source: Dow Jones-UBS Commodity Index Total Return Index. Disclaimer: past performance is not necessarily indicative of future results.

The Dow Jones-UBS Commodity Index Total Return Index lost -42% from the ’08 peak. For individual markets, it was even worse. Oil futures lost nearly -77% from peak to valley, and remain more than -36% below the ’08 peak. Natural gas futures lost -86% from peak to valley, and are still down more than -70% from the peak. Not a ringing endorsement for the long commodities crowd.

And that’s to say nothing of the volatility. Think the stock market is prone to whipsaw behavior? Individual commodity markets saw much larger price swings than stock investors may be used to.

Commodities can be very volatile

There’s a reason that regulations require we say futures investments come with substantial risk and aren’t for everyone.

Of course, the losses weren’t uniform – gold and silver, for example, seemed immune to gravity for quite a while, continuing to climb well into 2011. But “trees don’t grow to the sky,” as they say – and even the precious metals commodities have shown their true colors the last two years, with gold down –-27% from its high and Silver down –55%!

The “Supercycle” thesis is looking busted, with the legendary Stanley Druckenmiller even weighing in recently saying the commodities decline is just beginning.  Perhaps the “Buy and Hold” approach in the world of commodities is better suited by another name: “Long and Wrong.”

Roll Yields, Contango, and Backwardation

But being on the wrong side of the trade isn’t the only problem with commodity ETFs. They can also suffer from a what is called negative roll yield due to the way they gain access to the markets they aim to track: via futures contracts. Futures contracts are finite in time, with traders buying the June 2013 Crude Oil contract, or the December 2013 Corn contract, and so on.

A simplified example: If you are long (having bought in hopes of prices rising) June 2013 Crude Oil futures, for example, and want to remain long after the end of June, you have to actually exit the June contract, and enter (buy) a new contract (say July). If you want to remain long at the end of July, you exit and enter August, and so on.

A long-term commodity investor must navigate the shifting landscape that this system creates – and for passive ETF investors, that means potentially experiencing a negative roll yield when markets are in Contango. As we explained in a newsletter from a few years ago:

“Contango is little more than a fancy word for explaining a futures contract curve where the further out contract months are more expensive than the front month contract months. It’s easier to understand using an example. Take Crude Oil futures. If the contract for January delivery is at $60, February delivery at $62.50, March delivery at $65, and  December delivery at $75 – the further out the delivery, the more expensive the contract value. This is known as Contango, and reflects a view that future prices will be higher than current prices. Assuming a growing population, growing economies, and limited supply of commodities, there is research which shows the natural state for commodity pricing is Contango. The opposite, when current prices are more expensive than future prices, is called backwardation. That can occur when there is a supply issue such as when Hurricane Katrina shut in all of the Gulf of Mexico oil production.

Why does Contango pose an issue for commodity ETFs? Because these ETFs buy the nearer month futures contracts so that their share price tracks what is going on in the most actively traded contract, and must roll their positions to the further out months when the contracts expire (remember that a futures contract has a finite lifespan, with the February 2010 contract ceasing to exist on January 22nd, 2010; for example). The difference between the nearer month price and further out month price when they roll is called the roll yield. In a Contango market, the roll yield is negative because the roll results in selling the cheaper contract and buying the more expensive one.  In our example above, if rolling from February to March Crude Oil futures, you would sell the Feb at $62.50, and buy the March at $65, resulting in a negative roll yield of -$2.50.”

It’s important to remember that the roll yield will not necessarily be negative – backwardation can result in a positive roll yield, too. But after 2008, falling prices and that negative roll yield created a double whammy where the ETFs were losing on both the direction of the trade, and the trade structure.

The Ugly Truth

Between falling prices and a negative roll yield, the results have not been pretty. The commodity ETF world has contained some of the worst investments around in the last few years. In fact, just over a year ago UNG was dubbed the worst ETF ever . It’s not hard to understand why – at one point it had lost more than 96% of its value since inception.

Worst ETF ever

Disclaimer: past performance is not necessarily indicative of future results.

The ETF never traded at $500, of course. The above chart is adjusted to reflect the fact that the ETF has undergone two reverse splits: a 1-for-2 reverse split and a 1-for-4 reverse split.

But it’s not just UNG which has struggled. Other commodity ETFs and ETNs have been just as bad in tracking the price appreciation/depreciation they were designed to track. CORN, USO, JJC, JO, WEAT – they’ve all underperformed a simple strategy of buying the December futures contract and rolling it annually.

How much underperformance are we talking about? We charted the composite of several ETFs/ETNs for various markets against the simple roll annually strategy for those markets – averaging their performance once they came online – and did the same for simply buying and rolling the December contract each year.  We ignored GLD and SLV as they don’t use futures contracts for their exposure, they hold the actual commodity in a vault. But for those using futures markets for their exposure – it isn’t pretty - read ‘em and weep below:

ETFs even lag behind futures contracts

Disclaimer: past performance is not necessarily indicative of future results. These results are hypothetical in nature and are intended for educational purposes only. Please read carefully the disclaimer regarding hypothetical performance below.
USO - Apr ’06, UNG - Apr ’07, JJC - Oct ’07, JO - July ‘08, CORN - Jun ’10, WEAT - Sep ‘11

Those drags on performance add up, amounting to a -40% lag for the ETFs in our hypothetical composites. That’s not 4 basis points, or even 40, or even 400 – we’re talking massive tracking error. How can so much money still be in these investments – especially when they are highly liquid and so easily ditched?  Are futures markets really that scary and confusing that billions of dollars would rather sacrifice 40% in returns for the ease of an ETF? Maybe it is a bunch of ill conceived mandates for a certain percentage of portfolios to be in commodities? Whatever the reasons – we don’t get it.

ETFs Fighting Back

But the problems of the roll yield are no secret – investors (and the ETF providers, no doubt) have known about the cost of roll yield for years. Indeed, prop traders and even our old friend Emil Van Essen has used the knowledge of large funds rolling out of the near month contract and into the further out contract to inform their trades.

But some of these commodity ETF folks aren’t as dumb as they look, taking steps over the last year or so to address the problem – we covered some of their efforts in a recent blog post. These new ETFs are getting their commodity exposure by investing in a blend of futures contracts for varying maturity dates. For example, the Teucrium Corn ETF tries to minimize the problem by not just plowing into the front month contract for the market they track. Instead, they use the following futures contracts: (1) the second-to-expire Futures Contract for corn traded on the Chicago Board of Trade (“CBOT”), weighted 35%, (2) the third-to-expire CBOT corn Futures Contract, weighted 30%, and (3) the CBOT corn Futures Contract expiring in the December following the expiration month of the third-to-expire contract, weighted 35%. This dynamic, multi-month roll process is their attempt to reduce the impact of Contango markets eating into profits (or compounding losses).

And then there are others that avoid the problem of negative roll yield by simply avoiding futures contracts altogether. GLD, for instance, buys actual gold and keeps the bars in a vault to back shares of the ETF purchased by investors. The ETF tracks the spot price of the metal far better than those who rely on futures contracts, though GLD still faces that long-only problem (especially lately). However, even this approach isn’t without its drawbacks, as precious metals ETFs are taxed as “collectibles” in the same way as if you actually held the bullion. That means a top rate of 28% for long-term gains and 35% for short-term gains, rather than the more favorable 15% usually reserved for investment income.

So what’s an investor interested in more than just Gold exposure supposed to do? Just ignore so called “in the ground commodities” like Corn, Wheat, Oil, or even Sugar? We obviously wouldn’t advise that, but for retail investors who’ve been burned by the commodity ETF market, we wouldn’t be surprised to see that reaction.

And for big institutional investors (pensions, endowments, etc) with a mandate for a certain percentage exposure to commodity markets, ignoring the commodity space isn’t even possible.  In our view, a forced mandate on a portfolio is a little like telling an NFL team 5% of their team has to be from the University of Delaware. What if the coach doesn’t like any of those players? What if they are slow? Too bad – play them or else.

So if these ETFs aren’t delivering, where can they turn? We’re clearly biased, but we happen to know an asset class which just happens to specialize in futures markets: Managed Futures anyone…

Managed Futures = Tactical Commodity Exposure

For us, the answer lies in tactical commodity exposure via managed futures programs. Tactical?  Yes, tactical as in – being able to go both long and short (able to make money if commodities go up or down). We understand the desire to have exposure to markets like Corn, Oil, Sugar, and more. They could act as an inflation hedge. They could rally from fundamental factors like drought or a war in the Middle East. They are easy to understand. And they provide true diversification to a portfolio in that their price isn’t a function of future cash flows like a stock or bond. 

What we don’t get is accessing commodities via a vehicle which requires that prices go up for you to make money in the commodities space.  We’ve shown some of the massive down moves in commodity markets in just the past few years – and that’s nothing new. Commodity markets will always have violent swings to the downside. The whole world is basically setup to make stock markets generally point up (the Fed, 401ks, tax structure, etc), but there’s not similar structures in place to make sure we don’t grow too much Corn or pump too much Oil (well, besides OPEC).  Why ignore the very real downside of commodities?

Managed futures access commodities a different way, being able to go long and short (ability to make money when prices fall) commodity markets. There are a million and one ways actual managed futures managers attempt to do this. Some use purely systematic methods such as selling when prices fall below a moving average, others are so called fundamental traders who rely on their experience and reading of the supply and demand picture to inform their investments on whether to bet on prices rising or falling.

Focus on Ag Traders

Now, it is true that most managed futures programs don’t just access in the ground commodity markets, or Agricultures (Ags) as managed futures calls them; they also access financial futures in markets such as stock, bond, and currency futures. And perhaps that scares away many investors from using managed futures for their commodities exposure.

But just like a logic puzzle saying all humans are mammals, but not all mammals are human - just because all of the big, well known managed futures programs don’t do pure commodity exposure doesn’t mean all managed futures programs don’t specialize in commodities.

Indeed, a select subset of the managed futures space called “Ag Traders” does specialize in commodities, and we’ve highlighted in the past how and what they do in a strategy spotlight. So just how do these commodity traders and their unique method of providing access to commodity markets compare performance-wise with the long-only commodity ETFs? We’re glad you asked.

We put together a composite of four of the top ranked Ag programs using our proprietary ranking system, and compiled the performance using the same method as for our ETF and Futures composites above – averaging the performance from when the programs came online. Now, there’s definitely some survivorship and selection bias going on here, but these are the programs we’ve been “selecting” for Ag exposure for our clients.

Tactical versus passive

Disclaimer: past performance is not necessarily indicative of future results. These results are hypothetical in nature and are intended for educational purposes only. Please read carefully the disclaimer regarding hypothetical performance below.

Shoot us an email at invest@attaincapital.com, and we’ll send you a full portfolio report on the above composite - including monthly gains/losses, all the risk/reward stats, correlations, and names of the component programs.

Three Strikes and You’re Out

The passive investing argument for ETFs is usually a good one – where you can get lower cost exposure without some fund manager screwing things up. And while we might agree that the passive ETF approach can be a good vehicle when compared with buy-and-hold equity mutual funds, the passive investment thesis breaks down in our opinion when applied to commodities.

For one – you have the very real negative roll yield problem. Two, you have the amped up volatility which can be associated with commodity markets. Is that really what you want as a diversifier in your portfolio – something more volatile than stocks? And most importantly, the third point is you have the massive drawdowns that are relatively commonplace in commodity markets. Coffee has fallen -58%, Sugar down -52%, and Cotton has dropped -60%... all within the last two years. Is the somewhat-iffy idea of commodities as an inflation hedge worth these large periodic losses?

We used to make fun of buy and hold stock folks as buy, hold, and hope. But buying and holding in commodity markets is even worse, becoming buy, hold, hope, and pay (the higher risk and negative roll yield). 

It sure seems that a smarter way of accessing commodity markets and putting commodity exposure into your portfolio would be a tactical approach, where you enlist professional commodity traders to give you exposure to both the ups and downs of commodity markets.

See the original article >>

Everything Created Digitally Is Nearly Free--Including Money

by Charles Hugh Smith

is immeasurably easier to digitally create claims on real-world assets than it is to create real-world assets.


We all understand that the cost of everything that can be created digitally is near-zero.This is why music, videos, text-based knowledge and telephone calls (Skype) are now basically free.

Since money is now created digitally, it too is basically free. We can see how easy it is to digitally create trillions of dollars in this chart of the U.S. monetary base. Roughly $1.2 trillion was created out of thin air essentially overnight back in the good old days of global financial meltdown:

For another look at the wonders of the digital credit creation machine (a.k.a. digital printing press), here are the assets of the Federal Reserve banks: there's the $1.2+ trillion again--hum, Baby! Hit me with another trillion....

Here's a detailed look at the assets the Fed bought with its digitally created money--mostly Treasury bonds and real estate mortgages:

The key feature of digitally creating credit/money is this: it is immeasurably easier to digitally create claims on real-world assets than it is to create real-world assets.


This is why the digital creation of trillions of dollars in credit/money is distorting and disrupting the real economy of real-world assets: the claims on those assets keep expanding while the actual assets remain stubbornly tied to the real world.

This widening disconnect between rapidly multiplying digitally created claims on real assets and the actual assets has spawned a multitude of pernicious consequences, a few of which I have recently addressed:

How Cheap Credit Fuels Income/Wealth Inequality (May 30, 2013)
Why Serial Asset Bubbles Are Now The New Normal (June 6, 2013)
$179,000 Each--In Debt (June 5, 2013)
The Fleeting Beauty of Bubbles and Bonds (June 3, 2013)

Since money can be created for free, how does it retain its value? The answer is artificial scarcity. The example of a college diploma is instructive.

Digitally created massively open online courses (MOOCs) have now made instruction as free as text-based knowledge. This means that offering a college-level series of courses is now nearly free--a topic I have discussed in some depth: The Nearly-Free University (November 15, 2012)

Recent studies have found that students who watch MOOCs learn more and test higher than students attending live lectures: Professors Are About to Get an Online Education Georgia Tech's new Internet master's degree in computer science is the future.


So how can colleges extract $100,000+ for something that is basically free? By monopolizing the issuance of diplomas. You can get the education for nearly free, but since the colleges own the right to print diplomas (for free), you have to pay them $100,000 for the piece of paper accrediting your free education.

This is a classic cartel structure: artificially limit the supply of what is in demand.

So how does the Fed artificially create scarcity-value for its freely created trillions of dollars? It restricts access to all that beautiful free money. Wouldn't it be nice if you and I could reach in and grab a couple of million bucks from the overflowing till?

Or almost as good, how about borrowing a couple million at nearly zero interest rates? At .5%, the annual interest payment on $2,000,000 is a measly $10,000.

Alas, access to the nearly free money is restricted to a small financial Elite, the Aristocracy in our neofeudal debtocracy. This tiny Elite can borrow the money for nearly nothing and then go out and buy real-world assets with the digitally created credit.

Debt-serfs have access to limited sums of this free money, but at much higher rates of interest: for example, student loans cost between 6% and 9%.

When debt-serf purchases of assets serve the agenda of the political/financial Elites, for example buying an auto or home, then the free money is doled out to secure the key feature of debt-serfdom--serfs must service all the debt they take on, thereby enriching the financial system that loaned them the money.

And where did the financial sector get the money? From the Federal Reserve.

How about just giving me $500,000 at .5% interest direct from the Federal Reserve, instead of a mortgage at 3.5%? Sorry, it doesn't work that way: the free money must be restricted to the financial Elite so it can profit mightily from its restricted access to all the free money.

Creating nearly free money and restricting it to benefit a tiny Elite certainly enables debt-serfdom, but it doesn't do much for the real economy. Exhibit 1, fulltime employment:

The Fed can digitally print a trillion dollars at no cost, but that doesn't mean the money flows into the real economy.

Once again we are compelled to ask: cui bono, to whose benefit?
America No Longer Innovative Driven: This is one of the most important video programs I've done with Gordon Long, as we discuss our obsolete education system, the knowledge economy, risk-taking and the bread-and-circuses mindset that dominates our society:


See the original article >>

Myanmar’s Moment?

by Martin N. Baily, Richard Dobbs

YANGON – Interest in Myanmar (Burma) has become intense. Last month, Thein Sein became the first president of Myanmar to visit the White House in nearly 50 years, and leaders from British Prime Minister David Cameron to India’s Manmohan Singh to Japan’s Shinzo Abe have all visited Yangon.

This illustration is by Chris Van Es and comes from <a href="http://www.newsart.com">NewsArt.com</a>, and is the property of the NewsArt organization and of its artist. Reproducing this image is a violation of copyright law.

Illustration by Chris Van Es

Indeed, after years of absence, foreign governments are rushing to reopen their embassies in the country. Moreover, multilateral organizations and former ministers from around the world are flocking to help the authorities make progress on their ambitious agenda, from expanding electricity provision to building their own governing capacity. Investors, too, are actively exploring opportunities.

This focus is not surprising. After years of economic isolation and anemic growth, Myanmar is one of Asia’s last largely untapped markets. Now that the country is opening up, investors are clearly hoping to establish sources of structural advantage that could last for many years.

But can investing in Myanmar live up to today’s soaring expectations? There are undoubtedly major uncertainties and risks. Investors are rightly nervous about how political reform will evolve; whether the government can maintain the fragile peace between ethnic groups; and how regulation and ownership rights will develop. Moreover, it is difficult to quantify the economy’s potential, given the paucity of reliable data; even basic indicators like population size and historical economic growth are shrouded in uncertainty.

There is little doubt that Myanmar begins its development journey from a shockingly weak starting point, as a new report from the McKinsey Global Institute (MGI) demonstrates. Indeed, Myanmar was virtually untouched by the global economy’s spectacular growth during the twentieth century. While global per capita GDP quadrupled around the world, Myanmar’s was virtually flat.

Moreover, productivity is low. A worker in Myanmar added only $1,500 of economic value, on average, in 2010 – around 30% of the average of eight Asian peers. Myanmar’s GDP is now only around 0.2% of Asia’s, equivalent to the size of cities such as Bristol, Delhi, or Seville.

Myanmar needs a step-change in productivity growth. Given expected demographic trends and historic labor-productivity growth, annual GDP growth could be less than 4%, lower than the current consensus. But if Myanmar were to boost annual labor-productivity growth from an estimated 2.7% to around 7% – a rate achieved by other Asian economies, including China and Thailand, in recent decades – 8% annual GDP growth would be possible. This could quadruple the size of the economy by 2030, with annual output rising to more than $200 billion, from $45 billion in 2010.

But it is virtually inconceivable that Myanmar could achieve such acceleration in growth without large volumes of inward investment. The MGI research estimates that $170 billion – as well as the transfer of capabilities and knowledge that typically accompany such investment – is needed between now and 2030.

Thus far, much of the interest among investors has been focused on Myanmar’s energy and mining sectors – no surprise, given the country’s large reserves of oil and gas, its 90% share of global jade production, and its strong position in ruby and sapphire mining. But Myanmar cannot rely on energy and mining alone. It needs growth that is balanced across sectors, providing diverse opportunities for inward investors.

Five sectors – energy and mining, agriculture, manufacturing, tourism, and infrastructure – could account for more than 90% of Myanmar’s total growth and employment potential. Of these, manufacturing, which could take advantage of many companies’ desire to relocate from China and other Asian economies where wages are rising, is by far the most important. The manufacturing sector could, according to the MGI report, employ 7.6 million people and generate nearly $70 billion of GDP by 2030 – more than triple the potential size of the agriculture sector, which currently is Myanmar’s largest.

If Myanmar generates the growth and employment that MGI believes is possible, this would help to increase the number of those with sufficient income for discretionary spending from 2.5 million today to 19 million in 2030, thereby tripling consumer spending to around $100 billion. This would expand the market for companies selling everything from scooters and cars to electronics and financial services.

There should be business opportunities, too, in housing, power, transport, and energy infrastructure. Roughly $300 billion in infrastructure investment in these areas is required across the economy, half of which would need to be in large cities, which will expand if Myanmar diversifies out of agriculture. Today, only an estimated 13% of Myanmar’s population lives in large cities, but that could rise to 25% by 2030 – an addition of ten million people.

Another $50 billion is needed in telecommunications infrastructure if Myanmar is to make full use of digital technology to leapfrog stages of development – for example, by using mobile banking or e-commerce to avoid the cost of building physical banks and shops, and to extend health and education services to even the remotest villages. Today, Myanmar has the second-lowest level of Internet penetration of countries covered by the World Bank’s development indicators, and mobile penetration is the lowest.

Myanmar faces monumental development challenges that embrace virtually every aspect of the economy. But that implies the broadest possible range of opportunities for companies and investors as well. They should proceed with caution, but with the expectation of tapping into a potentially lucrative new market.

See the original article >>

News That Matters Next Week

By Aamar Hussain

US

The uncertainty about when the Fed will begin tapering its programme of asset purchases has increased volatility, both pushing and pulling on global financial markets. “at this juncture, the markets are more concerned about tapering than about weak [US and global] growth,” says MIG Bank’s Chief Economist, Luciano Jannelli.

And Kit Juckes, an economist at Societe Generale says “there is absolutely no unanimity of opinion about when, how fast or even if the Fed will slow bond purchases. The consensus is that [Fed Chairman] Ben Bernanke flew a trial balloon to test the mood, and that he probably wasn’t unhappy to see yields a bit higher, but will be alarmed to see equity price action.”

Given that US inflation remains subdued – the latest reading of the PCE measure on inflation, the Fed’s preferred measure, came in at just 1% – the QE programme is now effectively contingent upon US employment conditions. Therefore, the market will be paying close attention to Tuesday’s job openings and labour turnover data, and Thursday’s weekly jobless claims data to shine more light on the underlying employment situation.

Recent measures of US employment have been somewhat encouraging. The latest non-farm payrolls reading for may came in at 175,000, ahead of analysts’ expectations of 165,000 (which was also the reading for April). The participation rate was also higher by 0.1 percentages point at 63.4%.

Some will still question whether this pace of job growth is sufficient to reach a 6.5% unemployment rate. However, recent comments from the Fed, as reported by MNSI, seem to indicate that it would be prepared to accept a lower pace of job growth before they start tapering.

Towards the end of the upcoming week, traders will turn their attention to US demand fundamentals as well as the supply-side situation.

Thursday’s retail sales and Friday’s University of Michigan consumer confidence levels will give us an idea of how healthy the US consumer is. In May, the University of Michigan confidence survey jumped by 8.1 percentage points to 84.5 – its highest since 2007. Madhur Jha of HSBC says “this month’s reading could be volatile, as some of the key drivers of sentiment are working in opposite directions,” especially given the increased volatility in financial markets over the last fortnight.

US retail sales (excluding autos, gasoline and building materials) have been weak as of late, and April’s reading showed a decline of 0.1%. Thursday’s reading is also expected to be weak, and the median estimate by analysts is for growth of 0.4%.

On Friday, PPI data is likely to show that producer prices swung from -0.7% to 0.1% m-o-m, and core producer prices are also expected to have increased by 0.1% m-o-m. Industrial production, also released on Friday, is likely to have recovered after declines in March and April.

EUROZONE

Perhaps the most important event to occur next week in Europe will be the German Constitutional Court hearing on the ECB’s Outright Monetary Transactions (OMT) programme and the European Stability Mechanism (ESM). Beginning Tuesday 11th June (starting at 10:00 BST), the court is expected to hold a public hearing on the legal aspect of these measures. Germany’s Bundesbank will argue that the OMT and other rescue packages undermine financial stability; Mario Draghi – who reiterated his position after the rate decision meeting this week – believes the programme is above-board, and confirmed that “the legal documentation … is ready and it’s about to come out”.

HSBC analysts provide further detail on the hearing: “During the hearing different assessments should be expected from the president of the Bundesbank Jens Weidmann and the ECB board member Jörg Asmussen. The judges will deliberate over the summer and will then issue a ruling on the ESM and OMT, most likely after Germany’s federal elections on 22 September. There is a possibility that the judges could yet ask the European Court of Justice for its opinion.”

On the possible outcome, economists at Morgan Stanley note that “past Constitutional Court decisions have revealed a quite constructive approach taken by judge Vosskuhle and his colleagues. The most likely outcome will be the Court attaches additional strings to the OMT – meaning more Parliamentarian control. However, this will be a story for the autumn and not for now. In autumn, we might have to debate if the strings the German Court may attach to the OMT convert the instrument into a non-practical device.”

In terms of data, industrial production from the Eurozone as a whole, and France and Italy separately, is due next week. “The Eurozone PMI has indicated an easing in the region’s manufacturing downturn, though suggest that the increase in production seen in March’s official data will prove short-lived, and that the underlying trend remains one of contraction,” write Morgan Stanley analysts. Industrial production rose 1.0% m-o-m in March, and HSBC predicts that data already released for the Eurozone economies “point to production increasing by 0.2% m-o-m in April, which would cause an annual fall of 0.8% y-o-y”.

In France, analysts are expecting industrial production to have bounced in April after falling in March. An increase in energy production last month is expected to help production this month, and other data points released recently suggest an improvement on the previous figure. Gains, however, are only expected to be slight – HSBC are looking for a 0.8% m-o-m rise after dropping 0.9% m-o-m in March.

The final release of Eurozone HICP for May due at the end of the week is expected to match the flash reading of 1.4% in May. Looking ahead, HSBC “expect base effects to continue to have an impact on Eurozone inflation in the next two months, when they will again turn more favourable, and inflation should resume its decline towards 1.2% by the end of 2013, assuming that oil prices stay unchanged.”

Again, France are due to release their national data, and the weather, along with tourism service prices, are expected to have driven consumer prices up in May; this will be partially offset by falling gasoline prices.

UK

UK data has impressed over the course of the second quarter of 2013. February and March data has seen two solid months of gains for industrial production, and many economists believe we are due some ‘payback’ for the month of April. Expectations are that industrial production flat-lined for the month, and fell 0.7% y-o-y. Manufacturing production is seen falling 0.2% m-o-m in April, with an annual decline of 0.5%.

Wednesday sees unemployment data from the UK, and evidence over the last couple of months point to a dip in the pace of hiring. Low labour costs continue to prevail with economists at HSBC expecting “nominal wage growth excluding bonuses to remain at all-time lows”. The ILO rate is forecast to remain unchanged at 7.8% between February and April; average weekly earnings are expected at 0.2% for the same period.

CHINA

The tone of Asian trading for the week will be set over the weekend, when a slew of Chinese data is released, including the latest trade balance data, CPI, industrial production, retail sales and fixed-asset investments. And during the week, we’ll see the release of Chinese money supply data.

In recent weeks, the softer tone of Chinese data has led to concerns once again that the world’s second largest economy is on course for a “hard landing” – a concern that dogged traders last year. However, Michala Marcussen, an economist at Societe Generale, says “there is little to suggest that the Chinese economy is in any immediate danger of hard landing.”

Marcussen points to May’s composite PMIs, which nudged higher to 50.8, from 50.6 in April. And while there are concerns about how credit growth is not having an impact on economic growth, she says that the state is still giving strong backing to the Chinese economy. “The approach by the new China leadership to accept slower growth and not succumb to the temptation of a monetary boost helps by not making the problem even bigger,” Marcussen adds.

JAPAN

The main event of the week in Asia will be the Bank of Japan’s latest rate decision. Over the last fortnight, question marks have been raised over the BoJ’s credibility in engineering 2% inflation. Indeed, minutes from its previous policy meeting highlighted that “a few” board members are concerned that inflation expectations will fail to translate into price increases.

And this week the market seemed rather unimpressed by prime minister Shinzo Abe’s “third arrow” plan to deregulate the Japanese economy and slash taxes to help spur activity.

The combination of Fed concerns, question marks over BoJ policy and Shinzo Abe’s third arrow have formed a perfect storm that has wreaked havoc upon Japanese shares. At pixel time, Japan’s Nikkei index has fallen by 20% since the peaks in May, entering bear market territory. The yen, a perceived safe haven, has also surged against the dollar, now trading in the Y95 bracket, from over Y100 at the start of the week.

But fears may have been overdone. For instance, Tokyo’s CPI in May – a leading inflation indicator – turned positive for the first time since April 2009. “This suggests that deflationary pressures are gradually easing back,” says HSBC’s Jha. Combine with Japan’s pickup in growth, these data should be enough for the BoJ to leave policy unamended on Tuesday.

See the original article >>

Job gains beat forecasts as U.S. weathers budget cuts

By Lorraine Woellert

American employers took on more workers than forecast in May as the world’s largest economy weathered the impact of higher taxes and federal spending cuts.

Payrolls rose 175,000 after a revised 149,000 increase in April that was smaller than first estimated, Labor Department figures showed today in Washington. The median forecast in a Bloomberg survey called for a gain of 163,000. The unemployment rate climbed to 7.6% from 7.5% as a surge in the number of people entering the labor force swamped the number of positions available.

Broad-based gains at private employers, ranging from retailers and builders to health-care providers and hotels, indicated companies are optimistic about the outlook for demand, even as government payrolls shrank. Stocks advanced on optimism economic growth will pick up later this year after a second- quarter slowdown.

“The economy has really held up much better than expected, considering the strong fiscal headwinds that we’re experiencing right now,” said Russell Price, senior economist at Ameriprise Financial Inc. in Detroit, who correctly projected the rise in the unemployment rate. “The underlying fundamentals of the economy are very supportive, and once these headwinds recede somewhat, that the economy can gain momentum.”

The Standard & Poor’s 500 Index climbed 1% to 1,639.09 at 12:30 p.m. in New York. The yield on the 10-year Treasury note rose to 2.15% from 2.08% late yesterday.

Craft Brewer

Among companies hiring workers is Santa Fe Brewing Co., a 30-employee craft beer maker in Santa Fe, New Mexico. The company has hired five full-time workers and one part-time employee this year to help support growing sales in the Southwest. It’s looking to hire three or four part-time employees now, and may add more full-time positions next year, said owner Brian Lock.

“I get the sense the economy is coming back a little bit,” said Lock, 41. “We are definitely on the recovery track. We are seeing more tourists than we have in the past three of four years, and that is a good sign.”

While Americans are finding work, wage gains aren’t picking up. Average hourly earnings were little changed at $23.89 in May after $23.88 in the prior month. They were up 2% in 12 months ended in May, the same as in April.

Household Survey

The household survey, used to calculate the unemployment rate, showed a 420,000 increase in the size of the labor force, exceeding the 319,000 gain in employment and pushing up the jobless rate from a four-year low.

The report also showed sequestration, or the automatic across-the-board federal spending cuts that began in March, may be having an impact on government payrolls. Employment at federal agencies excluding the postal service showed a 9,400 decrease last month. Private payrolls, by contrast, increased 178,000 in May after a 157,000 gain the prior month.

Alan Krueger, chairman of the White House Council of Economic Advisors, used the report to repeat his call to Congress to replace across-the-board budget cuts with what the Obama administration calls “balanced deficit reduction.”

“We’re seeing losses of government jobs,” Krueger said in an interview on Bloomberg Television. “We’re making progress, but we would do even better if Congress would get out of the way.”

Manufacturing saw employment decline for a third month, falling 8,000 in May after a 9,000 decrease in the previous month, as slowing global growth curbed orders.

Employment at private service providers climbed 179,000 last month, and temporary-help agencies added 25,600 jobs. Retailers took on 27,700 employees, the most in six months.

Housing Recovery

Construction companies added 7,000 workers, reflecting the housing recovery that’s helping to power economic growth and offsetting some of the recent weakness in manufacturing.

Among the beneficiaries is Fluor Corp., an engineering and equipment company based Irving, Texas. The company expects its global staff to grow from 13,500 to 15,000 by the end of the year, said Peter Oosterveer, president of energy and chemicals.

Wage growth remains “modest,” with pay up between 3% and 5% in North America and Europe, Oosterveer said at a conference yesterday.

Jane Hillerby, 56, was living in Reno, Nevada, and commuting to San Francisco when she lost her job as a manufacturing consultant in January. With degrees in engineering and business, she was confident she could find work closer to home.

‘Tough’ Market

“I thought I had a pretty good resume but I wasn’t getting anything,” Hillerby said. “It’s tough out there.”

In March she took a job with Ebara Corp., an industrial pump manufacturer with a site in Reno. Her $90,000-a-year salary as a project manager is less than the $130,000 she earned as a consultant, though she doesn’t have to commute to California and the company covers her health insurance.

The number of discouraged workers fell to 780,000 in May, the fewest since September 2009, according to Labor Department data that aren’t adjusted for seasonal variations.

For Daniel McCune, the road to employment has been difficult. The 26-year-old has struggled to find work since earning his college degree in 2009.

“It was probably the worst possible time to graduate,” McCune said. “It’s a tough situation to be in, from 2009 to just about now.”

After graduating from Liberty University in Lynchburg, Virginia, McCune held a Capitol Hill internship and looked for his “dream job” at a U.S. intelligence agency. When it didn’t materialize, he moved in with his parents and took a job at Macy’s. Employers are looking for experience, he said, and he’s had trouble landing interviews.

Federal Reserve

Today’s jobs report may not satisfy Fed policy makers led by Chairman Ben S. Bernanke, who are looking for greater progress in reducing unemployment. The Fed has said it will continue its $85 billion-a-month pace of asset purchases until the labor outlook improves “substantially.”

Former Fed economist Vincent Reinhart, who is now chief U.S. economist at Morgan Stanley in New York, says policy makers need to see about four months of job growth averaging at least 200,000 to justify reducing the pace of asset purchases.

“They’re going to need a substantial run of data to change course,” said Ian Shepherdson, chief economist at Pantheon Macroeconomics in White Plains, New York. “To actually do it, the economy not only has to be improved, but it has to be improved in such a way that it can take the strain of the new policy. The economy has to be in a position to take it and I don’t think it is just yet.”

Economic Outlook

Gross domestic product rose at an annualized rate of 2.4% from January through March. Growth will slow to a 1.6% pace in the second quarter as the effects of sequestration take hold, before improving to an average 2.4% rate in the second half of the year, according to the median forecast of economists surveyed by Bloomberg from May 3 to May 8.

Other companies, from industrial giant Caterpillar Inc. to insurer Genworth Financial Inc., are adjusting payrolls to cut costs. Genworth, based in Richmond, Virginia, will eliminate 400 jobs as low interest rates squeeze investment income.

Caterpillar, the largest maker of construction and mining equipment, has responded to weaker global sales by delaying capital investments and requiring some employees to take unpaid leave, said Michael DeWalt, director of investor relations for the Peoria, Illinois-based company.

“Within corporate accounting, treasury, tax, about 90% of the people are taking three weeks of unpaid leave this year,” DeWalt said at a June 5 conference. “A lot of the actions that we’re taking are all around trying to match the cost base up with what the reality is of sales.”

See the original article >>

Central Banking’s New Face

by Paola Subacchi

LONDON – A changing of the guard is underway at many of the world’s leading central banks. Haruhiko Kuroda is now installed as the governor of the Bank of Japan (BOJ), faced with the daunting task of ending two decades of stagnation. Mark Carney, the Bank of Canada’s current governor, who is set to take over as the governor of the Bank of England (BoE) in July, is already making his presence felt in British monetary-policy debates. And in the United States, the expected conclusion of Ben Bernanke’s term as Chairman of the Federal Reserve Board in January is already inviting speculation about his successor.

This illustration is by Margaret Scott and comes from <a href="http://www.newsart.com">NewsArt.com</a>, and is the property of the NewsArt organization and of its artist. Reproducing this image is a violation of copyright law.

Illustration by Margaret Scott

The only holdouts among the world’s leading economies are the eurozone and China. But that does not necessarily imply constancy. Mario Draghi has been the president of the European Central Bank for barely a year, and the governor of the People’s Bank of China, Zhou Xiaochuan, was almost replaced when he reached retirement age in February.

Twenty years ago, such developments would have interested mostly bankers and businesspeople. But, since the global financial crisis, the need to revive and sustain economic growth in the US, the United Kingdom, and Japan – and to avoid financial collapse in the eurozone – has prompted major central banks to be more outspoken and pursue more aggressive monetary policies, including unconventional measures like quantitative easing (QE). As a result, many central bankers have become household names; some even have tabloid nicknames, like “super Mario” Draghi.

This new prominence has also forced some central bankers to reassess their decision-making processes. In Japan, outsiders recently got a rare glimpse into the BOJ’s activities when minutes of a policy meeting were leaked. Likewise, the accidental release a day early of the minutes from the Fed’s March rate-setting meeting to more than 100 people, including banking executives, congressional aides, and bank lobbyists, raised questions about how the bank controls the disclosure of privileged information.

In fact, the Fed has been under increasing scrutiny since 2008, when near-zero nominal interest rates drove it to become the first central bank to adopt QE. In a push to reduce the cost of borrowing, the Fed purchased long-term assets in the market, injecting liquidity into the financial system. The BoE and the ECB have since adopted similar measures.

In early April, the BOJ announced plans to unleash the most aggressive bond-buying program of all, promising to inject $1.4 trillion into the economy over the next two years in order to meet an inflation target of 2%. This is monetary policy on steroids, and, to opponents of inflation-inducing money creation, it amounts to playing with fire. But, for Japan, which has been struggling with deflation for a generation, it is a risk worth taking. Whether Kuroda’s assault will bolster domestic consumption and investment remains to be seen.

Unconventional measures are part of a broader transformation of monetary policymaking. In addition to becoming bolder and more expansive, it has become increasingly intertwined with fiscal policy. This is most explicit in Japan, where monetary policy is a central component of Prime Minister Shinzo Abe’s economic strategy, dubbed “Abenomics,” implying collaboration between the government and the central bank.

Does this undermine central-bank independence by amounting to a de facto subordination of unelected technocrats to elected politicians? Arguably, Japan is an exceptional case, with the constraint of the zero bound on nominal interest rates demanding, at long last, a deviation from conventional measures. In Europe, however, Bundesbank President Jens Weidmann has criticized the ECB for overstepping its mandate with its “outright monetary transactions” program, through which Draghi aims to fulfill his pledge to guarantee the euro’s survival.

As a result, questions about the role of monetary policy and the independence and accountability of central banks, once confined to rarefied academic discussions, are fixtures of broad policy debate. But, rather than try to define a single approach, central bankers should aim to develop individualized approaches within the orthodox monetary-policy framework, which revolves around price stability and independence.

For example, the Fed’s mandate dictates that price stability can be explicitly linked to active support for GDP growth and employment; for the BoE and the ECB, it can be a condition for achieving the broader goal of sustainable growth and employment. As long as politicians observe the rule of non-interference – at least publicly – central banks will be perceived as unconstrained by political interests.

The BOJ, by demonstrating that aggressive money creation is a legitimate approach to fighting deflation, has broken previously sacrosanct conventions. At the same time, it has taken the unprecedented step of incorporating monetary policy into a comprehensive economic strategy based on coordination among different policy areas and their associated institutions.

This integrated approach could prove effective in countries where the real economy and the financial sector are closely linked, ensuring the timely, orderly implementation of policies, while preventing adverse spillovers. Such coordination would infringe on central-bank independence no more than multilateral cooperation undermines the sovereignty of the countries involved.

While the impact of Abenomics on Japan’s economy remains to be seen, its impact on debates about monetary policy and the relationship between central banks and governments is already becoming apparent. One hopes that Carney will follow this trend of challenging conventional wisdom at the BoE. A new era of active and varied monetary policy may have begun, with potential benefits for all.

See the original article >>

Follow Us