Tuesday, September 10, 2013

Italy Riskier Than Spain For First Time In 18 Months

by Tyler Durden

While Spain brims with hope, amid dismal real data, as we noted earlier, Italy - despite its PMI 'proving' things are great - just missed its GDP growth expectations for the 9th of the last 10 quarters. Add in a prinkling of Berlusconi bafflement and 'the oldest bank in the world' about to be nationalized and the risks in Italian government bonds have pushed yields above their European neighbor for the first time in 18 months. The last time this huge debt-loaded nation's risk topped Spain's was in the run up to the peak in the European crisis in Q4 2011. But, of course, we have OMT now which will save us all...

See the original article >>

USA: Stagflation Here We Come!

By tothetick

Just when you think that the worst has come, been and gone, there will be more stuff hitting the fan in the very near future and that should serve as a lesson to the next head of the Federal Reserve that central banks don’t usually necessarily have the people in mind when they take things over and end up doing a pitiful job. But little reminders are just nudges in the ribs and there is a lot more needed than somebody elbowing the Federal Reserve of the United States right now.

Inflation is set to rise in the United States and that will be beset the people that have savings as well as drag the retirees down and create more hardship than is being experienced and endured by the people already today.

The Federal Reserve has been unable so far to bring about any form of positive inflation level in the US economy and the current inflation rate stands at 2%. But the economy is not growing enough and it is certainly not seeing worker salaries approaching anything near the increases in prices that are taking place. Prices are just outpacing salaries and jobs aren’t being created.

That’s the problem with using U3 unemployment levels and not U6 unemployment levels (including all the people that have been discouraged from seeking employment as well as those that are underemployed in the economy). The latter stands at nearly double the official figure issued by the Bureau of Labor Statistics.  Just looking at the figures for Friday 6th September that were issued by the Bureau it can be seen that 312, 000 people gave up looking for employment and dropped out of the job market due to discouragement through not finding work. In one survey carried out people actually stated that they were dissatisfied with the job market and they would prefer to wait for the right job to come along.

The Federal Reserve has expanded its balance sheet by $3.6 trillion and the administration is touting the benefits of what it believes Quantitative Easing has actually done in the job creation area. But, if for one moment we do take U3 unemployment as the rate, then it doesn’t look like money well spent. Since we are still in the area of just-in-time economics applied to the employment sector. The jobs are few and far between and they are certainly not being stored somewhere for someone to come along later and snap up; they are being created slowly and sluggishly, if at all. Whatever happens, whether that be a push or pull in the Federal Reserve balance sheet the effect ripples into the lives of people slowly but surely, for good or for bad.

Inflation has been fixed at the target rate of 2.5% by the Federal Reserve and unemployment needs to come down to under 6.5% (from the official 7.3%). Then interest rates can be raised.  For the time being however it’s only the speculators that have managed to reap the rewards of low interest rates. The American people have just temporarily imagined that they were wealthy by being able to contract cheap loans and get granted easy credit. But, soon they will realize that they are only debt-wealthy and that will be the crunch in the future when interest rates rise again.

Financial imbalances and excessive inflationary pressure can only be hiding just round the corner in the not too distant future. Some analysts believe that we will be in for a period of stagflation, unemployment will be high and inflation will have set in in a stagnant economy. It has been predicted that prices will rise for the US consumers by at least 10% in the next 30 years.

So the Federal Reserve wants inflation and it will most certainly end up getting it. But, it will probably get more than it bargained for. Although, it is very much debatable as to whether or not the guys at the Fed have actually considered what will happen afterwards.

Or do they also actually believe that the improvements are really there and the figures are a true representation of the economic health today of the USA?

See the original article >>

Will gold follow its seasonal pattern this year?

By Frank Holmes

I often talk about how the gold trade is really two separate trades. There’s the Fear Trade that buys gold out of fear of war or poor government policies. This crowd sees the precious metal as a safe haven during times of crisis, such as when gold rose over the fear of a war in Syria, but eased when a much more limited military action became likely.

However, there were other factors beyond Syria driving gold. That’s the Love Trade. This group gives gold as gifts for loved ones during important holidays and festivals.

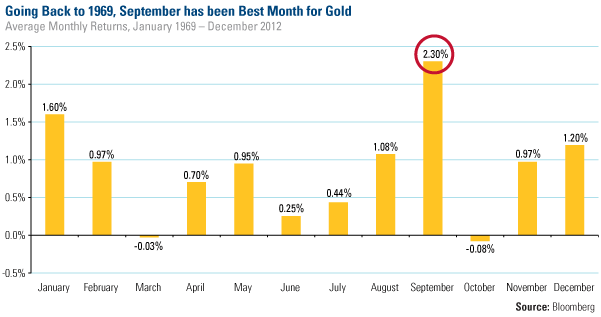
This is the time of the year that we are in the midst of right now. Historically, September has been gold’s best month of the year. Looking at more than four decades of monthly returns, the precious metal has seen its biggest increase this month, averaging 2.3%.

Indians will be getting ready for their wedding season that begins in October followed by the five-day Hindu festival of lights, Diwali, which is India’s biggest and most important holiday of the year. In December, millions of people will be gathering with loved ones to exchange gifts as they observe Christmas. And finally, millions will celebrate Chinese New Year at the end of January 2014.

In India, there’s also the harvest season to consider, as its crop production relies on rainfall for water.

One positive driver for gold this year is the fact that the country has had a heavy monsoon. The rains that started in June covered most ofIndia at the fastest pace in more than 50 years. About 70% of the annual rainfall in India happens from June to September, and a strong monsoon season usually means a bumper crop, which boosts farmers’ incomes.

That could increase gold buying as well, negating the government’s efforts to quell India’s gold-buying habit. Historically, good monsoon seasons have been associated with strong gold demand. “In 2010, the last year that rains were heavily above average, demand soared 37% in the fourth quarter after harvests,” says Reuters.

In the rural areas ofIndia, there is little access to banking networks, so gold is used as a store of wealth, says Reuters. And with half the population in India employed in agriculture, it’s no surprise that 60% of all the gold demand in the country comes from these rural areas.

India’s rural community has seen a “hefty rise” in income this year, reports Mineweb. But instead of buying gold, Mineweb says Indian farmers may purchase land due to gold in local currency reaching “dizzying heights.”

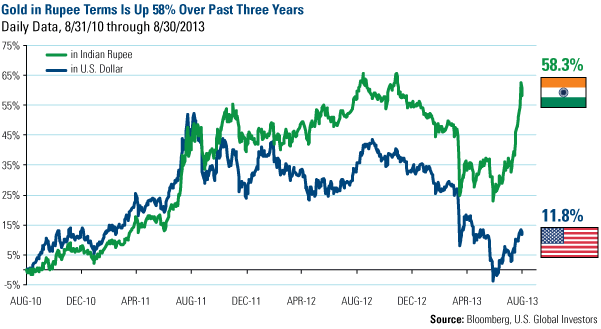
Particularly over the past few weeks, as the currency faced increasing weakness, gold in rupee spiked. Over the past three years, gold is now up 58% compared to gold in the U.S. dollar, which rose nearly 12%.

Despite this possible short-term threat to gold demand, keep in mind the East’s long-term sentiment toward the metal, as this area of the world has a different relationship related to both the Love Trade and the Fear Trade. And it’s not easily broken.

You can see this encouraging sentiment in the chart below, as people inChinaandIndiahave a “particular positivity around longer-term expectations for the gold price,” according to the World Gold Council (WGC).

In May and July, the WGC asked 1,000 Indian and 1,000 Chinese consumers where they think the price of gold will be in five years. The two charts show the respondents’ answers in May, when the average price of gold was about $1,400, and again in July, when the average price of gold was $1,200 an ounce.

Overwhelmingly, consumers in India and China believe the price of gold will increase over the long-term.

What’s interesting is when you compare the responses between May to July, there’s an “extremely resilient sentiment around the future trajectory of gold,” says the WGC. In May, 62% assumed gold would increase; in July, the number increased to 66%.

The survey also shows that there are not too many gold bears in the East. Only 11% of those who responded in July think the price will decrease.

See the original article >>

Apple…new product launch cause “DIFFERENT RESULTS” this time?

by Chris Kimble

CLICK ON CHART TO ENLARGE

In less than an hour, Apple will unveil its new iphone product. How will the stock react is the key question?

The upper left chart was produced on 10/10/12, at the time of the iphone 5 announcement.  At the time of the iphone 5 announcement Apple was facing a 30-year resistance line and was trading above $600 per share (iphone 5 post here)

The last time a major product announcement took place the 30-year resistance level one out as Apple fell a couple of hundred dollars in price. Now Apple is facing falling resistance and its 38% Fibonacci resistance level (of the $300 decline in price).

Will it be different this time??? Will the stock rise after the announcement?  Stay tuned!

See the original article >>

Silver $'s

by Marketanthropology

See the original article >>

Gold - September Usually the Best Month of the Year

By: Frank_Holmes

I often talk about how the gold trade is really two separate trades. There’s the Fear Trade that buys gold out of fear of war or poor government policies. This crowd sees the precious metal as a safe haven during times of crisis, such as when gold rose over the fear of a war in Syria, but eased when a much more limited military action became likely.

However, there were other factors beyond Syria driving gold. That’s the Love Trade. This group gives gold as gifts for loved ones during important holidays and festivals.
This is the time of the year that we are in the midst of right now. Historically, September has been gold’s best month of the year. Looking at more than four decades of monthly returns, the precious metal has seen its biggest increase this month, averaging 2.3 percent.

Indians will be getting ready for their wedding season that begins in October followed by the five-day Hindu festival of lights, Diwali, which is India’s biggest and most important holiday of the year. In December, millions of people will be gathering with loved ones to exchange gifts as they observe Christmas. And finally, millions will celebrate Chinese New Year at the end of January 2014.
In India, there’s also the harvest season to consider, as its crop production relies on rainfall for water.
One positive driver for gold this year is the fact that the country has had a heavy monsoon. The rains that started in June covered most of India at the fastest pace in more than 50 years. About 70 percent of the annual rainfall in India happens from June to September, and a strong monsoon season usually means a bumper crop, which boosts farmers’ incomes.
That could increase gold buying as well, negating the government’s efforts to quell India’s gold-buying habit. Historically, good monsoon seasons have been associated with strong gold demand. “In 2010, the last year that rains were heavily above average, demand soared 37 percent in the fourth quarter after harvests,” says Reuters.
In the rural areas of India, there is little access to banking networks, so gold is used as a store of wealth, says Reuters. And with half the population in India employed in agriculture, it’s no surprise that 60 percent of all the gold demand in the country comes from these rural areas.
India’s rural community has seen a “hefty rise” in income this year, reports Mineweb. But instead of buying gold, Mineweb says Indian farmers may purchase land due to gold in local currency reaching “dizzying heights.”
Particularly over the past few weeks, as the currency faced increasing weakness, gold in rupee spiked. Over the past three years, gold is now up 58 percent compared to gold in the U.S. dollar, which rose nearly 12 percent.

Despite this possible short-term threat to gold demand, keep in mind the East’s long-term sentiment toward the metal, as this area of the world has a different relationship related to both the Love Trade and the Fear Trade. And it’s not easily broken.
You can see this encouraging sentiment in the chart below, as people in China and India have a “particular positivity around longer-term expectations for the gold price,” according to the World Gold Council (WGC).
In May and July, the WGC asked 1,000 Indian and 1,000 Chinese consumers where they think the price of gold will be in five years. The two charts show the respondents’ answers in May, when the average price of gold was about $1,400, and again in July, when the average price of gold was $1,200 an ounce.

Overwhelmingly, consumers in India and China believe the price of gold will increase over the long-term.
What’s interesting is when you compare the responses between May to July, there’s an “extremely resilient sentiment around the future trajectory of gold,” says the WGC. In May, 62 percent assumed gold would increase; in July, the number increased to 66 percent.
The survey also shows that there are not too many gold bears in the East. Only 11 percent of those who responded in July think the price will decrease.

Are you a gold bull or bear?
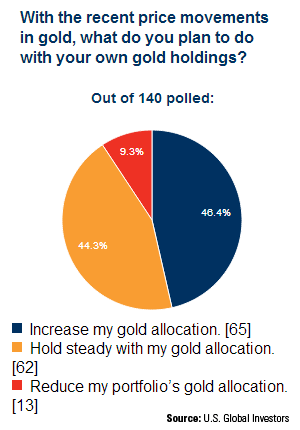
Where do you think gold is headed? We asked people what they planned to do with their own gold holdings because of the recent price moves in gold over the past several weeks. Take a look at the results.
The decision to hold tight compared to those who wanted to increase their allocation to gold was nearly the same.
What’s amazing is that only 9 percent felt the need to decrease their allocation.
What’s your take? Take part in our Gold Portfolio Poll and weigh in.

Want to see more on commodities or emerging markets? Provide us with your email address and you’ll receive a note every time Frank Holmes updates his blog. You can also follow U.S. Global on Twitter or Facebook.

By Frank Holmes
CEO and Chief Investment Officer
U.S. Global Investors

U.S. Global Investors, Inc. is an investment management firm specializing in gold, natural resources, emerging markets and global infrastructure opportunities around the world. The company, headquartered in San Antonio, Texas, manages 13 no-load mutual funds in the U.S. Global Investors fund family, as well as funds for international clients.

All opinions expressed and data provided are subject to change without notice. Some of these opinions may not be appropriate to every investor.Standard deviation is a measure of the dispersion of a set of data from its mean. The more spread apart the data, the higher the deviation. Standard deviation is also known as historical volatility. All opinions expressed and data provided are subject to change without notice. Some of these opinions may not be appropriate to every investor. The S&P 500 Stock Index is a widely recognized capitalization-weighted index of 500 common stock prices in U.S. companies. The NYSE Arca Gold BUGS (Basket of Unhedged Gold Stocks) Index (HUI) is a modified equal dollar weighted index of companies involved in gold mining. The HUI Index was designed to provide significant exposure to near term movements in gold prices by including companies that do not hedge their gold production beyond 1.5 years. The MSCI Emerging Markets Index is a free float-adjusted market capitalization index that is designed to measure equity market performance in the global emerging markets. The U.S. Trade Weighted Dollar Index provides a general indication of the international value of the U.S. dollar.

See the original article >>

Could Manufacturing’s Bounce Continue in the U.S.?

By Tim Mahedy

It’s no secret that the manufacturing sector in the United States has been in decline for the past three decades. But a strong rebound in durable goods, such as cars and electronics, has helped revive the manufacturing sector and has supported the post-recession recovery.

As of early 2013, manufacturing output was only 4 percentage points below its pre-recession peak. Comparing across countries, the United States has performed more strongly than most of its G-7 counterparts, with the exception of Germany. Yet, the recovery in Germany has stagnated since mid-2011, while the U.S. recovery continues to gain steam.

Is this strong rebound in U.S. manufacturing here to stay, or just a temporary phenomenon?

A lopsided recovery


Our new study, The U.S. Manufacturing Recovery: Uptick or Renaissance?, looks at the U.S. manufacturing sector and shows that while the headline recovery numbers for U.S. manufacturing are impressive, they mask significant differences between the sectors producing durable goods and nondurable goods (such as food and clothing).

The post-recession recovery has been driven almost entirely by a rebound in durable goods production. On the other hand, nondurable goods have fared poorly—their production is still 10 percent below its pre-recession levels and only 6 percent above its trough.

Even within the durable sector, production growth rates have varied substantially. Automobiles, computers and electronics, and machinery have driven the majority of the rebound. However, the rebounds in machinery and automobiles have strong cyclical components (both had declined substantially during the crisis), while growth in the production of computers and electronics has been unrelenting over the last decade.

The energy revolution


What factors can explain the strong rebound in durable goods production in the United States?

Lower labor costs in the United States compared with those in emerging markets have been the most important factor in explaining the recent revival in U.S. manufacturing. But other factors, such as a more competitive real exchange rate (a depreciation of the dollar relative to other currencies, corrected for differences in inflation) and lower energy prices, may have also played a significant role.

The increasing U.S. production of oil and gas through unconventional extraction techniques—such as natural gas extracted from shale rock formation—could provide a boost to the manufacturing sector. However, our analysis suggests that the “pull” from the energy boom to manufacturing has been limited. Based on the scenarios in the 2013 Annual Energy Outlook by the U.S. Energy Information Administration, additional production of oil and gas would result in a positive contribution to manufacturing growth of around 0.1 – 0.3 percentage points per year through the end of the decade.

Nondurable goods, such as the production of chemicals or primary metals, would benefit much more than sectors that rebounded strongly from the recession, such as computers and electronics and automobiles.

Tapping into emerging markets


While manufacturing production as a share of total GDP has been declining for decades, manufacturing exports as a percent of total exports have remained relatively stable. This continued strength can, in part, be explained by increased sales of nondurable goods, especially chemical products and plastic materials, to emerging markets over the past decade. While total production of nondurables remains weak post-recession, these sectors stand to gain the most from structural changes in the U.S. market, such as decreasing energy and labor costs.

Exports of durable goods have been less impressive, but even here there is a bright spot. Export patterns have changed directions as growth in consumption of durable goods such as machinery have moved away from advanced economies to more dynamic markets, such as emerging Asia.

Tapping into these fast-growing regions could therefore increase the contribution of manufacturing exports to U.S. medium-term growth.

All in all, some sectors have rebounded strongly from the recession, but the viability of a renaissance in U.S. manufacturing largely hinges on a continued reduction in the wage gap between the U.S. and emerging markets, and lower domestic energy prices.

See the original article >>

Why the Fed Needs to Taper Now in Spite of Weak Jobs Report

By George Leong

The Federal Reserve will need to make a big decision soon, prior to its Federal Open Market Committee (FOMC) meeting in mid-September, regarding the continuation of its monetary policy. Before Friday’s non-farm payrolls report, the decision was somewhat easy to make on the heels of positive economic data and a good second-quarter gross domestic product (GDP) reading. The initial claims for the most recent week were the lowest since before the recession.

The futures market was betting on the Federal Reserve beginning to rein in its bond buying at the September meeting; even the Federal Reserve’s Beige Book pointed to tightening.

But then the market was surprised when the non-farm payrolls showed a muted 169,000 new jobs in August and worse yet, the July reading was revised downward by 36% to a horrible 104,000. What the heck happened with the U.S. Department of Labor? Maybe a case of sticky fingers?

The unemployment rate did fall to 7.3%, but that was driven by a decline in the labor force participation rate to 63.2%.

The Federal Reserve and Mr. Ben Bernanke now have some serious thinking to do. Pull back on bond purchases and this could hurt the economy, given the jobs report.

The futures market fell on the report, betting the Federal Reserve’s tapering may not begin until the October meeting. Of course, continued weakness in the jobs market could mean tapering could get pushed back until the December meeting, which coincidentally will be the final meeting with Bernanke at the helm of the Federal Reserve, and we know he probably would want to start the process in his term.

For the economy, the report is not good news, as it suggests continued sluggishness in the U.S. economy. In a healthy economy, you see steady jobs growth at much higher levels than what we are seeing. The impact of the weak jobs report will likely be felt on the economy, especially in the retail sector, as consumers hold back on spending. Leading up to the key holiday shopping season—that’s not good.

So now, despite trillions of dollars of quantitative easing, the U.S. economy is growing at just over a mere two percent, corporate America can’t generate strong revenue growth, and people are suffering looking for jobs that do not appear to be there. Of course, there’s also the lower quality of the jobs growth that entails many lower-paying service jobs and not as many highly skilled or education-based jobs that the government would want to see.

In my view, the Federal Reserve should begin to taper a bit in September and see what the impact on the stock market and economy are. The fact is there are enough positives to begin the tapering process. We don’t need to see sustained jobs growth to begin the tapering.

So while I would want the Federal Reserve to begin tapering in September, there’s a chance that it won’t happen until at least October. The bottom line is: bond yields will inevitably head higher this year, so it may be time to start looking at bonds.

See the original article >>

How Next Week’s Fed Meeting Could Impact Your Portfolio

By Sasha Cekerevac

All eyes are on this week’s important Federal Reserve meeting, in which many analysts expect that the Federal Reserve will decide to begin to lower its $85.0-billion-per-month asset purchase program.

But things might not be that easy, since the report on job creation released last Friday is showing signs of deceleration.

Job creation is obviously the all-important factor that everyone wants to see. Without job creation, an economy begins to slow down.

According to the latest data, total job creation for the month of August was 169,000, a little lower than expectations of 178,000. The unemployment rate did fall to 7.3% during the month of August from 7.4% in July. (Source: Bureau of Labor Statistics, September 6, 2013.)

On the surface, these numbers look pretty decent. However, the reason for the unemployment rate falling was due to a further decrease in the labor participation rate, now at 63.2% in August, the lowest since 1978. On top of that, last month’s job creation data was revised downward, from 162,000 new jobs to only 104,000 for the month of July.

The Federal Reserve will certainly take into account these facts when considering its next policy move. While it is true that job creation is still positive, it appears that the rate of job creation might be decelerating.

As people continue to leave the workforce, this drives down the unemployment rate, and while some might think a lower level is good, it doesn’t show us the entire picture. We need more people entering the labor force, and this move is an indication that job creation is more sluggish than the Federal Reserve would like to see.

The real problem for the Federal Reserve is that this is just one data point, and others are indicating that a recovery in the economy is coming, and along with it should be some level of job creation.

Last week also saw the release of the Institute for Supply Management’s (ISM) report, which noted an increase in the Purchasing Managers’ Index (PMI) for both manufacturing and non-manufacturing industries. (Source: Institute for Supply Management, September 3-5, 2013.)

This leaves the Federal Reserve in a bind, as the data for the past month show a deceleration in job creation, but some forward-looking data is turning increasingly positive.

If the Federal Reserve moves too quickly, they could put a drag on job creation and the economy before escape velocity has been reached. If they move too slowly, this could cause issues with imbalances in the economy.

I would caution readers that over the next few weeks, the market will be quite volatile, regardless of the outcome. Because so many portfolio managers are ready to adjust their strategies based on this Federal Reserve meeting, this could cause significant moves in the market.

At the end of the day, I do think that the Federal Reserve will begin to reduce its asset purchase program by the end of the year, perhaps September or even as late as December.

While job creation is not occurring at a rapid rate, I think the risks of the current asset purchase program are rising, and this will cause the Federal Reserve to at least begin, at the margin, a shift in monetary policy.

We’ve already begun to see the result: higher interest rates. I’ve been telling readers to expect higher interest rates for almost a year now, and while the Treasury market might consolidate the move over the past couple of months, higher interest rates are here to stay.

See the original article >>

Bull Continuation Patterns - Library video 1

By Tothetick Education

Topic: Working Bullish Continuation Patterns with real chart data
Objective: 1st video in the library to examine the 'unfolding' of Bullish Continuation Patterns as a Group

Larger Price Pattern in Focus: Bull Expanding Triangle - the "tomahawk"

Highly suggest as a Challenge…Watch the video before looking at the attachments.

Attachments:

  1. Clean screenshot of the chart used in presentation with basic references.
  2. (Seeing this KEY information before the video will alter  your perspective…)Same chart ‘pinched’ to show more background history of instrument.

Please review the following basic information on continuation patterns as a group and why building on your ability to review price action in various patterns & with different areas of focus increases your learning curve effort & 'stacks your deck'.

Continuation patterns indicate a pause in trend & that the previous direction of the trend will be resumed after the consolidation. The reasons for both continuation patterns & reversal patterns are that the trend, whether it is up or down, cannot continue in the direction in which it is travelling forever. There has to be either a pause in time & in price or a change in price action direction. Visually price action 'creates' chart patterns in different forms or shapes. Learn to correctly identify; & then follow the structural guidelines they offer, & these patterns will subsequently help you to become a successful trader.

The basics of doing any chart analysis are that we know that history repeats itself. Chart patterns take time to form. Reviewing charts allows us to choose an instrument & focus our study on the previous process involved in creating a price Trend as well as what it takes to Reverse or 'turn a trend'. This background research with the anticipation of patterns repeating offers traders confidence. For any trader, trading any instrument, it is highly recommended to do your due diligence & Focus attention on the price history of your chosen instrument.

Bullish Continuation patterns as a group offers many trades in any time frame using any instrument and in any market. Their versatility and repetition offers the focused trader many profitable opportunities regardless of trading style. This video is meant to be a starting tool for traders looking to learn how to identify and work bullish continuation price action using real chart data. For this reason additional videos will be added periodically to this topic to assist traders in an on-going effort in 'putting it all together'.

bull continuation vid 1 clean exp tri SwL apr5 went+60 A11 es 60m 1 start Mar 5 es 60m bull cont vid1 background exp tri SwL apr5 went+60 A11 es 60m 1 start Mar 5 es 60m

See the original article >>

Bull Continuation Patterns

By Tothetick Education

This video is a summation of the process involved in identifying & then trading a Bullish Continuation pattern. The focus is on the opportunities offered from these patterns as a collective group. Note that all the individual patterns in this category are offered independently here on the website with their own video, text analysis, & chart example(s).

Continuation patterns indicate a pause in trend & that the previous direction of the trend will be resumed after the consolidation. The reasons for both continuation patterns & reversal patterns are that the trend, whether it is up or down, cannot continue in the direction in which it is travelling forever. There has to be either a pause in time & in price or a change in price action direction. Visually price action 'creates' chart patterns in different forms or shapes. Learn to correctly identify; & then follow the structural guidelines they offer, & these patterns will subsequently help you to become a successful trader.

The basics of doing any chart analysis are that we know that history repeats itself. Chart patterns take time to form. Reviewing charts allows us to choose an instrument & focus our study on the previous process involved in creating a price Trend as well as what it takes to Reverse or 'turn a trend'. This background research with the anticipation of patterns repeating offers traders confidence. For any trader, trading any instrument, it is highly recommended to do your due diligence & Focus attention on the price history of your chosen instrument.

Bullish Continuation patterns as a group offers many trades in any time frame using any instrument and in any market. Their versatility and repetition offers the focused trader many profitable opportunities regardless of trading style. This video is meant to be a starting tool for traders looking to learn how to identify and work bullish continuation price action using real chart data. For this reason additional videos will be added periodically to this topic to assist traders in an on-going effort in 'putting it all together'.

See the original article >>

Orange juice gains as storm forms in Atlantic

By Jack Scoville

FCOJ

General Comments:  Futures closed higher as a tropical storm formed in the Eastern Atlantic and threatened to become the first hurricane of the year.  The storm is not going to come anywhere close to Florida, but it gave traders a reason to buy, anyway.  The storm shows that the conditions in the Atlantic might be improving.  The historically biggest part of the season is coming up.  There are still no real threats showing in the tropical Atlantic for Florida.  Growing conditions in the state of Florida remain mostly good.  Showers are reported and conditions are said to be very good in almost the entire state.  Temperatures are warm.  Brazil is seeing near normal temperatures and mostly dry weather, but production areas will turn warmer again this weekend.

Overnight News:  Florida weather forecasts call for some showers.  Temperatures will average near normal.

Chart Trends:  Trends in FCOJ are mixed.  Support is at 134.00, 131.00, and 129.00 November, with resistance at 139.00, 140.00, and 142.00 November.

COTTON

General Comments:  Futures closed higher as traders started to get ready for the USDA reports on Thursday.  Many areas are turning hot and dry again, and this created some buying interest as well.  China issued some positive economic data over the weekend to help demand ideas stay afloat after the stronger than expected export sales report from last week.  US crop development remains behind due to delayed planting this year, but crop conditions right now are generally good.  Weather is warm in the US, with the Delta and the Southeast expecting above normal temperatures into the weekend.  Texas is dry and warm.  Weather for Cotton still appears good in India.  The market is getting ready for the harvest, and any rallies now might be very limited in scope.

Overnight News:  The Delta will be dry and Southeast will see a few showers late in the week.  Temperatures will average above normal in the Delta and mostly above normal in the Southeast.  Temperatures should start to turn cooler this weekend.  Texas will see dry weather.  Temperatures will average above normal.  The USDA spot price is now 80.29 ct/lb.  ICE said that certified Cotton stocks are now 0.018 million bales, from 0.018 million yesterday. 

Chart Trends:  Trends in Cotton are mixed.  Support is at 82.80, 82.30, and 81.80 October, with resistance of 84.20, 85.05, and 85.30 October.

COFFEE 

General Comments: Futures were little changed in all markets.  It was another quiet session, with buyers and sellers once again showing little interest in trading.  Even new production data from Brazil and Colombia did little to move the market as the data was in line with trade expectations.  Meanwhile, the Real was stronger and this helped support New York futures.  The cash market seemed relatively quiet.  Most Brazil Coffee producers are not offering much right now.  Coffee appears to be available in Central America as farmers and mills clear inventories before the next harvest.  Colombia is offering Coffee into the cash market at weaker differentials.  Buyers are said to be well covered.  Current crop development is still good this year in most production areas of Latin America.  Central America crop conditions are said to be good overall.  Colombia is still reported to have good conditions.  Harvest conditions are good in Brazil.

Overnight News:  Certified stocks are a little higher today and are about 2.784 million bags.  The ICO composite price is now 112.89 ct/lb.  Brazil should get dry conditions.  Temperatures will average near to above normal.  Colombia should get scattered showers, and Central America and Mexico should get showers and rains.  Temperatures should average near to above normal.  Colombia produced 770,000 bags of Coffee in August.  Production for the last 12 months now totals 9.6 million bags, up 26% from the previous 12 months.  In Brazil, Conab expects production to be 47.5 million bags for this year, including 36.7 million bags of Arabica and 10.9 million bags of Robusta.

Chart Trends:  Trends in New York are mixed.  Support is at 116.00, 114.00, and 111.00 December, and resistance is at 120.00, 122.00, and 125.00 December.  Trends in London are mixed.  Support is at 1750, 1730, and 1720 November, and resistance is at 1800, 1825, and 1840 November.  Trends in Sao Paulo are down with objectives of 134.50 and 123.50 December.  Support is at 139.00, 137.00, and 134.00 December, and resistance is at 145.50, 148.50, and 150.50 December.

SUGAR          

General Comments:  Futures closed a little higher on strength in the Brazilian Real.  There is not much on offer in the cash market for now, and that is helping Sugar futures hold the recent range.  Processors in Brazil remain more interested in Ethanol production.  There is good weather for Sugar production in India, and the crop is expected to be big there.  Countries like Thailand and India also expect more production this year, and both countries are actively offering their supplies into the world market.  Demand for ethanol has been good.  Chinese demand has been soft, but Middle East demand is good.  Prices appear to be in a trading range for now due to solid demand and big production.  Short term trends are now sideways.

Overnight News:  Brazil could see dry weather and moderate temperatures.  China produced 137,000 tons of Sugar in July, up 15.1% from last year.  Calendar year to date production is now 11.05 million tons, up 14.8% from last year. 

Chart Trends: Trends in New York are up with objectives of 1780 March.  Support is at 1710, 1700, and 1680 March, and resistance is at 1750, 1765, and 1780 March.  Trends in London are up with objectives of 494.00 December.  Support is at 479.00, 475.00, and 471.00 December, and resistance is at 486.00, 494.00, and 496.00 December.

COCOA         

General Comments:  Futures closed a little lower in consolidation trading.  Data showing strong arrivals in Ivory Coast helped create a little selling interest.  There is not much offer now as West Africa is between crops.  Ideas are that crop conditions there are generally improving.  West Africa is expected to get scattered showers, and conditions there are said to be improving for almost all producers.  Temperatures are moderate.  The harvest will be getting underway soon.  Malaysia and Indonesia crops appear to be in good condition and weather is called favorable.   Ivory Coast arrivals are now 1.372 million tons, from 1.359 million last year.

Overnight News:  Scattered showers are expected in West Africa.  Temperatures will average near normal.  Malaysia and Indonesia should see scattered showers, but southern áreas could be dry.  Temperatures should average above normal.  Brazil will get mostly dry conditions and warm temperatures.  ICE certified stocks are lower today at 4.521 million bags.

Chart Trends:  Trends in New York are up with objectives of 2610 and 2720 December.  Support is at 2545, 2525, and 2505 December, with resistance at 2590, 2605, and 2620 December.  Trends in London are up with objectives of 1710 and 1770 December.  Support is at 1670, 1660, and 1650 December, with resistance at 1710, 1740, and 1770 December.

See the original article >>

India rupee in biggest four-day gain since 1973 after U.S. data

By Jeanette Rodrigues

India’s rupee rose 6.1% in the past four days, the biggest gain since at least 1973, as U.S. jobs data that fell short of estimates tempered concern the Federal Reserve will cut stimulus this month.

Non-farm payrolls in the U.S. climbed 169,000 in August, official data showed Sept. 6, trailing the 180,000 median estimate in a Bloomberg survey. Indian markets were shut yesterday for a local holiday. The Reserve Bank of India last week announced a plan to provide concessional swaps for banks’ foreign-currency deposits to boost the supply of dollars.

The rupee gained 2.2% from Sept. 6 to 63.84 per dollar in Mumbai, according to prices from local banks compiled by Bloomberg. It strengthened past 64 for the first time since Aug. 26 to as high as 63.765. The currency, which touched an all-time low of 68.845 on Aug. 28, advanced 6.1% in the four trading days through today, the biggest gain in data compiled by Bloomberg going back to 1973.

“The rupee’s move is due to the positive sentiment generated after the payrolls data and the measures taken by the RBI,” said Ashtosh Raina, head of foreign-exchange trading at HDFC Bank Ltd. in Mumbai. The currency could strengthen to around 63 per dollar before resuming its drop because of India’s weak economic fundamentals, he said.

The S&P BSE Sensex rose 3.8% to 19,997.10 today, the biggest gain since May 2009. The yield on the benchmark 10-year government bond fell 16 basis points to 8.47%.

Trade Deficit

India’s trade deficit narrowed to $10.9 billion in August from $14.2 billion a year ago, a government report showed today. Total imports fell 0.7% to $37.1 billion even as oil shipments surged 18% to $15.1 billion. Exports rose 13%. China’s exports rose 7.2% last month from a year earlier, the General Administration of Customs said Sept. 8. That exceeded the 5.5% median estimate of analysts.

Global funds have cut holdings of Indian debt by $10.2 billion since May 22, when Fed Chairman Ben S. Bernanke first flagged a potential paring of stimulus, leaving the rupee vulnerable to the nation’s current-account deficit. The shortfall in the broadest measure of trade widened to a record 4.8% of gross domestic product in the year ended March 31 as growth eased to 5%, the slowest pace in a decade.

“An environment of better global growth and weak domestic demand should correct the current-account deficit this fiscal year,” Sonal Varma, an economist at Nomura Holdings Inc. in Mumbai, wrote in a research report today. “We expect financing of the deficit to remain difficult.”

Meeting Delayed

The Fed has said the jobs market needs to show signs of improvement to warrant any trimming of asset purchases as policy makers prepare to meet Sept. 17-18 to review the plan. Raghuram Rajan, who took charge as RBI governor on Sept. 4, announced the same day that he has postponed the Indian central bank’s meeting to Sept. 20 from Sept. 18 to give him “enough time to consider all major developments in the required detail.”

One-month implied volatility in the rupee, a measure of expected moves in the exchange rate used to price options, fell 199 basis points, or 1.99 percentage point, to 18.03%.

Three-month onshore rupee forwards rose 1.8% from Sept. 6 to 65.59 per dollar, data compiled by Bloomberg show. Offshore non-deliverable contracts climbed 1.1% to 65.95. Forwards are agreements to buy or sell assets at a set price and date. Non-deliverable contracts are settled in dollars.

See the original article >>

A Dream for the Digital Age

by Peter Singer

PRINCETON – Fifty years ago, Martin Luther King dreamed of an America that would one day deliver on its promise of equality for all of its citizens, black as well as white. Today, Facebook founder Mark Zuckerberg has a dream, too: he wants to provide Internet access to the world’s five billion people who do not now have it.

This illustration is by Dean Rohrer and comes from <a href="http://www.newsart.com">NewsArt.com</a>, and is the property of the NewsArt organization and of its artist. Reproducing this image is a violation of copyright law.

Illustration by Dean Rohrer

Zuckerberg’s vision may sound like a self-interested push to gain more Facebook users. But the world currently faces a growing technological divide, with implications for equality, liberty, and the right to pursue happiness that are no less momentous than the racial divide against which King preached.

Around the world, more than two billion people live in the Digital Age. They can access a vast universe of information, communicate at little or no cost with their friends and family, and connect with others with whom they can cooperate in new ways. The other five billion are still stuck in the Paper Age in which my generation grew up.

In those days, if you wanted to know something but did not own an expensive encyclopedia (or your encyclopedia was no longer sufficiently up-to-date to tell you what you wanted to know), you had to go to a library and spend hours searching for what you needed. To contact friends or colleagues overseas, you had to write them a letter and wait at least two weeks for a reply. International phone calls were prohibitively expensive, and the idea of actually seeing someone while you talked to them was the stuff of science fiction.

Internet.org, a global partnership launched by Zuckerberg last month, plans to bring the two-thirds of the world’s population without Internet access into the Digital Age. The partnership consists of seven major information-technology companies, as well as non-profit organizations and local communities. Knowing that you cannot ask people to choose between buying food and buying data, the partnership will seek new, less expensive means of connecting computers, more data-efficient software, and new business models. 

Microsoft founder Bill Gates has suggested that Internet access is not a high priority for the poorest countries. It is more important, he says, to tackle problems like diarrhea and malaria. I have nothing but praise for Gates’s efforts to reduce the death toll from these diseases, which primarily affect the world’s poorest people. Yet his position seems curiously lacking in big-picture awareness of how the Internet could transform the lives of the very poor. For example, if farmers could use it to get more accurate predictions of favorable conditions for planting, or to obtain higher prices for their harvest, they would be better able to afford sanitation, so that their children do not get diarrhea, and bed nets to protect themselves and their families against malaria.

A friend working to provide family-planning advice to poor Kenyans recently told me that so many women were coming to the clinic that she could not spend more than five minutes with each. These women have only one source of advice, and one opportunity to get it, but if they had access to the Internet, the information could be there for them whenever they wanted it.

Moreover, online consultations would be possible, sparing women the need to travel to clinics. Internet access would also bypass the problem of illiteracy, building on the oral traditions that are strong in many rural cultures and enabling communities to create self-help groups and share their problems with peers in other villages.

What is true for family planning is true for a very wide range of topics, especially those that are difficult to speak about, like homosexuality and domestic violence. The Internet is helping people to understand that they are not alone, and that they can learn from others’ experience.

Enlarging our vision still more, it is not absurd to hope that putting the world’s poor online would result in connections between them and more affluent people, leading to more assistance. Research shows that people are more likely to donate to a charity helping the hungry if they are given a photo and told the name and age of a girl like those the charity is aiding. If a mere photo and a few identifying details can do that, what might Skyping with the person do?

Providing universal Internet access is a project on a scale similar to sequencing the human genome, and, like the human-genome project, it will raise new risks and sensitive ethical issues. Online scammers will have access to a new and perhaps more gullible audience. Breaches of copyright will become even more widespread than they are today (although they will cost the copyright owners very little, because the poor would be very unlikely to be able to buy books or other copyrighted material).

Moreover, the distinctiveness of local cultures may be eroded, which has both a good and a bad side, for such cultures can restrict freedom and deny equality of opportunity. On the whole, though, it is reasonable to expect that giving poor people access to knowledge and the possibility of connecting with people anywhere in the world will be socially transforming in a very positive way.

See the original article >>

America’s Bond-Market Blues

by Zhang Monan

BEIJING – The market for United States Treasury securities is one of the world’s largest and most active debt markets, providing investors with a secure stock of value and a reliable income stream, while helping to lower the US government’s debt-servicing costs. But, according to the US Treasury Department, overseas investors sold a record $54.5 billion in long-term US debt in April of this year, with China slashing its holdings by $5.4 billion. This dumping of US government debt by foreign investors heralds the end of an era of cheap financing for the US.

This illustration is by Margaret Scott and comes from <a href="http://www.newsart.com">NewsArt.com</a>, and is the property of the NewsArt organization and of its artist. Reproducing this image is a violation of copyright law.

Illustration by Margaret Scott

As it stands, the US government holds roughly 40% of its debt through the Federal Reserve and government agencies like the Social Security Trust Fund, while American and foreign investors hold 30% each. Emerging economies – many of which use large trade surpluses to drive GDP growth and supplement their foreign-exchange reserves with the resulting capital inflows – are leading buyers of US debt.

Over the last decade, these countries’ foreign-exchange reserves have swelled from $750 billion to $6.3 trillion – more than 50% of the global total – providing a major source of financing that has effectively suppressed long-term US borrowing costs. With yields on US ten-year bonds falling by 45% annually, on average, from 2000 to 2012, the US was able to finance its debt on exceptionally favorable terms.

But the ongoing depreciation of the US dollar – which has fallen by almost half since the Bretton Woods system collapsed in 1971 – together with the rising volume of US government debt, undermines the purchasing power of investors in US government securities. This diminishes the value of these countries’ foreign-exchange reserves, endangers their fiscal and exchange-rate policies, and undermines their financial security.

Nowhere is this more problematic than in China, which, despite the recent sell-off, remains by far America’s largest foreign creditor, accounting for more than 22% of America’s foreign-held debt. Chinese demand for Treasuries has enabled the US to increase its government debt almost threefold over the last decade, from roughly $6 trillion to $16.7 trillion. This, in turn, has fueled a roughly 28% annual expansion in China’s foreign-exchange reserves.

China’s purchases of American debt effectively transferred the official reserves gained via China’s trade surplus back to the US market. In early 2000, China held only $71.4 billion of US debt and accounted for 8% of total foreign investment in the US. By the end of 2012, this figure had reached $1.2 trillion, accounting for 22% of inward foreign investment.

But China’s reserves have long suffered as a result, yielding only 2% on US ten-year bonds, when they should be yielding 3-5%. Meanwhile, outward foreign direct investment yields 20% annually, on average. So, whereas China’s $3 trillion in foreign-exchange reserves will yield only about $100 billion annually, its $1.53 trillion in foreign direct investment could bring in annual returns totaling around $300 billion.

Despite such low returns, China has continued to invest its reserves in the US, largely owing to the inability of its own under-developed financial market to generate a sufficient supply of safe assets. In the first four months of this year, China added $44.3 billion of US Treasury securities to its reserves, meaning that such debt now accounts for 38% of China’s total foreign-exchange reserves. But the growing risk associated with US Treasury bonds should prompt China to reduce its holdings of US debt.

The US Federal Reserve’s announcement in May that it may wind down its quantitative easing (QE) program – that is, large-scale purchases of long-term financial assets – by the end of this year has sparked fears of a 1994-style bond-market collapse. Concerns that a sharp rise in interest rates will cause the value of bond portfolios to plummet have contributed to the recent wave of foreign investors dumping US debt – a trend that is likely to continue to the extent that the Fed follows through on its exit from QE.

Yields on ten-year US bonds are now 2.94%, a 58% increase since the first quarter of this year, causing the interest-rate gap between two- and ten-year bonds to widen to 248 basis points. According to the Congressional Budget Office, the yield rate on ten-year bonds will continue to rise, reaching 5% by 2019 and remaining at or above that level for the next five years. While it is unlikely that this will lead to a 1994-style disaster, especially given that the current yield rate remains very low by historical standards, it will destabilize the US debt market.

For China, the benefits of holding large quantities of US dollars no longer outweigh the risks, so it must begin to reduce the share of US securities in its foreign-exchange reserves. Given that China will reduce the overall size of its reserves as its population ages and its economic-growth model shifts toward domestic consumption, a substantial sell-off of US debt is inevitable – and, with it, a large and permanent increase in America’s financing costs.

See the original article >>

Observations on Stocks and Bonds

by Pater Tenebrarum

SPX Retakes 50 dma

Yesterday's move in the SPX back above the 50 day moving average bore a very close resemblance to the last occurrence in early July. As the chart below shows, both the price movements prior to the break, MACD and the relative position of the 20 day moving average looked almost exactly similar:


SPXSPX: regaining the 50 day moving average in a similar manner as in early July – click to enlarge.


Different Levels of Bullishness Displayed in Positioning/Sentiment Data

What is different are a number of ancillary data. For instance, there is far more enthusiasm about this move in the option pits than there was last time around, but there is less bullishness detectable in sentiment surveys. This may be partly due to the relative strength in technology shares, which never really corrected much. The options of many big cap tech stocks are quite heavily traded.


equity p-c

The CBOE equity put-call ratio was far lower on Monday's regaining of the 50 dma than on the occasion of the early July move – click to enlarge.


consensus inc

Curiously, there is somewhat less bullishness in sentiment surveys – this is the Consensus Inc. survey, but other surveys show similar tendencies – click to enlarge.


NDXThe NDX diverges by making a new high – its relative strength may explain the fairly sanguine stance of option traders – click to enlarge.


Bond Yields Are Higher This Time

And here is another difference to the situation in early July -  bond yields are higher this time around:


TNX10 year note yield: it still looks to us like it wants to go even higher – click to enlarge.


At the moment, stock market participants are evidently not worried about higher bond yields, since they are seen as a sign of improving economic growth and are not yet deemed high enough to seriously impair stocks on a comparative/competitive basis. However, if yields continue to go higher and especially if they do so quickly, the bond market will become a problem for stocks at current valuations.

Note that although there are sentiment and positioning extremes in bonds and notes (according to surveys and futures positioning), the chart of the t-note yield shown above continues to look bullish (i.e., bearish for bond prices). It is still sporting the 'running correction' look we have previously pointed out, and there may even be a first and second wave in by now, or a series of them (we will know soon whether that is the case). No matter which way one slices it, the chart as such indicates that higher yields are likely in the offing.


One possibility worth considering is that the SPX will make a third run-up in a 'three runs to a top' type formation (an ending diagonal in e-wave terms), and that bond yields will continue to rise while this happens – provided the retaking of the 50 dma holds up and the index is not immediately rejected again similar to late August. There is also still a little time before a potentially troublesome news backdrop begins to unfold, in the form of the FOMC meeting next week, the upcoming debt ceiling debate in the US and the German election – all of which could prove to be short term trigger events.

See the original article >>

I AM BULL!

by Greg Harmon

So much negativity in sentiment recently. It truly seems that most people not only are leaning bearish but that they want the markets to go lower. That just seems un-American to me. You have heard all of the issues for the bear case. Low volume, Taper coming, Syria (seriously???), divergences in the indicators, the lack of participation from the Generals. All of these ignore one major point. Stocks are making new highs and putting in higher lows. I am not throwing caution to the wind but how about looking at the bull case for a minute or two before you cut your wrists and down a bottle of bourbon. Here are 4 pictures that look bullish to me on multiple timeframes. Let’s start with the shorter run.

spy

The S&P 500 ($SPY) shock off the Hanging Man candle Friday and moved strongly higher Monday. Now it is into the gap and in the middle of a Shark Harmonic. The Potential Reversal Zone (1) is at 169.24 and PRZ (2) is at 170.65, just shy of the all-time high. The positions of the gaps are different and the current levels compared to the recent highs, but on a short term basis the Dow Jones Industrials ($DIA), Russell 2000 ($IWM) and Nasdaq 100 ($QQQ), are all showing the same pattern, and making new highs over the August 26th peak. lets move a little further out.

dia

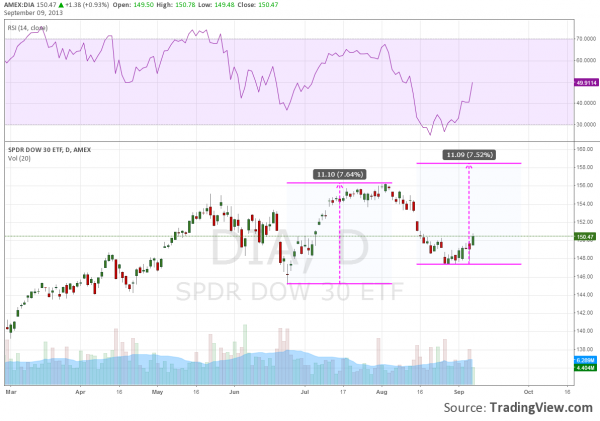
The DIA above shows yet another bullish pattern when you expand the chart out a bit. After rising from the November lows it began a pullback in May. The low set on June 24th then rebounded higher before making another low August 28th and turning back up. There is something bullish about this recent low. It creates a Positive RSI Reversal, where the RSI makes a new low while the the price does not. This gives a target higher equal to the previous move. For the DIA that would mean a new all-time high at 158.44. This RSI Positive Reversal is found in the charts of the QQQ, IWM and SPY as well. Ok, another step out.

iwm w

The IWM on the weekly chart shows that it has held the rising trend support from the November lows. The latest bottom touched it again but it has held and is moving back higher. The DIA also touched the rising trend before reversing but the SPY stopped a little short of the trend and the QQQ is just waving at it as it goes higher. Every one f thee indexes is in an uptrend and looks to be renewing that uptrend. But it gets better still.

qqq m

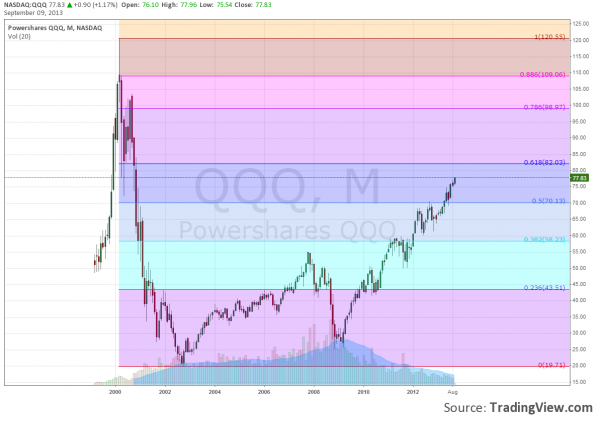
Finally the chart of the QQQ on a monthly timeframe shows longer term, since the 2009 lows, the uptrend is not only intact but making new highs. The QQQ is out in front today, maybe because it still has ground to make up from the tech bubble sell off, but the SPY, DIA and IWM are all a Phil Mickelson flop shot away from their all-time highs.

All of these trends on all of these time scales can reverse. And if they do I will change my mind. But the price action now makes me stand up and say I AM BULL, even if I am the only one in the room doing it.

See the original article >>

Euro Area: Fiscal Mess Continues to Get Worse

by Pater Tenebrarum

Targets, Shmargets

Bloomberg's editors have produced yet another confusing headline (whoever is responsible for these headlines should probably consider a career at the Onion):

Spain’s Deficit Struggle Shows Threat to ECB Rally”.

Huh?  What's an 'ECB rally'? It turns out they mean the rally in bond markets allegedly caused by the ECB's interventions, respectively intervention threats. One should of course never make the mistake of underestimating central banks – after all, they can print money in unlimited amounts. The idea that the  rebound in peripheral bonds is entirely due to the ECB strikes us however as an overestimation of the central bank's power, combined with a dash of 'post hoc, ergo propter hoc' fallacy. Central banks are certainly powerful entities in terms of their influence on financial markets, but they are not omnipotent.

We believe the rallies in the government bonds of Spain and Italy specifically were mainly caused by the following factors: an easing of balance of payments related strains (as evidenced by a slight contraction in TARGET-2 imbalances), in Spain's case a marked decline in unit labor costs, and in the case of both countries massive buying of the government's debt by commercial banks that are playing the ECB funded carry trade. The latter started right after former French president Sarkozy was heard recommending the tactic as an aside at one of the many EU emergency summits. This indicates that the surge in bond buying was the result of some sort of sub rosa 'you scratch my back and I'll scratch yours' agreement between the banks and the governments of their host countries. For instance, Italy's government transformed many otherwise ineligible bank securities into ECB-pawnable paper by sanctifying them with a 'state guarantee'. And promptly, tit for tat, the banks started buying Italian paper en gros – certainly a suspicious coincidence.

Anyway, Bloomberg lets us in on the fact that to no-one's particular surprise, Spain is going to miss its fiscal targets yet again:

“Spain’s bid to meet its budget-deficit target for the first time in five years is running into trouble, fueling concerns that increased financial stability is masking deeper economic problems.

The shortfall for the central government in the first seven months of the year was 4.38 percent of Spanish output, compared with a 3.8 percent goal for the year, government data show. Economists at the savings banks’ foundation Funcas, Mizuho International and Bank of America Merrill Lynch said Spain may miss the European Union’s overall goal for this year of 6.5 percent as benefit spending climbs and tax income falters.

[…]

“Probably influenced by crisis fatigue and criticism of European austerity policies, the European Commission has overlooked the lack of progress this year in some structural reforms and the deficit,” said Ruben Segura-Cayuela, a former Bank of Spain economist who works at Bank of America Merrill Lynch in London. “The key question is whether rating agencies will also look the other way.” He forecasts a 7 percent deficit this year.”

[…]

Prime Minister Mariano Rajoy is struggling to cut Spain’s deficit after raising levies on income, savings and property since taking office in December 2011. Last year, he increased the sales tax, with the main rate rising by 3 percentage points to 21 percent, and he reduced corporate-tax deductions in July.

“We expect to end the year meeting the deficit target for the public sector overall,” Deputy Budget Minister Marta Fernandez Curras said in an e-mailed response to questions. Spain’s reforms are likely to “produce a greater increase in revenue in the last part of the year,” she said.”

(emphasis added)

Hasn't the crisis just been 'officially called off'? Prime minister Rajoy is 'struggling'? It seems to us that the people who are really struggling in Spain are its much oppressed tax payers. We highlighted the method by which Spain's and other European austerity plans are put into effect above:  raising taxes is the preferred modus operandi, and that is why EU austerity keeps not working.

There are indeed 'deeper economic problems'. The promised structural reforms are implemented at a snail's pace and are going nowhere near far enough. Government has continued to grow, even while the overall economy has shrunk. If anything, government should have been shrinking at a faster pace than the economy, which would have allowed it to cut rather than hike taxes. Pertinent historical examples of how to best implement austerity do exist: US president Harding demonstrated how it's done in 1921, and so did the Baltic states after 2008. Even in these cases a more effective implementation would have been possible, but the fundamental approach was the correct one: shrink government as fast as possible and repeal as many regulations standing in the way of business as you can. Bail out no-one. Grit your teeth and allow for a steep short term downturn, knowing that a sound foundation for renewed growth will be established. Obviously this is not how things were done in Spain, Italy Portugal or Greece (which will require yet another bailout – the third -  later this year).


Spain, 10 yr. yieldSpain's 10 year government bond yield – click to enlarge.


TARGET-2

Target-2 imbalances in the euro system – getting better, but still at levels far removed from the small fluctuations of the pre-crisis period – click to enlarge.


Italy's Finances Said to Be 'Slipping'

Reuters reports that Italy's public finances are 'slipping'. That makes it sound as though this were a new discovery, but that is actually not so. Italy's public finances have been 'slipping' forever, without respite. If one carefully reads the excerpt below, it becomes clear that Italy was only removed from the EU's 'blacklist' of fiscal offenders on the basis of its official 'fiscal target', and not  due to actually delivering better numbers.

“Italy, which three months ago got off the European Union's blacklist of countries with excessive fiscal deficits, may be put straight back on it next year unless it can reverse a worrying trend in its public finances.

Enrico Letta's government has been forced to respect the tax cutting promises of Silvio Berlusconi's People of Freedom Party (PDL), a vital part of the ruling coalition, while a deeper than expected recession is also weighing on state accounts.

Yet with Berlusconi's allies now threatening to bring down the government, growing political instability and wayward public finances risk creating a toxic combination that puts Italy back at the center of financial markets' attention.

Data this week showed the state sector borrowing requirement amounted to 60 billion euros at the end of August, almost twice as large as the 33 billion euro deficit in the same period of 2012.

The SSBR does not fully correspond to the broader "general government" deficit the EU uses to assess countries' fiscal performances, but it still suggests there may be a need for significant belt-tightening before the end of the year, something a fragile government may find hard to deliver.

Italy is targeting a general government deficit of 2.9 percent of output, just a fraction below the EU's 3 percent ceiling after the deficit was bang on 3.0 percent in 2012. On the basis of this target, set in April, the EU Commission removed Italy from its Excessive Deficit Procedure, allowing it some extra leeway for public spending.

However, since April Italy's economy has gone from bad to worse and the contraction then forecast at 1.3 percent is now seen at close to 2 percent, hurting tax revenues and pushing up the deficit as a proportion of gross domestic product.

Citigroup analyst Giada Giani said the last time the SSBR was so high at the end of August was in 2009, when the general government deficit came in at 5.5 percent of GDP.”

(emphasis added)

So Italy's most recent public borrowing requirements for August were twice those of the same period in 2012? Let's see what happened to Italy's public debt in 2012. Its net debt rose by more than 82 billion euro from 1.884 trillion to 1.966 trillion euro, a jump by 7 percent as a percentage of GDP:


italy-general-government-net-debt-imf-data (1)Italy's net government debt in euro terms: up another 82 billion in 2012 - click to enlarge.


italy-government-debt-to-gdpItaly's public debt as a percentage of GDP – click to enlarge.


In June of this year, the Bank of Italy reported that the total public debt of Italy had risen to a new record high of 2.075 trillion euro (note this was before its borrowing requirements for the month of August doubled vs. 2012):

“Italy‘s public debt reached in June 2013 to a record $ 2.075 trillion euros, according to the Italian Central Bank.

Thus, according to the data given in the statistical bulletin of the Bank of Italy, the growth of state debt has slowed significantly in June and compared to May amounted to only 600 million euros. In general, for the first six months of 2013 the national debt rose by 86.5 billion euros.

Reducing the rate of increase of debt of Italy explained by the significant increase in tax revenues, which in June amounted to 46.3 billion euros, 21.5% more than in June 2012.”

(emphasis added)

The rise of 'only' 86.5 billion euro can probably be explained by the fact that this refers to the gross number (it would have been 109 billion euro compared to the net debt total for 2012 shown above) . Other than that, this press release raises an obvious question, namely: WTF are they talking about? What 'slowdown in debt growth'? Total public debt has already grown more in the first half of the year than in all of 2012!

In any case, the main point we wish to make is that the proper headline for the Reuters article would have been: 'Italy's finances are now slipping even faster'. They never stopped 'slipping'. In 2013, Italy's government is slated to issue 460 billion euro in new debt including refinancing requirements. The eurocrats better hope that the markets  don't decide to make a fuss over this recent slight 'slipping' with respect to the fiscal target. If we simply extrapolate the first half number for all of 2013, then Italy's total public debt will rise by 193 billion euro this year, or almost 10%. Recent estimates that the debt-to-GDP ratio will slightly exceed 130% may therefore prove to be overoptimistic.

It should be noted at this point that the widely hailed 'success' of Mario Monti's reforms was largely a successful PR exercise. Nearly every measure implemented by the lifelong bureaucrat was a mistake of monumental proportions. The planned deficit consolidation relied mainly on the imposition of additional taxes in the middle of a recession. Obviously, government has continued to grow in the process. The structural reforms implemented by Monti's government, especially those of Italy's byzantine labor regulations, were de minimis. As a result, Italy has the by far worst record in terms of unit labor cost improvements in the periphery (in fact, there has been no improvement in Italy's case). All in all, Monti's so-called reforms were a complete failure . Here is a list of Italy's key economic and debt data, including several fantasy estimates for 2013:


Italy dataItaly, key data including estimates for 2013 that are essentially pure fantasy. Especially noteworthy is the fact that unit labor costs have so far utterly failed to decrease – click to enlarge.


Meanwhile, Italian bond yields appear to have produced a classical inverted head & shoulders bottom, complete with a price/RSI divergence at the lows:


Italy, 10 yr. yieldItaly's 10 year government bond yield – an inverted head and shoulders bottom? - click to enlarge.


Conclusion:

Perceptions about the euro area's debt situation may have changed, but nothing has changed in reality. The countries the markets were extremely worried about when both their absolute debt levels and their debt-to-GDP ratios were still much lower, continue to pile up public debt at a rapid pace.  As we mentioned at the beginning of the year, all the usual suspects will miss their 'fiscal targets' by a mile.

Addendum: Portugal

Below is a daily chart of Portugal's 10 year government bond yield. It appears the markets continue to expect a worsening of the already quite tense debt situation. Recently the Portuguese supreme court struck down yet another government measure aimed at lowering the expenses for the country's bureaucracy.

“Portugal's highest court has ruled that the government's plan to make it easier to sack public servants is unconstitutional. The court said the measures contravened state job safety guarantees.

It is a set-back for Portugal's policy of reducing government spending in the wake of an international bailout. The government has promised creditors a big reduction in its budget deficit. Other austerity measures have already been rejected by the same court.

The bill was seen as important because of its potential longer-term structural effect on spending cuts, Reuters news agency reports.”

(emphasis added)

The government may be bankrupt, but it still cannot sack any civil servants! This appears to be an example of one set of bureaucrats protecting another. 'Job safety guarantees'? Whoever came up with those guarantees was of course buying votes – and this is the result. What financial guarantees can a bankrupt government really be expected to uphold? In the end, even more tax hikes will likely be imposed so that the bureaucrats can continue to enjoy their 'job security' and the economic downward spiral will predictably intensify. European welfare statism has really reached the end of the road, even if many people still fail to acknowledge it.


Portugal, 10 yr. yieldPortugal's 10 year government bond yield, daily: rising again after the  latest supreme court rejection of the government's plans to slash spending on the bureaucracy – click to enlarge.

See the original article >>

Commercial Lending Suggests Weaker Employment

by Lance Roberts

Most people have now realized that the August employment report was less than desirable.  What really surprised analysts was the disconnect between what appeared to be stronger economic reports, from the recent manufacturing surveys, and job creation.  The chart below (courtesy of Zero Hedge) is from Trim Tabs which shows the range of estimates preceding the August employment report.

Trim-tabs-jobs-090513

With a median estimate of 179,000 jobs there were expectations that jobs would breach the 200,000 level.   The problem with these estimates, other than being overly bullish, is that the underlying economy is likely not as strong as some of the recent economic reports suggest on the surface.

One such measure of economic strength that I like to watch is "Commercial and Industrial Loans At All Commercial Banks."  If the economy is really improving, demand is increasing and employment is rising then businesses will seek, particularly in a low interest rate environment, funding for business expansions, capital expenditures and extension of credit.  The chart below shows the annualized percentage change in commercial and industrial loans as compared to economic growth.

Commercial-Lending-Economy-0909013

As you can see there is a fairly tight correlation between the annual changes in economic growth and the demand for commercial loans. Just as you would expect the recent downturn in loans has coincided with the downturn in the annual rates of economic growth.  While there are many expectations that the economy is set to improve through the end of this year the decline in business loans is suggesting that this may not be the case.

The next chart compares commercial lending trends to employment.  As I stated above; if businesses were indeed gearing up for stronger economic activity in the months ahead which would lead to an increase in hiring we should be seeing a reflection of this ramp up in commercial loans.  Again, commercial loans have a strong correlation to employment and the recent decline in commercial loans suggests that the weak employment report in August, and downward revisions in the prior months, is likely more consistent with the real level of underlying economic activity.

Commercial-Lending-Employment-2-0909013

While this is just one indicator of many that can used to evaluate economic strength the importance of commercial lending trends, as it relates to real economic activity, should not be lightly dismissed.   While the recent decline in lending activity is not necessarily indicative of an impending recession; it certainly does not suggest that stronger economic and employment growth is on the immediate horizon.

The recent bumps in manufacturing surveys are likely bounces in activity due to inventory restocking and short term pent up demand.  The sustainability of those increases are questionable given the spike in oil prices and rising interest rates which erode consumption.  This does not even factor in the potential impact of the Federal Reserve tapering off their support, potential tax increases/spending cuts from the upcoming debt ceiling debate or the onset of the Affordable Care Act in the months ahead.

For investors the point is that potentially overly optimistic assumptions on the economy, given the very weak state of revenue growth, could lead to disappointment down the road.  With recent revisions to GDP potentially masking underlying economic weakness it will be important to continue to pay attention to data that is a reflection of the "real" economy rather than a statistical one.  Such data will likely act as an "early warning" sign of issues that will potentially show up too late for mainstream analysis to be effective in hedging portfolio risks.

See the original article >>
Fastest wheat sales in six years diminish inventory

By Whitney McFerron

The U.S. and European Union are selling wheat at the fastest pace in at least six years, diminishing stockpiles even as farmers reap a record crop.

Sales from the U.S. in the past three months surged 38 percent from last year and export licenses issued by the 28- nation EU more than doubled, government data show. World inventories will drop to a five-year low by June 30 as farmers harvest 705.4 million metric tons, the U.S. Department of Agriculture estimates. Futures will rise 15 percent to $7.40 a bushel by the start of the next season on July 1, according to the median of 10 analyst estimates compiled by Bloomberg.

China, set to overtake Egypt as the biggest wheat buyer, may import three times more this season. Brazil already bought 41 times more from the U.S. since June 1, USDA data show. Demand increased as futures tumbled 32 percent from a four-year high in July 2012, as drought eased in the U.S., the biggest shipper. The EU is the second-largest exporter.

“Demand is so great with wheat that it’ll be ready for a pretty decent bounce,” said Jon Marcus, the president of the Lakefront Futures & Options LLC brokerage in Chicago who has followed grain markets for about two decades. “Prices have come down pretty significantly this year so I’m anticipating seeing some overseas demand, and it’s going to be significant.”

Grain Inventories

Wheat, last year’s best-performing commodity, tumbled 17 percent to $6.4375 on the Chicago Board of Trade since the start of January. The Standard & Poor’s GSCI gauge of 24 commodities advanced 2 percent, led by crude oil and cocoa, and the MSCI All-Country World Index of equities rose 10 percent. The Bloomberg U.S. Treasury Bond Index lost 4 percent.

Cheaper grain helped drive global food prices tracked by the United Nations to a 14-month low in August and is cutting costs for Flowers Foods Inc. and other bread makers.

Global wheat consumption of 706.81 million tons will outpace production for a second consecutive year, leaving inventories of 172.99 million tons, the lowest since the 2008-09 season, the USDA predicts. The agency will cut its forecast to 172.75 million tons when it releases new estimates at noon in Washington on Sept. 12, according to the average of 15 analyst estimates compiled by Bloomberg.

U.S. exporters sold 15.82 million tons of wheat since the marketing year began June 1, from 11.48 million tons at this time last year and the fastest pace since 2007, according to USDA data. EU export licenses since July 1 climbed to 4.47 million tons, from 2.13 million a year earlier and the most since at least 2004.

Winter Crops

Expanding supply in the former Soviet Union states may keep prices dropping until the end of the year. Harvests in Russia, Ukraine and Kazakhstan, the fifth, sixth and seventh biggest exporters, will rise 46 percent to 92.5 million tons as fields recover from dry weather, the USDA said. Russia’s wheat harvest had reached 39 million tons as of Aug. 28, up 22 percent from 32 million tons a year earlier, Agriculture Ministry data show.

Demand for wheat in animal feed may weaken as farmers take advantage of this year’s plunge in corn prices. U.S. livestock producers used 10.63 million tons last season, the most in 15 years, as the worst drought since the 1930s damaged the corn crop and pushed futures to a record $8.49 a bushel in August 2012. Feed use will drop 28 percent to 7.62 million tons this year, the USDA estimates.

Billion Bushels

Corn is the worst performing commodity this year in the S&P GSCI, sliding 33 percent to $4.6725. The USDA will predict record U.S. production of 13.64 billion bushels (346.5 million tons) on Sept. 12, 27 percent more than a year earlier, according to the average of 34 analyst estimates. Corn was as much as $2.035 cheaper than wheat in Chicago on Aug. 6, the biggest discount for most-active contracts since 2010.

Hedge funds and other speculators became less bearish on wheat in the past two months, trimming their net-short position to 38,390 futures and options from 50,152 in the week ended July 2, U.S. Commodity Futures Trading Commission data show.

Margins on the fresh dough sold by St. Louis-based Panera Bread Co. to its franchisees widened in the second quarter as wheat and labor costs dropped, Chief Financial Officer Roger Matthews said on a conference call with analysts July 24. Margins will keep improving in the second half of the year, said the CFO of the company with more than 1,700 bakery cafes in North America. Its shares will advance 14 percent to $190.39 in 12 months, the average of 18 analyst estimates shows.

Commodity Costs

Krispy Kreme Doughnuts Inc., based in Winston-Salem, North Carolina, bought more wheat in the past month, Chief Executive Officer James H. Morgan Jr. told analysts on a call Aug. 29. Prices were better than the company expected and “we don’t see any factors that have us very alarmed” about agricultural commodity costs in the next several quarters, he said. Shares of Krispy Kreme almost doubled this year in New York.

R. Steve Kinsey, the chief financial officer of Flowers Foods in Thomasville, Georgia, said on a call with analysts Aug. 13 that the company anticipates lower commodity costs in the second half of this year. Flowers bought the Wonder bread brand in July from bankrupt Hostess Brands LLC. The company will report a 78 percent gain in net income to $241.7 million this year, according to the mean of six analyst estimates.

China, the biggest wheat consumer, may import 9.5 million tons this season, the most in 18 years, the USDA estimates. The country already booked 3.76 million tons from the U.S., 10 times more than a year earlier. Prices for bread-quality wheat reached a record last month in China after rain and flooding in some provinces in May and June reduced yields and crop quality.

Egyptian Uprisings

Egypt, historically the biggest wheat buyer, may import 9 million tons this season, 8.4 percent more than a year earlier, the USDA estimates. The state-run General Authority for Supply Commodities purchased 1.97 million tons abroad since the start of July, 58 percent more than a year earlier. The military ousted President Mohamed Mursi in July, about a year after he was elected following the overthrow of his predecessor Hosni Mubarak in 2011.

Brazil bought 2.06 million tons of U.S. wheat since June 1, USDA data show. Production in Parana, the biggest growing area, may be 1.98 million tons, 27 percent less than a previous estimate, after frost damaged crops, the government estimates. Argentina, normally the largest supplier to Brazil, slowed shipments after greater-than-average rainfall and heat cut its harvest last season, Trade Ministry data show.

“We could see some excitement on the tender front heading toward the end of the year,” said Kieran Walsh, a broker of agriculturalderivatives at Aurel BCG in Paris. “Egypt had a bit of catching up to do, given they were out of the market with the civil unrest. There are some concerns about China and Brazil in terms of their domestic crops.”

See the original article >>

Follow Us