Thursday, February 10, 2011

China drought may 'devastate' wheat yields

by Agrimoney.com

The world's biggest wheat crop – China's – faces a "critical situation" if a drought across most of its range does not break, the United Nations has said, warning that cold temperatures could also "devastate yields".
The report was attributed with helping foster a revival in wheat prices to a fresh two-year high in Chicago.
The UN's food agency warned that "substantially-below normal" rainfall over the last four months, , had put some 5.2m hectares of winter wheat, an area significantly bigger than Denmark, at risk of drought damage.
By lowering snow cover, the conditions had also left the crop vulnerable to damage from low temperatures during the rest of the winter.
"Thus the ongoing drought is potentially a serious problem," the UN Food and Agriculture Organisation said in a so-called "early warning" alert.
"Adverse weather, particularly extreme cold temperatures, could still devastate yields.
"The situation could become critical is a spring drought follows the winter one, and/or the temperatures in February fall below normal."
'Serious risk'
The warning adds China to the list of countries, including Canada, Kazakhstan and Russia, whose wheat crops have suffered severe weather setbacks in recent months, while America's hard red winter wheat seedlings have also suffered from a lack of rain and snow.
Macquarie on Tuesday cautioned of a "serious risk of damage" to the US hard red winter crop from temperatures which are expected once again to fall below the -10 degrees Fahrenheit deemed a danger level by Kansas State University.
Last week, Barclays Capital warned that a "significant" drop in Chinese wheat production "could propel international prices strongly higher".
'Unnerves the trade'
The FAO alert was viewed a rebound foster a rise in wheat prices, which had earlier falling nearly 2% on another Chinese factor – a rise in interest rates.
Affected provinces, 2009 wheat crop, and as % of national output
Hebei: 12.22m tonnes, 10.9%
Henan: 30.51m tonnes, 27%
Jiangsu: 9.98m tonnes, 8.9%
Shandong: 20.34m tonnes, 18.1%
Shanxi: 2.53m tonnes, 2.2%
Total: 75.58m tonnes, 67%
Source: UN FAO
Tighter monetary policy is seen as potentially quelling China's huge demand for raw materials, such as cotton and soybeans, of which it is the top importer.
The crop warning "unnerves the trade", Don Roose, president of broker US Commodities, told Agrimoney.com.
"It means more concerns, more problems. It has most definitely been a support factor," he said, adding that the string of tenders from North Africa and Middle Eastern buyers, such as Algeria, Iraq and Jordan, had also supported sentiment.
History lesson
However, Jerry Gidel, at North America Risk Management Services, was sceptical over the potential for a poor Chinese crop to prove a lasting concern, especially given estimates that the country has huge reserves of the grain.
"I have got burnt a number of times over the years getting excited about Chinese weather," he said.
Chicago wheat for March stood 1.7% higher at $8.73 a bushel with an hour of trading to go, having touched a two-year top of $8.80 ¾ a bushel earlier.
 
Continue reading this article >>

Ethanol plants the 'villains' behind corn's rally

by Agrimoney.com

Ethanol plants, not speculators, are behind the surge in corn prices, Commerzbank said, urging authorities seeking to calm markets to examine the state-subsidised biofuels industry.
Speculators, whose net long position in Chicago corn has risen to its highest in more than two years, have had a role to play in the doubling of futures in the grain since late June.
"Financial investors are leaping on the bandwagon and fuelling the price increase," Commerzbank said.
"But they are not the main reason for the rally. The state-supported increase of the ethanol blend in the US is a major reason for the rise of corn prices in our view.
"Those who believe the remedy for rising food prices lies in stronger regulation should also consider the role of biofuels in this regard," the bank added.
'Ethanol binge'
The comments come as France as, in its term as president of the G20 group of leading economic nations, is pushing regulations to curb the speculators it blames for fuelling the crop price rally.
Without enhanced oversight, "we run the risk of food riots in the poorest countries and a very unfavourable effect on global economic growth", Nicolas Sarkozy, the French president, warned two weeks ago.
And they follow the cut on Wednesday by the US Department of Agriculture to its estimate for domestic corn inventories at the end of 2010-11 to a 15-year low of 675m bushels, reflecting in the main a higher estimate for corn use in making ethanol.
Biofuel plants are now expected to consume a record 4.95bn bushels of corn, equivalent to 40% of the American crop, 350m bushels more than the USDA initially expected.
And many analysts believe the consumption upgrade will not be the last, with Damien Courvalin at Goldman Sachs forecasting a final figure of 5.05bn bushels.
Rabobank analysts, highlighting an "ethanol binge" on the grain, said that current rates of the production of the biofuel, at 900,000 barrels a day, "implies corn use in excess of 5bn bushels" for the crop year.
'A good number' 
Chicago's March corn contract hit a fresh two-year high, for a spot lot, of $7.04 ¼ a bushel on Thursday before weakening in late deals, sapped by a stronger dollar and weakness in other crops.
The grain gain extra support from data on Thursday showing weekly US corn export sales at more than 1.2m tonnes, including deliveries for the 2011-12 season, well ahead of market forecasts of at best 950,000 tonnes.
"That's a good number," Mike Mawdsley, at Market 1, said, adding that it had helped push the grain back on track to meet US Department of Agriculture forecasts for the current crop year, which finishes at the end of August.
Export sales had met 61.3% of USDA expectations for the season, compared with an average of 61.8%.
"On its own, that's good. But where things get really interesting is if someone unexpected turns up to buy, like China," which many analysts believe will require significant imports this year.
"That's the wild card. If China wants 2m-3m tonnes, what's that going to do to the balance sheet

Continue reading this article >>

THE BOND VIGILANTES AWAIT PORTUGAL WITH OPEN ARMS

by Cullen Roche

Tuesday’s Portuguese bond auctions don’t appear to have rattled investors too badly, however, the math continues to grow increasingly challenging for them. According to EU officials, Portugal cannot sustain rates over 7%.  Of course, this is where bond vigilantes are pushing the yields.  For them, it’s a win win.  Why not get a nice fat yield with a government guarantee on top?   And at these continued rates that’s exactly what’s coming.
Portuguese 10 Year Yield

The FT reported today that the ECB was forced back into the market to help stabilize surging yields:
“The European Central Bank has intervened in eurozone bond markets for the first time in weeks, buying Portuguese debt amid fears that the country could yet seek an international rescue.
The ECB returned to the market on Thursday as Portugal’s cost of borrowing on 10-year debt jumped to a euro-era high of 7.63 per cent, traders said. The ECB temporarily suspended its bond-buying programme in mid-January.”
And the reasoning behind the ECB’s actions is simple when one looks under the hood at recent auctions.  As Place de Luxembourg explains, these auctions have deteriorated substantially:
“Despite the fact that this was a syndicated debt auction, they were very sneaky, as no ex-ante reference was made to the auction on the debt agency’s website.
In order to understand how the markets price Portugal, and in the impossibility of accessing ReuterThomson Datastream information, the best thing to do is to study the interest rates charged for this new line of debt. On this occasion, Portugal was charged a 6.4% interest rate. This you might be forgiven to think was an imporvement to the 6.67% it paid on its January auction, but you’d still be wrong. The truth is that these are 5 year bonds where as the previous were 10 year bonds. Actually at that time (January 2010), Portugal also auctioned a number of 5 year bond and the sad truth is that these were charged an interest of  5.449%. This implies that  for a similar time span, the cost of Portuguese borrowing increased by ~ 17.43%. So there is nothing to celebrate. It’s fair to conclude that the situation continues to get worse…”
So, Portugal appears to be on the chopping block and we all know it.  The EMU has made it abundantly clear that no defaults will be allowed, however, the situation could become politically strained when the markets take their focus off of Portugal and start looking at Spain.

Continue reading this article >>

The Inflation Tipping Point (Part Three of Four)

by John Butler

Alongside the evidence that credit deflation reversed into inflation around mid-2010, we also notice that commodity prices began to rise sharply around this time. Moreover, in most parts of the world, consumer price inflation began to pick up noticeably and by year end had reached the highest levels in years.

At this point, one can quite easily draw parallels with the massive surge in global commodity prices which occurred in the first half of 2008, immediately prior to the arrival of the global financial crisis. (More on this below.)

Commodity prices are once again rising rapidly in the US and elsewhere

The evidence is thus rather clear that the entire monetary transmission mechanism, from narrow to broad money; from broad money to credit and asset growth; from credit and asset growth to commodity and consumer price inflation; is now functioning. Indeed, it is functioning perhaps almost too well as one economy after another approach an inflation tipping point.

In this context, it is perhaps curious why the Fed remains so steadfastly committed to its Treasury bond purchasing program known as QE2. The official, current Fed position is twofold: First, inflation–at least based on how they prefer to measure it–is undesirably low; second, unemployment is undesirably high. As such, the Fed will most probably continue with QE2 and, if this does not change this situation in the coming months, consider expanding or extending the program. (Indeed, we consider this more likely than not).

In our view, the real reason why the Fed continues to stoke the inflationary fire may have more to do with the still-perilous state of the US financial system and the massive debt overhang which, naturally, needs to be serviced. It is much easier to service a debt which is depreciating quickly in real terms, even if it is growing in nominal terms. The Fed may claim to be aiming for just slightly higher inflation but it is possible that they are, in fact, seeking a significantly higher rate to shore up the banking system.

With informed observers of all kinds–investors, businesses and consumers–now smelling the inflationary smoke of rising commodity and consumer price inflation, the Fed’s continuing, unwavering commitment to create inflation could at any moment lead to dramatic changes in behavior. Once the tipping point is reached, the Fed will have lost the ability to control inflation without raising interest rates to punishing levels that will cause a major recession and possibly a financial crisis greater than that which struck in 2008. Why?

Consider how rational economic agents are likely to respond to the onset of clear and present inflation. Prices are already rising and the Fed has not shown the remotest willingness to reconsider its current policies. Investors, therefore, will keep right on chasing returns in asset markets, seeking to remain ahead of the inflation curve. Businesses will stockpile inventories of real assets in an attempt to do the same. Finally, households may begin to stockpile consumer goods. What will be the combined result of these activities? Well, by driving up demand for all manner of assets, and wholesale and consumer goods, they are going to exponentially reinforce the price inflation already underway.

As this sort of demand is not for consumption, but rather for stockpiling or hoarding, it is not positive for growth but rather quite the opposite; it is, rather, economically inefficient and stagflationary. Real consumption is not going to increase. Indeed, as prices rise, it is going to fall. Amidst structurally high unemployment, real wages are also going to fall.

Continue reading this article >>

The Inflation Tipping Point (Part Two of Four)


Turning now to the debate, the arguments of the deflationists have generally focused on the credit (or asset) definition of deflation. As long as credit is contracting, so the thinking goes, it matters not whether the central bank is growing the narrow money supply. Banks will simply sit on so-called “excess” reserves indefinitely as the credit contraction runs its course, which is probably going to be a period of years. As such, central bank money creation merely stabilizes the financial system; it does not transmit into fresh credit creation or economic activity and, therefore, does not necessarily contribute materially to commodity or consumer price inflation down the road.

US narrow money (M0) growth exploded in 2008-09
Certainly this seems an accurate description of what happened in 2008 and 2009. Credit markets collapsed; banks stopped lending; the Federal Reserve and other central banks created huge amounts of narrow money; yet while financial systems stabilized, this money did not flow into fresh credit creation, economic activity or consumer prices.

The inflationists, it would seem, were wrong, at least for a while. But to be fair, many of the inflationists focused primarily on monetary inflation, which has indeed been substantial, as pointed out above. In some cases the inflationists did predict a rapid or even simultaneous transmission from money creation into credit creation and along to commodity and consumer price inflation. Events in 2008-09 have shown this view to be false. But economic history as well as contemporary developments demonstrate that there is not a stable relationship over time between monetary inflation, credit inflation and commodity or consumer price inflation.

Mainstream, neo-Keynesian economics tends to place little value on monetary analysis for exactly this reason, that the link between money growth and consumer price inflation is impossible to model with reasonable accuracy and, as such, cannot usefully inform central bank monetary policy decision-making, focused as it supposedly is on maintaining a stable level of consumer prices.  But just because something is difficult to model does not mean that it does not exist. After all, it is impossible to model precisely the “tipping point” behavior of people in a crowded theatre as smoke accumulates or, alternatively, that of investors, businesses and households amidst growing evidence of rising prices. But would anyone deny that these phenomena are real and that they can pose large if unpredictable risks?

Thinking along these lines, we believe there is now ample evidence that, over the course of 2010, there was a transition from credit deflation to inflation and that this has been transmitted almost instantaneously into commodity and consumer price inflation. As such, there is a growing risk of reaching a tipping point beyond which rising inflation expectations will fundamentally alter economic calculation and action from the largest global businesses down to the smallest households, with damaging economic consequences.

US broad money (M2) growth bounced sharply in mid-2010
Turning to credit developments, measures of broad money growth decelerated sharply in 2008-09 but this trend reversed by mid-2010. M2 growth fell to only 1% y/y in early 2010 but has since picked up to around 4.5%. Also around this time, US commercial bank lending stabilized and, in more recent months, has increased slightly. Credit deflation has reversed into inflation.

The Inflation Tipping Point (Part One of Four)


The concept of a “tipping point” can apply to a wide range of phenomena. One classic example is that of a crowded theater slowly filling with smoke. At first, perhaps only one person notices the smoke and, comforted by the fact that others remain calm, remains seated, if slightly on edge. But then a handful of others also notice and become concerned.

Finally, at some point, these folks stop watching the show and instead start watching each other. As the growing concern across the theater becomes evident, someone finally makes for the exit, triggering a rush by others. Yet many of those rushing out might not have noticed any smoke. The critical point is reached not because more people notice the smoke; rather, more notice changes in others’ behavior and thus change their own.

The danger of inflation for economies and financial markets can also be understood in this way. As prices begin to creep higher, a few investors, businesses and households begin to notice. Rather than just going about their business as usual, they begin to watch the behavior of others more closely. Finally, a handful of economic agents suddenly change their behavior in a significant and highly visible way, triggering similar responses by others, who might not even have noticed that prices were rising.

What sorts of behavioral changes might those be? Perhaps investors begin to favor assets which protect against inflation. Perhaps businesses take out loans in order to finance stockpiles of inventories, in anticipation of higher prices. Perhaps consumers begin to do the same with durable household goods. By these very actions, investors, businesses and consumers all begin to reinforce a vicious inflationary circle, driving up prices for a broad range of goods. Regardless, once the inflation tipping point is reached, the rush to the exit–to protect against rising prices in some way–is likely to be disorderly and dangerous for the economy, with obvious consequences for financial markets.

Cast your eyes around the globe and it is clear that, in a growing number of countries, tipping points have already been reached. Since early last year there have been occasional food riots in various emerging market economies. The revolutions in Tunisia, Egypt and those brewing elsewhere at present reflect not only a persistent sense of illegitimacy of autocratic rule in much of the Muslim world but also the reality of rampant food price inflation in the souk (marketplace). While poverty is always a potential source of instability, when even the nascent middle-class in an emerging economy finds it is struggling merely to put food on the table, it is unlikely that the political order can remain unchanged for long.

The glaring reality of commodity and consumer price inflation around the world has now begun to shift the terms of debate between those expecting a prolonged deflation and those anticipating a transition to inflation in the aftermath of the global financial crisis of 2008. To understand why, let’s briefly explore the background of this debate and then turn to recent developments.

Before we do, we need to understand clearly the difference between monetary inflation/deflation, credit (or asset) inflation/deflation and, finally, commodity or consumer price inflation/deflation. Monetary inflation/deflation is the easiest to define as the supply of narrow money under the direct control of the central bank. (This is in contrast to broad money, which is created by bank lending).

Credit (or asset) inflation/deflation is more difficult to define because there are so many different forms of credit, ranging from bank time deposits–a form of broad money–to loans, leases or other forms of secured or unsecured debt. This is made all the more complicated because banks don’t normally mark their assets to market. Indeed, during the financial crisis, regulators gave banks additional flexibility to mark assets to “make-believe” rather than actual market prices. Whereas the price of a dollar is a dollar, that of a loan, a bond or other risky asset is uncertain and fluctuates with investor confidence that the issuer of the asset will be able to make the contracted interest and principal payments.

One way to approximate growth in credit (or asset) inflation/deflation, other than to follow broad money aggregates, is simply to look at the growth in bank lending, marked as is, be it to market or make-believe.
One reason why we can simplify in this way is because policy-makers in major economies have made it crystal-clear that, to the extent that financial institutions are at risk of insolvency, they will be bailed out in some fashion, such that the market price of distressed assets will never be properly marked-to-market but, rather, monetized over time. As such, it is not a great leap to assume that the growth (or shrinkage) in bank lending in general is reasonably indicative of whether credit inflation (or deflation) is taking place. Finally, there is commodity or consumer price inflation/deflation, normally measured by price indices.

But such indices are at best approximations and, at worst, are designed in ways which understate real world price inflation through so-called hedonic adjustments, substitution effects or by or underweighting or excluding entirely volatile components such as food and energy.

To be continued in Part Two of Four…

My Loss

by (author unknown)

In one year: (2007)
  • My wife divorced me, and took my life savings.
  • 90% of my company was no longer mine, on a technicality.
  • My apartment was destroyed, so I slept and showered in the warehouse.
  • All my employees, led by my good friend and VP, led a mutiny against me. (I never returned, and never saw them again.)
  • I invested everything I had left in a very conservative fund, which fell 50% immediately, and never came back.
  • I invested everything I had left in a different conservative fund, which also fell 50%, and never came back.
  • The woman I was madly in love with married the guy she would always complain to me about.
Two weeks after that year ended, three companies called asking if I wanted to sell my company. Though I had said no to that question for ten years, this time I said yes.

I had messed up so bad, I had to walk away. I had done everything wrong, and needed to cleanse myself of all those bad decisions. I needed to take some time to learn from my mistakes, and replace my thoughts with new ones. A self-made back-to-schooling.

I look back at that year, and know it won't get much worse. If I can handle that, I can handle anything.

The company sale was announced. The first time someone said “congratulations” I said, “For what? I messed up so bad I lost my baby. That's nothing to congratulate.” (For future congratulations, I just shrug.)

We all underestimate our ability to massively change our life when it's gone off track.

Say “no” where you used to say “yes”. Say “yes” where you used to say “no”. Do the thing that scares you the most, then get up and go.

For those of you considering a massive change, I can tell you from experience:
 
It's awesome here on the other side. smile
http://www.flickr.com/photos/trevin/3457587940/

India Stocks Continue to Slide

by Bespoke Investment Group

Throughout the mid-2000s bull market as well as the 2007-2009 bear, the stock markets in the US and India traded mostly in the same direction (although India outperformed on the upside and underperformed on the downside).  But while US markets have been breaking out to new highs on a daily basis recently, India's stocks have been going in the complete opposite direction.  This rare divergence can be seen in the first chart below that shows the performance of the S&P 500 and India's Sensex since last November.  As shown, the S&P 500 is up 11.36% over this period, while India's Sensex is down 12.8%.  If we look back to the start of the global bull market on March 9th, 2009, India's Sensex is still beating the S&P 500 (114% vs. 95%), but the spread has come in significantly.  So while things here have been all fine and dandy for the past three months, investors in India are no doubt on edge. 


Continue reading this article >>

Survivor Trading System - Trades of 9 February

I trades di Survivor System del 9 Febbraio. I risultati real-time sono a disposizione al seguente link: http://www.box.net/shared/5vajnzc4cp

Trades of Survivor System on 9 February. Real-time results are available at the following link: http://www.box.net/shared/5vajnzc4cp

NG

The Truth About the Financial Crisis, Part II

By Barry Ritholtz

Jennifer S. Taub is a Lecturer and Coordinator of the Business Law Program at the Isenberg School of Management, University of Massachusetts, Amherst. Her research interests include corporate governance, financial regulation, investor protection, mutual fund governance, shareholders rights and sustainable business. Previously, Professor Taub was an Associate General Counsel for Fidelity Investments in Boston and Assistant Vice President for the Fidelity Fixed Income Funds. She graduated cum laude from Harvard Law School and earned her undergraduate degree, cum laude, with distinction in the English major from Yale College. Professor Taub is currently writing a book on the financial crisis for Yale University Press.
The Truth About the Financial Crisis,  Part I was published yesterday.
~~~
Last week, I began musing here, about mining the Financial Crisis Inquiry Report to confront the top ten urban myths about the Financial Crisis.  Expecting to dash off a blog series in a day or so, I found that my eyes were bigger than my brain capacity. Though I had read a good portion of the Report, it took many days longer to digest all 530 or so pages.

I selected most of the urban myths  before I began reading. They emanated from wider study of this topic, experience watching the Dodd-Frank legislation and implementation unfold, and also questions that come my way while teaching a course that includes a segment on the Financial Crisis.

So, here goes.

Myth #1:  The Financial Crisis Inquiry Commission failed to come to any agreement, as the six Democratic appointees published a Report containing conclusions completely at odds with the views of the four Republican appointees.

Reality #1:  No. As Lawrence Baxter commented here, there is accord among nine of the 10 Commissioners on a variety of factors. Indeed, all 10 even agree on a precipitating cause of the crisis. As for the nine Commissioners, the centerpiece of the consensus is that poor risk management at US financial institutions was a chief contributor to the Crisis. As one such example, they all agree that insufficient capital and a reliance on short-term borrowing resulted from risk management failures at financial institutions.
  • The Report states that: ”[I]t was the collapse of the housing bubble—fueled by low interest rates, easy and available credit, scant regulation, and toxic mortgages— that was the spark that ignited a string of events, which led to a full-blown crisis in the fall of 2008.” Additionally, the Report argues that a reliance on “massive, short-term borrowing” by large financial institutions created instability, leading to the Crisis.
  • The Thomas Dissent (signed by three Republican appointees) found that: “high-risk, nontraditional mortgage lending by nonbank lenders flourished in the 2000s and did tremendous damage in an ineffectively regulated environment, contributing to the financial crisis.” In addition, it saw that regarding large financial firms “Just as each lacked sufficient capital cushions, in each case the failing firm’s liquidity cushion ran out within days.”
  • The Wallison Dissent supports the precipitating cause: “Virtually everyone who testfied before the Commission agreed that the financial crisis was initiated by the mortgage meltdown that began when the housing bubble began to deflate in 2007.”
It is not clear why coverage of the Report tends to emphasize division and not cohesion. Harvard senior fellow and former GE Senior VP & General Counsel, Ben W. Heineman, Jr. has been critical of this tendancy:
“[T]hese assessments ignored a fundamental agreement among nine of the 10 members — a source of the report’s continuing importance. The bipartisan commissioners emphatically concluded that one of the primary causes of the meltdown was massive failure of private sector decision-making, especially in major financial institutions.”
In addition, director of investor protection for the Consumer Federation of America, Barbara Roper found much consensus among the majority and the Thomas Dissent. “I doubt the Democratic members of the Commission would find much if anything to disagree with in this account.” The difference, in her view, largely lies in the implications for regulatory reform.

It will be unfortunate if this lack-of-consensus-narrative flourishes.

Myth #2:  The Financial Crisis was an accident, without human causes.
Reality #2: No.  On this, the Report and two dissenting statements align. Without question the Crisis was caused by people. While the Thomas Dissent suggests the outcome could not have been prevented, the Report is clear in its contention that the disaster, at least in the magnitude we experienced was preventable.
  • The Report states that: “The crisis was the result of human action and inaction, not of Mother Nature or computer models gone haywire.”
  • The Thomas Dissent identifies a list of “ten essential causes,” which point to human decisions and actions.
  • The Wallison Dissent also points to human causes, thus rejecting the notion of a natural event. While his narrow focus on housing policy is not credible, for reasons described below, the chief point here is that it is not a storm or accident in his view. He wrote: “To avoid the next financial crisis, we must understand what caused the one from which we are now slowly emerging, and take action to avoid the same mistakes in the future.”
Myth 3:  The financial crisis was brought about because government (under the Community Reinvestment Act, a law enacted in 1977 to prevent banks from refusing to extend loans to creditworthy borrowers in particular neighborhoods) forced banks loan to poor people.

Reality 3:  No. Both the Report and the Thomas Dissent reject this myth, with Wallison the lone proponent of this shaky story.
  • The Report notes that “The CRA requires banks and savings and loans to lend, invest, and provide services to the communities from which they take deposits, consistent with bank safety and soundness.”   Further, it  concludes that: The “CRA was not a significant factor in subprime lending or the crisis. Many subprime lenders were not subject to the CRA. Research indicates only 6% of high-cost loans—a proxy for subprime loans—had any connection to the law. Loans made by CRA-regulated lenders in the neighborhoods in which they were required to lend were half as likely to default as similar loans made in the same neighborhoods by independent mortgage originators not subject to the law.” (emphasis added).
  • The Thomas Dissent also explicitly states that the Community Reinvestment Act was not a significant cause.
  • The Wallison dissent singles out  US government housing policy, including the CRA as the sin qua non of the financial crisis.  As a fellow at the conservative think tank, the American Enterprise Institute, and a long-time dedicated proponent of deregulation, he came into his position as a Commissioner predisposed to this viewpoint and came out still holding it, notwithstanding all the evidence presented to the contrary.
Myth 4: This big government-sponsored companies (GSEs), Fannie Mae and Freddie Mac caused the Financial Crisis because the government pushed them to guarantee mortgage loans to poor homeowners as part of their public housing mission. Variations on this are that public housing mission drove bad underwriting by lenders who had to create risky mortgages to fulfill the demand of the GSEs who needed to buy them, as they were desperate to meet housing goals.

Reality 4:  Not exactly. Both the Report and the primary dissenting statement agree that on their own Fannie and Freddie did not cause the financial crisis. They focus blame largely on the so-called “private label” mortgage market. These are bank and non-bank,  brokers, lenders, and securitizers.  Fannie and Freddie did not originate loans; the “exotic” and dangerous loans were designed by and extended to borrowers through the private label channel. While the Report and the Thomas Dissent support the notion that Fannie and Freddie’s business model was flawed, they also agree that affordable housing goals did not either drive Fannie and Freddie to ruin or cause them create the overwhelming demand for predatory, high-risk, mortgages.
  • The Report states that, “Affordable housing goals imposed by the Department of Housing and Urban Development (HUD) did contribute marginally” to Fannie and Freddie’s collapse.  However, it was the voluntary, profit, not mission-motivated decision by the management teams of the GSEs to load up on Wall-Street and other private bank created securities, coupled with a 75-1 leverage ratio that brought them to the brink. It was clear that the “private-sector, publicly traded, profit-making companies with implicit government backing and a public mission was fundamentally flawed.” The Report shows a shift in behavior, noting that in 2003 and 2004, for example, Fannie “would have met its obligations without buying subprime or Alt-A mortgage-backed securities.”  In addition, the Report explains that “Overall, while the mortgages behind the subprime mortgage–backed securities were often issued to borrowers that could help Fannie and Freddie fulfill their goals, the mortgages behind the Alt-A securities were not. Alt-A mortgages were not generally extended to lower-income borrowers, and the regulations prohibited mortgages to borrowers with unstated income levels—a hallmark of Alt-A loans—from countng toward affordability goals.”
  • The Thomas Dissent concludes: “Fannie Mae and Freddie Mac did not by themselves cause the crisis, but they contributed significantly in a number of ways.” In addition, it observes that US housing policy does not itself explain the housing bubble. The Dissent echoed the majority contending that: “Fannie Mae and Freddie Mac’s failures were the result of policymakers using the power of government to blend public purpose with private gains and then socializing the losses.”
  • The Wallison Dissent blames housing policy and as a subset, the GSEs  for the Financial Crisis. His position is questionable, not in the least because it contradicts numerous written statements he made in the past. As University of Missouri-Kansas City professor of economics and law, Bill Black points out that in the past:
“Wallison praised subprime mortgage loan[s] and complained that Fannie and Freddie purchased too few subprime loans. Wallison (correctly) explained that Fannie and Freddie’s CEOs acted to maximize their wealth – not to fulfill any public purpose involving affordable housing. He also explained that they used accounting abuses to make themselves wealthy. He predicted that low capital costs would increase economic growth. Wallison’s prior views contradict his current claims.”
In addition, in a separate piece, entitled,  ”Wallison is Far Too Kind to Fannie and Freddie,” Bill Black questions the data provided by Edward Pinto, a former risk officer at Fannie Mae, upon which Wallison relies. Black writes:
“Pinto estimated that Fannie and Freddie held ’34% of all the subprime loans and 60% of all Alt-A loans outstanding’ [p. 7].  Pinto seems to have treated subprime loans as non-liar’s loans, but that is clearly incorrect.  I cited Credit Suisse’s finding that by 2005 and 2006, half of all subprime loans were also stated income (liar’s loans).  The presence of such large amounts of Alt-A loans is one of the demonstrations that Pinto, Wallison, and the Republican Commissioners’ ‘Primer’ are flat out wrong to claim that it was affordable housing goals that drove Fannie and Freddie’s CEOs’ decisions to purchase loans they knew would cause the firms to fail.  That claim doesn’t pass any logic test.  One of its unobvious flaws is that no one was making Fannie and Freddie buy liar’s loans.  For the reasons I’ve explained, and Pinto admits, Fannie and Freddie actions with respect to liar’s loans were the opposite of what they would have been if they were trying to demonstrate that the loans were made for affordable housing purposes.”
Myth 5:  Mistakes were made, but there was not widespread fraud and abuse throughout the system.

Reality 5: No. This went beyond mistakes and oversights. There is evidence of widespread fraud and abuse throughout Wall Street and the rest of the private mortgage market. From borrowers, to brokers, to lenders, to bank securitizers, to credit rating agencies, to institutional investors, the Report finds evidence of either fraud, corrupt or abusive behavior.
  • The Report highlights a “a systemic breakdown in accountability and ethics.” It mentions that “One study places the losses resulting from fraud on mortgage loans made between 2005 and 2007 at $112 billion.” It notes that:
“Across the mortgage industry, with the bubble at its peak, standards had declined, documentation was no longer verified, and warnings from internal audit departments and concerned employees were ignored. These conditions created an environment ripe for fraud. William Black, a former banking regulator who analyzed criminal patterns during the savings and loan crisis, told the Commission that by one estimate, in the mid-2000′s, at least 1.5 million loans annually contained ‘some sort of fraud,’  in part because of the large percentage of no-doc loans originated then.”
It reveals that: “[B]etween 2000 and 2007, at least 10,500 people with criminal records entered the field in Florida, for example, including 4,065 who had previously been convicted of such crimes as fraud, bank robbery, racketeering, and extortion.”
In addition, the Report recounts FBI agents warning in 2004 and 2005 of mortgage fraud  as well as housing advocates early on and consistently trying to get the attention of regulators to crack down on predatory lending. As for abuse, the Report provided many examples, including that: “Lenders made loans that they knew borrowers could not afford and that could cause massive losses to investors in mortgage securities. As early as September 2004, Countrywide executives recognized that many of the loans they were originating could result in ‘catastrophic consequences.’ Less than a year later, they noted that certain high-risk loans they were making could result not only in foreclosures but also in ‘financial and reputational catastrophe’ for the firm. But they did not stop.”
  • The Thomas Dissent finds that “Securitizers lowered credit quality standards and Mortgage originators took advantage of this to create junk mortgages.” Also, although the Dissent rejected the notion that fraud was an “essential cause” of the crisis, it agreed that it was a “contributing factor and a deplorable effect of the bubble.” It acknowledged that “mortgage fraud increased substantially,” beginning in the 1990s “during the housing bubble” and that “this fraud did tremendous harm.”
  • The Wallison Report identifies “predatory borrowers” as the folks who “engaged in mortgage fraud.”

The Battle of Bull vs Bear

By Barry Ritholtz

Good Thursday morning.

We woke up in the states to see Futures under pressure, but off their worst levels of the morning. Following a day of 1-2% losses in Asia, European bourses gave up less than 1%, losing 50-75bps.

US stocks are looking to open lower, as the bears make another attempt at some downward pressure. It has thus far been a losing battle. These days, opening indications and actual closing prices are two very different animals.
In the face of massive liquidity of QE2, there remains a firm bid beneath this market. So far, losses have been modest to miniscule, with selling pressure well contained. M&A, share buybacks, anything but disappointing earnings are an excuse to put on the rally caps. Even dips are an excuse to buy. (We are running 53% cash on specifc name selling, not overall market calls).

The bears are bloody but unbowed — they know a correction is imminent. But the bulls have heard this line for nigh on two years, and yet still the market still powers higher. The Dow, S&P and Nasdaq are all at multi-year highs. There is a different between being early — a matter of days or weeks — and wrong. So far, the bears have been wrong.

Eventually, the grizzlies must be fed. They have their champions, including various Fed Hawks, who are terrified of an inflationary spiral. Lacker, Plosser and Fisher may be mortal enemies of price instability, but they are friends of Yogi and Boo-Boo and Baloo, well known amongst ursines for their opposition to easy money. And easy money is a bull’s best friend.

Even the most ardent bull knows that this too, will pass. The bears will have their day, before their next bout of hibernation.
The 64 trillion question: When?

click for updated futes

Continue reading this article >>

Reversing Position On eMini Nasdaq - Super Commodity Trading System

Ieri sera il nostro Super Commodity system ha ribaltato la posizione Long su eMini Nasdaq andando Short e chiudendo con un buon utile il precedente trade. I risultati real-time sono a disposizione al seguente link: http://www.box.net/shared/5vajnzc4cp

Last night our Super Commodity system has reversed its Long position on eMini Nasdaq going short and closing with a good gain the previous Long trade. Real-time results are available at the following link: http://www.box.net/shared/5vajnzc4cp

NQ
Material in this post does not constitute investment advice or a recommendation and do not constitute solicitation to public savings. Operate with any financial instrument is safe, even higher if working on derivatives. Be sure to operate only with capital that you can lose. Past performance of the methods described on this blog do not constitute any guarantee for future earnings. The reader should be held responsible for the risks of their investments and for making use of the information contained in the pages of this blog. Trading Weeks should not be considered in any way responsible for any financial losses suffered by the user of the information contained on this blog.

Go Short On Platinum - Super Commodity trading System

Set-up di vendita ieri sera sul Platinum da parte del nostro Super Commodity system, accompagnato da alcune divergenze negative sulla chart giornaliera. Lo Stop loss è già stato spostato a breakeven in virtù del raggiungimento del relativo obiettivo da parte dei prezzi. I risultati real-time sono a disposizione al seguente link: http://www.box.net/shared/5vajnzc4cp

Sell Short set-up on Platinum last night by our Super Commodity system, accompanied by some negative divergences on the daily chart. The Stop Loss has already been moved to breakeven as a result of reaching its target by price. Real-time results are available at the following link: http://www.box.net/shared/5vajnzc4cp

PL
Material in this post does not constitute investment advice or a recommendation and do not constitute solicitation to public savings. Operate with any financial instrument is safe, even higher if working on derivatives. Be sure to operate only with capital that you can lose. Past performance of the methods described on this blog do not constitute any guarantee for future earnings. The reader should be held responsible for the risks of their investments and for making use of the information contained in the pages of this blog. Trading Weeks should not be considered in any way responsible for any financial losses suffered by the user of the information contained on this blog.

IS THE HIGH YIELD BOND MARKET LOOKING FROTHY?

by Cullen Roche

After an incredible 85% rally since the 2009 lows there are some signs that the high yield bond market is beginning to look expensive. In a search for yield investors have driven high-yield bond risk premiums just below their historical average of 5.1%.   Risk premiums can be tricky in an environment such as the current one.  Risk premiums are historically high at 70% of yield so there is an argument to be made that the Fed’s extraordinary actions are distorting valuations.  Average yields, meanwhile are sinking to all-time lows.  High yield bonds, at 7.1% based upon the Merrill Lynch U.S. High Yield Master II Constrained Index, are just shy of the record low yield of 6.81% recorded in December 2004.  In addition issuance is ballooning.  According to Fitch high yield issuance surged 67% in 2010 to $252.4B vs 2009 levels of  $151.5B.

In his recent outlook for the bond market Jeff Gundlach of DoubleLine stated that high yield corporates were never more expensive:
“Junk bonds have never been richer….At best, they’ll hold their own against competing investments.”
Martin Fridson, Global Credit Strategist, BNP Paribas Investment Partners disagrees:
“Whatever the future may hold, pundits who are bearish on high yield cannot justify their stance on grounds of valuation….Given where the fundamentals are, the spread is actually a touch more than it should be.”
David Rosenberg of Gluskin Sheff, in yesterday’s market commentary, offers a more balanced perspective:
“The overall not-too-hot/not-too-cold macro backdrop is obviously very constructive for the high yield market. These companies have radically restructured their balance sheets over the past two years to the point that the volume of debt to refinance by 2014 has plunged 44% to $482 billion. Default risks have accordingly declined.

At the same time, the sector trades at a premium and the yield at 7% is flirting with all-time lows. Total returns in the past two years have come to total 87% versus 53% for the S&P 500. Last year’s darlings were the BRICS and now we see these markets faltering and escalating outflows from emerging market equity funds. Every dog has its day.

What is a bit scary is that inflows into high-yield funds are surging — almost $5 billion so far this year, which is over one-third of the 2010 intake. This is a bit worrisome from a contrarian standpoint, but I am at least heartened by the fact that portfolio managers in this sector (looking at the ICI data) have cash ratios now that are in excess of 6%. This is a much better cushion than they had going into the credit meltdown (when they were just at 4%, and at the worst of the crisis in late 2008, they were over 10% cash).
Spreads have tightened dramatically and are at levels we saw at the 2007 peak of the risk cycle. That said, they did get well below 300bps in each of the two prior bull runs so there may in fact be more juice left based on recent history but not a whole lot.”
As of the end of 2010 the junk bond default rate was 3.1%.  That’s down from 13% in 2009.  Moody’s expects that to fall to 1.9% this year, however, pressures will mount as the corporate debt burden increases in the coming years:
“A flood of US speculative-grade, nonfinancial corporate debt—almost $690 billion—is scheduled to mature during 2011-2015. Despite heavy new issuance in 2010, the maturities have fallen by only $100 billion from the roughly $800 billion noted in last year’s study. This indicates the recent robust new issuance in 2010 merely “kicked-the-can” of the pending refunding needs to a later date.
Near-term refunding needs are relatively modest, with just $26 billion maturing in 2011 and $67 billion in 2012—a welcome relief as the economy continues its slow recovery. But the big refunding need in 2013-2015 of approximately $600 billion poses a greater concern given the still somewhat weak economic recovery, a high unemployment rate that is expected to be about 9% at year-end 2011,11 and the prospect of higher interest rates in the future.”
All in all the risk trade in high yield appears to be on in 2011 barring an unforeseen economic downturn.  It’s likely that moderate to high valuations combined with low default risk and reasonable funding needs will continue to feed the debt binge in high yield corporate bonds.  This should make Ben Bernanke quite pleased as his goal of re-leveraging an overleveraged private sector comes to fruition.  Whether or not this trend is sustainable is a totally different question and likely doesn’t have a happy ending.

Continue reading this article >>

Ethanol producers may be making trouble for themselves

by Mike Verdin

America's ethanol producers should enjoy the good times while they last.
They are in clover at the moment, processing corn into record quantities of the stuff.
And potentially at healthy margins too. Ethanol plants appear, cannily, to have bought their corn supplies in advance last year, before prices really took off, the US Department of Agriculture said on Wednesday, explaining the gap between growers' receipts from the grain and the "substantially higher" cash market bids.
However, there are good reasons to think that times for the industry might be about to get tougher. 
Role reversal
Some are financial. One reason America's corn ethanol producers are enjoying a boom is that, unusually, they are more competitive than Brazilian rivals which make the biofuel from sugar.
If corn prices look steep, at their highest in more than two years, remember raw sugar is near a 30-year high.
However, that dynamic, which has allowed America's corn ethanol producers to usurp Brazilian peers on export markets, may reverse.
Indeed, futures markets indicate pricing power returning to sugar ethanol mills, which can buy their raw material for March next year 22% cheaper than they can get it for delivery next month.
That's more than twice the discount that corn ethanol plants can count on, to judge by Chicago prices.
Tax factor 
But other hurdles will require more than canny hedging.
The industry's favourable finances are supported by tax perks - a blender's tax credit, besides the market protection offered by levies slapped on ethanol imports.
However, the clock is ticking for these benefits. They are due to run out at the end of this year, when reinstating them may not be so easy as it was last time they lapsed, in December.
Even in the few weeks since, food prices have risen up the world agenda, questioning the morality of tying up so much productive farmland for an industrial purpose.
Latest official estimates forecast 40% of the US corn crop going to make ethanol, up from 35% last year, and equivalent to the fruits of 35m acres of land.
That's a large target for the food lobby to aim at should concerns about supplies become an even bigger deal. 
Achilles heel 
Ethanol producers can at least count on a silver lining from the turn towards civil upset in Middle East and North Africa.
The threat the unrest poses to some major oil exporters exposes America's vulnerability on energy - its reliance on imports for roughly half the 19m barrels or so of oil it uses a day.
The food concerns of importing states may appear a luxury if domestic fuel security is at stake.
Ironically, the discontent sparked by food price gains could provide a shield for an industry which helped cause them.
 

Cisco: An Also Ran

by Beskope Investment Group

It has been a bad nine months for Cisco (CSCO).  After trading near $28 per share in May of 2010, the company has managed to disappoint Wall Street's expectations for three straight quarters.  After today's report, it looks like investors have had enough.  In after hours trading, the stock is now trading under $20 per share to as low as $19.77.

Back in June 2009 when General Motors (GM) filed for bankruptcy, the keepers of the Dow Jones Industrial Average replaced GM with CSCO.  At the time, many said the move was done to show the Technology sector's increased importance in the US economy.  CSCO itself echoed this sentiment when it issued a statement saying that, "We believe our inclusion in the Dow demonstrates not only Cisco's role as a broad technology indicator, but how remarkably the Internet and networking have transformed the way businesses and consumers connect, communicate and collaborate."  The only problem with this view is that CSCO is no longer representative of the Technology sector.

The chart below compares the performance of CSCO to the overall S&P 500 Technology sector since CSCO was added to the DJIA in June 2009.  As shown, while the Technology sector has rallied more than 50% over that time, CSCO, after including tonight's after hours decline, is down 0.5%.

To add insult to injury, since CSCO was added to the DJIA, it is one of only six of the 76 stocks in the Technology sector that are down.  CSCO is often referred to by the press as a bellwether for the Technology sector, but based on the last several months, the stock has become increasingly irrelevant.  Perhaps one bright side to CSCO's after hours decline is that even though the stock is down 10%, because of its low share price, its downside impact on the Dow 30 translates to only 15 points.


Continue reading this article >>

Risk Management: Watch the Hang Seng

By macroman

You know our schtick by now that we view the Hang Seng Index as the indicator species for global risk appetite and a signal as to whether the Mainland’s economy will land hard or soft.  Since returning from the Lunar holiday the Hang Seng is down 3.1 percent and has broken its 50-day moving average.   We  sense a growing concern about China’s economic situation as they continue to tighten monetary policy.

We’ve lightened up a little and monitoring the Hang Seng closely and a break of 22,600 would lead us to reduce risk across the board and get short certain commodities.  A break in China would almost instantly turn all the market chatter about inflation into deflation, in our opinion.   We are not certain where the Hang Seng and China are headed but we do know our action plan if certain support is broken.

By the way, have you been watching the bloodbath in Brazil and India, and today’s flop in the Korean ETF?  Also watch carefully the response of the British Pound if the BoE raises rates tomorrow.    (click here if chart is not observable)

Continue reading this article >>

CORPORATE PROFITS ARE SOARING THANKS TO RECORD UNEMPLOYMENT

By Mark Provost

In a January 2009 ABC interview with George Stephanopoulos, then-President-elect Barack Obama said fixing the economy required shared sacrifice: “Everybody’s going to have to give. Everybody’s going to have to have some skin in the game.”

For the past two years, American workers submitted to the President’s appeal—taking steep pay cuts despite hectic productivity growth. By contrast, corporate executives have extracted record profits by sabotaging the recovery on every front—eliminating employees, repressing wages, withholding investment, and shirking federal taxes. The global recession increased unemployment in every country, but the American experience is unparalleled. According to a July OECD report, the U.S. accounted for half of all job losses among the 31 richest countries from 2007 to mid-2010. The rise of U.S.

unemployment greatly exceeded the fall in economic output. Aside from Canada, from mid 2008 to mid 2010 U.S. GDP actually declined less than any other rich country. Washington’s embrace of labor-market flexibility ensured companies encountered little resistance when they launched their brutal recovery plans. Leading into the recession, the United States had the weakest worker protections against individual and collective dismissals in the world, according to a 2008 OECD study. Blackrock’s Robert Doll explains, “When the markets faltered in 2008 and revenue growth stalled, U.S. companies moved decisively to cut costs—unlike their European and Japanese counterparts.” The United States now has the highest unemployment rate among the ten major developed countries.

The private sector has not only been the chief source of massive dislocation in the labor market, but it is also a beneficiary. Over the past two years, productivity has soared while unit labor costs have plummeted. By imposing layoffs and wage concessions, U.S. companies are supplying their own demand for a tractable labor market. Private sector union membership is the lowest on record. Deutsche Bank Chief Economist Joseph LaVorgna notes that profits-per-employee are the highest on record, adding, “I think what investors are missing—and even the Federal Reserve—is the phenomenal health of the corporate sector.” Due to falling tax revenues, state and local government layoffs are accelerating. By contrast, U.S. companies increased their headcount in November at the fastest pace in three years, marking the tenth consecutive month of private sector job creation. The headline numbers conceal a dismal reality; after a lost decade of employment growth, the private sector cannot keep pace with new entrants into the workforce. The few new jobs are unlikely to satisfy Americans who lost careers. In November, temporary labor represented an astonishing 80% of private sector job growth. Companies are transforming temporary labor into a permanent feature of the American workforce. UPI reports, “This year, 26.2 percent of new private sector jobs are temporary, compared to 10.9 percent in the recovery after the 1990s recession and 7.1 percent in previous recoveries.” The remainder of 2010 private sector job growth has consisted mainly of low-wage, scant-benefit service sector jobs, especially bars and restaurants, which added 143,000 jobs, growing at four times the rate of the rest of the economy.

Aside from job fairs, large corporations have been conspicuously absent from the tepid jobs recovery. But they are leading the profit recovery. Part of the reason is the expansion of overseas sales, but the profit recovery is primarily coming off the backs of American workers. After decades of globalization, U.S. multinationals still employ two-thirds of their global workforce from the United States (21.1 million out of 31.2 million). Corporate executives are hammering American workers precisely because they are so dependent on them.

An annual study by USA Today found that private sector paychecks as a share of Americans’ total income fell to 41.9% earlier this year, a record low. Conservative analysts seized on the report as proof of President Obama’s agenda to redistribute wealth from, in their words, those “pulling the cart” to those “simply riding in it”. Their accusation withstands the evidence—only it’s corporate executives and wealthy investors enjoying the free ride. Corporate executives have found a simple formula: the less they contribute to the economy, the more they keep for themselves and shareholders. The Fed’s Flow of Funds report reveals corporate profits represented a near-record 11.2% of national income in the second quarter.

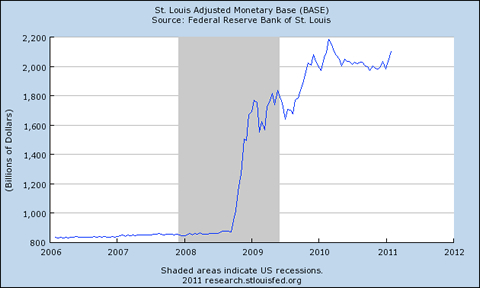
Non-financial companies have amassed nearly $2 trillion in cash, representing 11% of total assets, a sixty-year high. Companies have not deployed the cash on hiring, as weak demand and excess capacity plague most industries. Companies have found better use for the cash, as Robert Doll explains: “high cash levels are already generating dividend increases, share buybacks, capital investments and M&A activity—all extremely shareholder friendly.”

Companies invested $262 billion in equipment and software investment in the third quarter. That compares with nearly $80 billion in share buybacks. The paradox of substantial liquid assets accompanying a shortfall in investment validates Keynes’ idea that slumps are caused by excess savings. Three decades of lopsided expansions have hampered demand by clotting the circulation of national income in corporate balance sheets. An article in the July issue of The Economist observes “business investment is as low as it has ever been as a share of GDP.”

The decades-long shift in the tax burden from corporations to working Americans has accelerated under President Obama. For the past two years, executives have reported record profits to their shareholders partially because they are paying a pittance in federal taxes. Corporate taxes as a percentage of GDP in 2009 and 2010 are the lowest on record, just over 1%.

Corporate executives complain that the United States has the highest corporate tax rate in the world, but there’s a considerable difference between the statutory 35% rate and what companies actually pay (the “effective” rate). Here again, large corporations lead the charge in tax arbitrage. U.S. tax law allows multinationals to indefinitely defer their tax obligations on foreign-earned profits until they ‘repatriate’ (send back) the profits to the United States. U.S. corporations have increased their overseas stash by 70% in four years, to now over $1 trillion—largely by dodging U.S taxes through a practice known as “transfer pricing”. Transfer pricing allows companies to allocate costs in countries with high tax rates and book profits in low-tax jurisdictions and tax havens—regardless of the origin of sale. U.S. companies are using transfer pricing to avoid U.S. tax obligations to the tune of $60 billion dollars annually, according to a study by Kimberly A. Clausing, an economics professor at Reed College in Portland, Ore.

The corporate cash glut has become a point of recurrent contention between the Obama administration and corporate executives. In mid December, a group of 20 corporate executives met with the Obama administration and pleaded for a tax holiday on the $1 trillion stashed overseas, claiming the money would spur jobs and investment. In 2004, corporate executives convinced President Bush and Congress to include a similar amnesty provision in the American Jobs Creation Act; 842 companies participated in the program, repatriating $312 billion back to the United States. at 5.25% rather than 35%. In 2009, the Congressional Research Service concluded that most of the money went to stock buybacks and dividends—in direct violation of the Act.
The Obama administration and corporate executives saved American capitalism. The U.S. economy may never recover.
Continue reading this article >>

Follow Us