Saturday, March 29, 2014

Cava Gran Reserva Brut Celler Batlle 2001 Gramona

by le mille bolle

Mentre siamo ancora in attesa, come ho già scritto, che il Consejo Regulador del Cava renda noto (siamo già a marzo ed evidentemente i calcoli devono essere complessi o i risultati non esaltanti…) l’andamento delle expediciones “caviste” nel 2013, vale la pena rifarsi la bocca stappando e mettendo alla prova uno dei prodotti di punta di una delle migliori case produttrici di metodo classico attive in Spagna.

Sto parlando di Gramona, che come ho già avuto modo di scrivere nacque dall’unione di due dinastie familiari legate al mondo del vino: Batlle e Gramona. I Gramona diedero nome all’azienda mentre “Nel 1881, Pau Batlle, approfittando della crescente domanda dovuta alla fillossera in Francia, inizia la vinificazione in strutture costruite nel “Celler Batlle” nel retro della casa di famiglia a San Sadurní d’Anoia”.

Le prime bollicine vedono la luce intorno al 1921, commercializzate come “champagne” e affinate nelle vecchie cantine di Sant Sadurní d’Anoia. Oggi che l’azienda ha compiuto 133 anni ed è alla sua quinta generazione familiare la gamma dei vini prodotti da Gramona è piuttosto ampia e comprende sia Cava espressione di uve autoctone sia con il contributo di Chardonnay e Pinot nero, sia vini fermi rossi rosati e bianchi da varietà aromatiche. Va ricordato che Gramona con “III Lustros” diede vita nel 1971 ad uno dei primi ”Brut Nature“ del mercato del Cava.

Il Cava di cui intendo occuparmi oggi è uno dei vini più ambiziosi della serie, un Brut Gran Reserva millesimato 2001 che riposa sui lieviti oltre otto anni e che porta il nome storico di Celler Batlle che rimanda alle origini dell’avventura aziendale. Un Cava espressione di un terroir particolare, denominato La Plana, sintesi di 70% Xarel·lo e 30% di Macabeo, la prima delle due uve eccellente per esaltare la nota aromatica, mentre il Macabeo, con la sua maturazione tardiva assicura buona struttura.

gramona-celler-batlle-gran-reserva-brut

Anche se non veniva riportata in retroetichetta la data di sboccatura doveva essere di qualche anno precedente. Personalmente, come ho spesso scritto, sono sempre timoroso di fronte ai metodo classico che hanno trascorso un lunghissimo periodo di affinamento sui lieviti, perché sovente quel che guadagni in potenza e struttura sacrifichi in armonia e leggerezza. Contemporaneamente sono molto ammirato dal coraggio delle aziende di tentare la strada di un invecchiamento prolungato e spero sempre che si sia trattata di una scelta ben ponderata e ragionata.

Nel caso di questo Celler Batlle 2001 lo è stata ampiamente perché il vino mostra non solo un savoir faire tecnico e un perfetto controllo di tutti gli aspetti, ma una vitalità che sarebbe stato difficile attendersi dato il suo millesimo.

Bello il colore, un paglierino oro molto intenso con una vena leggermente ramata, sottile e persistente, ancora ricco di energia, il perlage. Il naso mostra inizialmente un’impressione di maturità avanzata e un predominio di aromi terziari, frutta secca tostata, noce moscata, spezie, ma poi emerge lentamente e prende ampiezza e densità la frutta esotica, mango e papaia e la maturità, grazie ad una nitida vena salata e quasi salmastra, ad un tono minerale, si combina bene con la freschezza.

La bocca apre subito ricca, molto secca, dinamica, con buona articolazione e una notevole croccantezza delle bolle, per poi allargarsi, giustamente matura, su un frutto dotato ancora di una naturale dolcezza e soavità, con buona persistenza lunga, nerbo e piacevolezza. Vino dall’indubbio carattere gastronomico, da un proporre come aperitivo o su antipasti, ma su preparazioni elaborate di pesce.

See the original article >>

Bollicine italiane stravincono all’export: crescono volumi e valore

by le mille bolle

Il punto di vista, molto particolare, di Giampietro Comolli 

Ho molta stima e simpatia per Giampietro Comolli, che vanta un curriculum professionale, alla testa di importanti Consorzi e poi di aziende, di assoluto rispetto. Negli ultimi anni ha lavorato molto per l’Altamarca Trevigiana e ha creato l’Osservatorio economico vini spumanti effervescenti.
Periodicamente Comolli diffonde dei comunicati che definirei vagamente “trionfalistici” esaltando le performance, che indubbiamente esistono, di quelle che lui chiama indifferentemente “Bollicine e spumanti Italiani”. In questi comunicati Comolli cita abbondantemente numeri e statistiche che dice essere frutto di innumerevoli contatti ed elaborazioni dotate di una credibilità e base scientifica.
Io ho qualche perplessità, pur con tutta la simpatia umana per Comolli, in merito, ad esempio quando parla di “3,7 milioni di bottiglie importate (Champagne e Cava)” in Italia nel 2013 (quelle di Champagne erano oltre 6 milioni nel 2012 e non possono certo essersi ridotti del 50%), e penso che la sua visuale sia “vagamente” filo prosecchista.
E non capisco cosa Comolli intenda dire, quando parla, senza spiegare, di un “mercato italiano bloccato, infedele, discontinuo, ma non ancora maturo”.
Ho però deciso di pubblicare, come documento, e come contributo al dibattito, l’ultimo elaborato di Comolli, proponendolo all’attenzione dei lettori di questo blog. Buona lettura

“Bollicine e spumanti Italiani sulla cresta dell’onda. La produzione annua è stata di 434 milioni di bottiglie con un valore all’origine di 735 €/mil. Crescita dei volumi del 9,1%. Per il solo export ancora meglio: volumi a +11,5% e valore +16% rispetto al 2012.

Consumi totali stimati a 419.960.000 bottiglie di cui 397.250.000397.250.000 di bottiglie di metodo italiano e 22.710.000 di metodo tradizionale, ancora per il 92% consumato tutto in Italia e troppo legato alla “regionalità”. 277,6 milioni di bottiglie sono state stappate all’estero (in 78 Paesi) e 142,4 milioni sono state consumate in Italia. Giro d’affari al consumo totale stimato di 3,071 €/miliardi.
Al consumo, il valore di una bottiglia è in crescita anche del 18-20% in alcuni Paesi, a significare la crescita dell’appeal del binomio bollicine-Italia nel mondo, con una identità nazionale concentrata sulla tipologia di vino aromatico. Il mondo Prosecco (Valdobbiadene, Conegliano, Cartizze, Asolo, Prosecco Doc, Glera) incide per due bottiglie ogni tre. 307 milioni di bottiglie contro 304, per la prima volta la Piramide Prosecco supera il Mondo Champagne.

Il mercato italiano si presenta bloccato, infedele, discontinuo, ma non ancora maturo. Eccessivo il distacco fra produttore e consumatore: la complessa difficoltà della domanda impone più elasticità di metodi d’offerta. Il consumo nazionale, per il terzo anno consecutivo regredisce, -8,1 milioni di bottiglie (il 6,2%) in totale, compreso 3,7 milioni di bottiglie importate (Champagne e Cava).
Le bollicine nazionali hanno contribuito (per prezzo, qualità e immagine) a sostituire i vini importati. Rispetto al 2012, il dato generale del consumo in Italia è a –1,8%; mentre il valore al consumo registra un +0,5%. Un calo volumi 2013 più contenuto rispetto al divario fra 2011 e 2012 che aveva fatto registrare un –2,7%, ma non si può parlare di inversione di tendenza.

In 3 anni l’Horeca ha fatto registrare un calo di consumi di bollicine del 11%, soprattutto per le etichette con prezzi intermedi. Tengono i marchi più noti e di alto valore. In GD si riscontra una certa stabilità dei volumi, un leggero calo delle High Tags, crescono leggermente i volumi dei primi prezzi, il fatturato tiene o cresce leggermente a seconda delle insegne. <Il mercato nazionale ha bisogno di una nuova programmazione di marketing e strategia lungo periodo: più promozione commerciale e contatto diretto con il consumatore finale per crescita dei consumi. Il supporto conoscitivo e formativo fanno parte del mix di vendita: queste azioni devono essere più localizzate, soggettive e private, con inviti a toccare con mano, in fase di contrazione, discontinuità.> dice Giampietro Comolli

See the original article >>

Things to Watch on the Economic Calendar

By Kathleen Madigan

  • 1 This Payrolls Report Should Be Frost Free

    Share on Twitter

    Unlike the last three monthly employment reports, the March data , scheduled for release Friday, should be fairly clean of weather effects. Economists think job growth was better in March than in February. The consensus forecasts calls for a payroll gain just above 200,000 for March, better than the 175,000 jobs added in February.

    A reading even above the solid forecast number would confirm the growing sentiment that economic activity in the first quarter was slowed by the weather and stable fundamentals will support strong growth in the spring and beyond.

  • 2 Has the Participation Rate Stabilized?

    Share on Twitter

    One welcome development in recent months is the seeming stabilization of the labor force participation rate. After free-falling from 2009 through mid-2013, the share of working-age adults who are in the labor force—either working or looking for work—has held between 62.8% and 63.0% since October. Another 63% (or higher) reading in March would further suggest a stabilization.

    The retirement of aging baby boomers is cutting the rate, but perceptions of better job prospects may be drawing younger discouraged workers back into the labor pool. Indeed the labor-force participation rate among workers aged 25-34 years has rebounded more than one percentage point since October. That’s before the end of the extended jobless benefits program, so something more than the loss of public assistance is increasing the participation rate for younger adults.

  • 3 Vehicle Sales Should Rev Up

    Share on Twitter

    A major casualty of the harsh winter weather was vehicle sales. Sales in January and February averaged an annual rate of just 15.25 million, from an average of 15.5 million for all of 2013. On Tuesday, auto makers will report March sales. Forecasters think car-buying bounced back to about 15.8 million, helped by dealer incentives to get buyers into showrooms. Those deals should lift sales, but at the expense of profit margins.

  • 4 Taking Business’s Temperature in March

    Share on Twitter

    Winter drags also showed up in recent business surveys done by the Institute for Supply Management. The March reports covering manufacturers (out Tuesday) and non-manufacturers (Thursday) should be frost-free. Forecasters expect both surveys to look better than the February reports did.

    Since these reports come out ahead of Friday’s payrolls report, take time to look how the employment indexes performed. Economists think unusual movements in the ISM jobs indexes—whether up or down–can foreshadow a surprise in the payrolls number.

    Another area of interest is how manufacturers are managing their inventories. Although the inventory index is volatile,the latest numbers show manufacturers have been drawing down stockpiles in early 2014, confirming economists’ expectations that the inventory sector will subtract from first-quarter GDP growth.


    5 Oil Deficit Continues to Slide

    Share on Twitter

    The U.S. economy has been performing better than most of the rest of the world, but the growth differential has not triggered a sharp worsening in the U.S. trade deficit. One reason is the steep narrowing in the oil deficit. Thanks to greater domestic natural gas production and better energy efficiency, the U.S. is importing less oil than it did just a few years ago.

    After adjusting for prices, the petroleum trade deficit widened in January, but the moving average remains below $10 billion (in 2009 dollars). A look at the February oil trade will be available within the trade deficit report out Thursday.

See the original article >>

There’s No Substitute for Good Judgment

By Robert Seawright

So says Commander Lyle Tiberius Rourke in the Disney film Atlantis: The Lost Empire, referring to the famous expression attributed to the great American showman: “There’s a sucker born every minute.” Even though Barnum didn’t say it, we get it. In talking about the scientific method in his famous 1974 Cal Techcommencement address, Nobel laureate Richard Feynmanemphasized the point: “The first principle is that you must not fool yourself – and you are the easiest person to fool.”

Accordingly, we’re right to be skeptical about our decision-making abilities in general because our beliefs, judgments and choices are so frequently wrong. That is to say that they are mathematically in error, logically flawed, inconsistent with objective reality, or some combination thereof, largely on account of our behavioral and cognitive biases. Our intuition is simply not to be trusted.

Part of the problem is (as it so often is) explained by Nobel laureate Daniel Kahneman: “A remarkable aspect of your mental life is that you are rarely stumped. … you often have [supposed] answers to questions that you do not completely understand, relying on evidence that you can neither explain nor defend.” We thus jump to conclusions quickly – far too quickly – and without a proper basis.

We aren’t stupid, of course (or at least entirely stupid). Yet even the smartest, most sophisticated and most perceptive among us make such mistakes and make them repeatedly and predictably. That predictability, together with our innate intelligence, offers at least some hope that we can do something meaningful to counteract the problems.

One appropriate response to our difficulties in this area is to create a carefully designed and data-driven investment process with fewer imbedded decisions. When decision-making is risky business, it makes sense to limit the number of decisions that need to be made. For example, it makes sense to use a variety of screens for sorting prospective investments and to make sure that such investments meet certain criteria before we put our money to work.

It’s even tempting to try to create a fully “automated” system. However, the idea that we can (or should) weed-out human judgment entirely is silly. Choices about how to create one’s investment process must be made and somebody (or, better yet, a group of somebodies*) will have to make them. Moreover, a process built to be devoid of human judgment runs grave risks of its own.

Take the case of Adrionna Harris, a sixth grader in Virginia Beach, Virginia, for example.

Last week, Adrionna saw a classmate cutting himself with a razor. She took the razor away, immediately threw it out, and set out to convince him to stop hurting himself. By all accounts, she did what we’d all want our own kids to do. The next day she told school administrators what had happened. The school wouldn’t have known about the incident (and the boy’s situation) if Adrionna hadn’t come forward.

For her troubles, Adrionna didn’t get a parade. She didn’t get congratulated or even get offered thanks. Instead, she received a 10-day suspension with a recommendation for expulsion from school on account of the district’s “zero tolerance” policy. She had handled a dangerous weapon after all, even if just to protect a boy from harming himself. Only after a local television station got involved and started asking pesky questions did common sense prevail – school officials then (finally) agreed to talk with Adrionna’s parents and, in light of the bad publicity, lifted the suspension. When and where discretion is removed entirely, absurd – even dangerous – results can occur despite the best of intentions.

As noted, because our intuition isn’t trustworthy, we need to be sure that our investment process is data-driven at every point. We need to be able to check our work regularly. Generally speaking, it seems to me that the key is to use a carefully developed, consistent process to limit the number of decisions to be made and to avoid making “gut-level” decisions not based upon any evidence but also flexible enough to adjust when and as necessary.

No good process is static. Markets are adaptive and a good investment process needs to be adaptive. Approaches work for a while, sometimes even a long while, and then don’t. Markets change. People change. Trends change. Stuff happens. As Nobel laureate Robert Shiller recently told Institutional Investor magazine, big mistakes come from being “too formulaic and bureaucratic. People who belong to a group that makes decisions have a tendency to self-censor and not express ideas that don’t conform to the perceived professional standard. They’re too professional. They are not creative and imaginative in their approach.” The challenge then is to find a good balance so as to avoid having to make too many decisions while remaining flexible.

Several years ago, the Intelligence Advanced Research Projects Activity, a think tank for the intelligence community, launched the Good Judgment Project, headed by Philip Tetlock, University of Pennsylvania professor and author of the landmark book, Expert Political Judgment, which systematically describes the consistent errors of alleged experts and their lack of accountability for their forecasting failures. The idea is to use forecasting competitions to test the factors that lead analysts to make good decisions and to use what is learned to try to improve decision-making at every level.

The Project uses modern social science methods ranging from harnessing the wisdom of crowds to prediction markets to putting together teams of forecasters. The GJP research team attributes its success to a blend of getting the right people (i.e., the best individual forecasters), offering basic tutorials on inferential traps to avoid and best practices to embrace, concentrating the most talented forecasters onto the same teams, and constantly fine-tuning the aggregation algorithms it uses to combine individual forecasts into a collective prediction on each forecasting question.

Significantly, Tetlock has discovered that experts and so-called experts can be divided roughly into two overlapping yet statistically distinguishable groups. One group fails to make better forecasts than random chance and its decisions are much worse than extrapolation algorithms built with the aggregate forecasts of various groups. However, some of these experts can even beat the extrapolation algorithms sometimes, although not by a wide margin. Interestingly, what distinguishes the good forecasters from the poor ones is a style of thinking.

Poor forecasters tend to see things though one analytical (often ideological) lens. That’s why pundits, who typically see the world through a specific ideological prism, have suchlousy track records. Good forecasters use a wide assortment of analytical tools, seek out information from diverse sources (using “outside” sources is especially important), are comfortable with complexity and uncertainty, and are decidedly less sure of themselves. Sadly, it turns out that experts with the most inflated views of their own forecasting successes tended to attract the most media attention.

“Given the impressive power of this simple technique, we should expect people to go out of their way to use it. But they don’t,” says Harvard psychologist Daniel Gilbert. In a phrase created by Kahneman and his late research partner, Amos Tversky, they often suffer from “theory-induced blindness.” Per Michael Mauboussin, the reason is clear: most of us think of ourselves as different, and better, than those around us. Moreover, we are prone to see our situation as unique and special, or at least different. But in almost all cases, it isn’t.

“My counsel is greater modesty,” Tetlock says. “People should expect less from experts and experts should promise less.” The better forecasters are foxes – who know lots of little things – rather than hedgehogs – who “know” one big thing and who consistently see the world through that lens. For example, reading the first paragraph of a Frank Rich op-ed makes it possible to predict nearly everything the column will contain without having to read another word of it. In systems thinking terms, foxes have many models of the world while hedgehogs have one overarching model of the world. Foxes are skeptical about all grand theories, diffident in their forecasts, and always ready to adjust their ideas based upon what actually happens.

The very best performers are great teams* of people who create careful, data-driven statistical models based upon excellent analysis of the best evidence available in order to establish a rules-driven investment process. Yet, even at this point, the models are not of the be-all/end-all variety. Judgment still matters because all models are approximations at best and only work until they (inevitably) don’t anymore — think Long-Term Capital Management, for example.

Everyone who lives and works in the markets learns to deal with the inevitable – failure, uncertainty, and surprise. Some are better than others. But we can all still improve our decision-making skills and do with proper training.

According to Tetlock, the best way to a become a better forecaster and decision-maker is to get in the habit of making quantitative probability estimates that can be objectively scored for accuracy over long stretches of time. Explicit quantification enables explicit accuracy feedback, which enables learning. We need to be able to check our work quickly and comprehensively. If we can find a basis to justify our poor decisions – if we can find an “out” – we will. Those “outs” need to be prevented before they can be latched onto.

Going through the effort consistently and comprehensively to check our work requires extraordinary organizational patience, but the stakes are high enough to merit such a long-term investment. In the investment world, long-term performance measures provide this sort of accuracy feedback, much to the annoyance of money managers. But it’s hardly enough. Astonishingly, Berkeley’s Terry Odean examined 10,000 individual brokerage accounts to see if stocks bought outperformed stocks sold and found that the reverse was true. So there is obviously a lot of room for improvement. As in every field, those who make poor decisions propose all sorts of justifications and offer all kinds of excuses. They insist that they were right but early, right but gob-smacked by the highly improbable or unforeseeable, almost right, mostly right or wrong for the right reasons. As always, such nonsense should be interpreted unequivocally as just-plain-wrong.

A quick summary of some of the (often overlapping) ways we can improve our judgment follows.

  • Make sure every decision-maker has positive and negative skin in the game.
  • Focus more on what goes wrong and why than upon what works (what Harvard Medical School’s Atul Gawande calls “the power of negative thinking”).
  • Make sure your investment process is data-driven at every point.
  • Keep the investment process as decentralized as possible.
  • Invoke a proliferation of small-scale experimentation; whenever possible, test the way forward, gingerly, one cautious step at a time.
  • Move and read outside your own circles and interests.
  • Focus on process more than results.
  • Collaborate – especially with people who have very different ideas (what Kahneman calls “adversarial collaboration”).
  • Build in robust accountability mechanisms for yourself and your overall process.
  • Slow down and go through every aspect of the decision again (and again).
  • Establish a talented and empowered team charged with systematically showing you where and how you are wrong. In essence, we all need an empowered devil’s advocate.
  • Before making a big decision, affect a “pre-mortum” in order to legitimize doubt and empower the doubters. Gather a group of people knowledgeable about the decision and provide a brief assignment: “Imagine that we are a year into the future. We implemented the plan as it now exists. The outcome has been a disaster. Take 10 minutes to write a brief history of that disaster.” Discuss.

Per Kahneman, organizations are more likely to succeed at overcoming bias than individuals. That’s partly on account of resources, and partly because self-criticism is so difficult. As described above, perhaps the best check on bad decision-making we have is when someone (or, when possible, an empowered team) we respect sets out to show us where and how we are wrong. Within an organization that means making sure that everyone can be challenged without fear of reprisal and that everyone (and especially anyone in charge) is accountable.

But that doesn’t happen very often. Kahneman routinely asks groups how committed they are to better decision-making and if they are willing to spend even one percent of their budgets on doing so. Sadly, he hasn’t had any takers yet. Smart companies and individuals will take him up on that challenge. Those that are smarter will do even more because there’s no substitute for good judgment.

See the original article >>

Eurozone's credit contraction continues

By: SoberLook.com

Private loan balances in the euro area continue to decline. Last month's drop of 2.2% from the previous year was worse than had been expected by economists.

Source: Investing.com

The area's banks are undergoing a sharp deleveraging exercise with balance sheets shrinking due to both loan write-downs and extraordinarily weak lending. Maturing loans are not being fully replaced with new credit. Pressure from the ECB's 2014 stress testing of banks (similar to what the Fed just completed) is also discouraging credit expansion.

Reuters: - Lending to households and firms in the euro zone shrank further in February and money supply growth remained subdued, adding to the European Central Bank's list of concerns ahead of its policy meeting next week.
...
The ECB's health check of the euro zone's largest banks' balance sheets before it takes over banking supervision in November is exacerbating the situation, with lenders reluctant to take on more risk and trying to slim their loan books instead.
Bank balance sheets declined by around 20 percentage points of gross domestic product last year, partly in anticipation of the health check, ECB President Mario Draghi said on Tuesday.
And more is to come this year.
UniCredit, for example, posted a record 14 billion-euro loss this month due to huge writedowns on bad loans and past acquisitions as it moved to clean up its balance sheet.
The ECB welcomed the move and encouraged other banks to not to wait with any corrective measures until the review's results are released in October.
Some have pointed to a "glimmer of hope" in the household lending balances which showed a small uptick in credit expansion.

Eurozone household loan growth (YoY); Source: ECB

The increase however came from a slightly slower decline in consumer credit (credit cards, auto loans, etc.), which continues to fall (year-on-year change is firmly in the red). This contraction to a large extent is driven by weak demand.

Eurozone consumer credit growth (YoY); Source: ECB (apologies for the different time scale)

Furthermore, growth in mortgage loans remains anemic, making this household lending uptick less of a reason to celebrate.

Eurozone mortgage loan growth (YoY); Source: ECB

Moreover, the area's corporate loan balances are continuing to see sharp declines - down 3.1% from the same time last year. Weak demand remains the culprit here as well.

Eurozone corporate loan growth (YoY); Source: ECB

In February Mario Draghi blamed credit weakness on banks' "window dressing" exercise of trimming balance sheets before year-end financial reporting.

Draghi: - "One would not rule out a certain behavior by the banks that would like to present their best data by the end of 2013, which means that this is going to affect credit flows, which means that we may have different figures in the coming weeks ..."
It would be interesting to see what Mr. Draghi will come up with this time to explain the ongoing contraction in euro area's private credit.

See the original article >>

Are Emerging Markets Too Toxic To Touch?

by James Gruber

A Wal-Mart detour
Ruminations on risk
How risky are emerging markets?
Being selective

Asia Confidential has received a lot of feedback on our view of the relative attractiveness of Chinese and South Korean stocks in both Asian and international contexts. Some of the feedback has suggested that the risks with these markets are too great to make them investible at this juncture. This post is an attempt to address the issue through a deep dive into the concept of risk and how it relates to emerging markets.

Risk is a topic little understood by the average investor and largely misunderstood by the financial industry. As a general rule, investors who want above-average investment returns usually have to be prepared to take on above-average risks. If investors have a low tolerance for risk then they shouldn’t expect anything but low returns.

Put another way, war, catastrophe and the like imply high perceived risk and are normally associated with low stock market valuations, which infer the potential for higher long-term returns. Conversely, when things are going swimmingly, stocks are normally priced as such and high prices usually infer lower future returns.

It’s explains why many quantitative studies have shown that high quality stocks under-perform low quality ones. It’s why strong GDP growth has little correlation to future stock market performance. It’s also why emerging markets are in the dumps, albeit having perked up over the past few weeks. Emerging markets are being deemed higher risk and are therefore sporting lower valuations to take this risk into account.

Of course, the ultimate trick is to find markets and/or stocks where there’s a mismatch between risk and price. Where too much risk is reflected in current prices. That’s the secret sauce to investing and I hope to provide some insight on it in the current emerging market environment.

A Wal-Mart detour
Let’s first take a bit of a detour via an article from a blog called Philosophical Economics. It’s excellent and well worth your time.

It looks at Wal-Mart on October 3, 1974. Why this date? Well, it’s then that the S&P 500 bottomed after a bloodcurdling bear market during 1973-1974. At the bottom, the S&P trailing price-to-earnings ratio (PER) was 6.9x, the 10-year treasury bond yielded 7.9% and the Fed Funds Rate was 10%.

Wal-Mart at the time was a smallish, southern retailer with stock price of $12 and a trailing PER of 12.9x. In other words, it was priced at about a 90% premium to the market. On a relative basis, it looked expensive.

It didn’t turn out to be so expensive. From the 1973 bottom, the S&P 500 has since returned 12% per year. Not too shabby. However, Wal-Mart has returned 23% per year over same period. A US$10,000 investment in Wal-Mart shares then would now be worth roughly US$45 million. If you’d managed to make such an investment, and I’m not sure anyone outside of the Walton family has, then my guess is that you probably wouldn’t feel a pressing need to actually attend a Wal-Mart store any time soon!

How could Wal-Mart have obliterated the returns of the S&P 500 when it was priced at almost double the valuation in 1974? Obviously, the company turned out to be an outstanding retailer. Yet the stock also turned out to be cheap relative to its growth prospects.

What would the appropriate price have been for Wal-Mart to achieve returns in line with the index since that time? It turns out a stock price of $600, or about 50x higher, with a PER closer to 600x!

The article’s concludes thus:

“Now, my goal here isn’t to question the merits of a systematic value-based investment strategy. Markets put a high risk-premium on businesses that have run up on hard times. The risk-premium statistically overcompensates for the inevitable failures that occur in the lot, and therefore a disciplined strategy of harvesting the risk-premium will tend to outperform over time.

But if we’re going to get into the nitty-gritty of active stock picking, if we’re going to delve into the details of the individual names themselves, we shouldn’t blindly conclude that low multiples offer buying opportunities, or that high multiples imply froth or danger. The truth is sometimes the other way around.”

There are lots of good points here. But I’d like to elaborate on the risks involved with the Wal-Mart trade at that time. The 1974 market bottom was reached after a near 50% decline from the peak of 20 months earlier. The country was deep in recession. Two months before the market bottom, the US President Richard Nixon resigned in disgrace over the Watergate scandal. About a year earlier, there was the famous oil crisis. And don’t forgot that the US was then still involved in the Vietnam War.

Therefore when the market bottomed, it was a tremendously turbulent period. To invest in the market or Wal-Mart at the time, even at low valuations, would have required extraordinary discipline. Very, very few had the capacity to stomach the risk (a then little known investor by the name of Warren Buffett did have such capacity. Though he didn’t purchase Wal-Mart, he made other now famous trades, including that of the Washington Post).

Which brings me to a further point on risks associated with the Wal-Mart trade. To get comfortable investing in Wal-Mart itself in 1974, you’d have had to know a lot about the business, management and retail sector – including the potential for big box retailers. You’d have had to make a careful assessment of all of these and their associated risks to be willing to pay a 90% premium for the stock versus the market. And, of course, you’d have needed the patience to hold the shares for the next 40 years to reap the rewards.

This discussion has only included the known risks though. We hasn’t even explored the unknown risks, harking back to the “known unknowns” jargon of Donald Rumsfeld. 

Ruminations on risk
In the investment world, risk can be simply defined as the possible loss of capital. And there are really two forms of risk: short-term and long-term. Short-term risk is the short-term volatility in prices. This risk is usually measured by standard deviation. In layman’s terms, by buying Wal-Mart in 1974, you’d have had short-term risk of the stock dropping by 50%. If that happened though and you didn’t sell, the loss would have only been on paper and temporary.

Long-term risk is the potential for the permanent loss of capital. Permanent meaning an inflation-adjusted loss over a +20 year period. One which you normally can’t recover from.

This kind of loss is usually precipitated by certain events (unlike the losses associated with short-term risk). For instance, war and confiscation of assets can represent permanent loss. It happened to Germany post-World War One and Two. It happened to revolutionary Russia and China.

You can also experience deflation a la Japan. This doesn’t happen often but when it does, look out. From peak to trough, Japanese stocks went down about 80% and real estate land values by closer to 90%.

A more common event in recent history has been inflation. In Germany during the 1920s, hyperinflation resulted in cash and bonds being worthless. That’s one of many instances of serious inflation/hyperinflation throughout history and represents real, permanent capital loss.

Typically you won’t be able to forecast long-term risk. Therefore it represents unknown risk.

This is important when people cite examples of stock market successes such as Wal-Mart. The US hasn’t experienced most of the events associated with long-term risk. It’s been involved in wars as the victor not the vanquished. It’s had serious inflation, but not hyperinflation. It had regular deflation during the 19th century, but not since. And it’s only had few instances of confiscation.

In short, stockbrokers love to promote the US and its companies and show how investors could have made millions by buying and holding stocks in the long-term. They don’t talk about the paltry returns of still successful countries such as Germany, Japan and so forth over the past century.

How risky are emerging markets?
Now circling back to emerging markets, these markets appear cheap compared to their own history and compared to other regions. Currently emerging markets trade at 1.4x price-to-book (P/B). That’s near the depths of the Lehman panic in 2008.

EM P-B

Valuations of emerging markets compare favourably to those of the developed world. For example, the S&P 500 trades at 2.7x P/B, or close to a 50% premium.

Within Asia, some markets are trading much cheaper than the emerging markets average valuation. South Korea trades at close to book value. The China A-share market is at 1.4x P/B, or in line with the average. However, China H-shares (those listed in Hong Kong) trade at 1.1x.

An alternative method of looking at valuation is via PERs. Both China and South Korea have forward PERs of 8x. This effectively means both offer more than 12% pre-tax earnings yields (100 divided by 8). That compares very favourably to long-term bond yields in both countries.

The question is: why are these emerging markets seemingly cheap? And the answer goes back to our introduction: they’re perceived as high-risk investments.

As for the risks, there are many. For emerging markets in general, QE tapering is front and centre. Funds which flowed from the developed world to emerging markets are now reversing (the latter had offered higher yields versus the former and that is now turning around).

In a more volatile environment, the Ukraine fall-out has heightened emerging market risks from an investment point of view. This doesn’t make a whole lot of sense, but it’s just creating further uncertainty in an uncertain world.

The final key factor is the prospect of a China credit bust. Such an event would hurt commodities, of which China has been the central demand driver. And emerging markets have high exposure to these commodities.

Turning to the risks associated with individual emerging markets, let’s take a look at South Korea. Short-term risks here include:

  • A developed world slowdown hurting its large export market.
  • Further yen depreciation impacting its exports too.
  • A messy rebalancing away from dependency on manufacturing towards consumption.
  • High household debt and related credit issues.

The long-term risks would probably centre on one particular risk: North Korea and the possibility of war, perhaps nuclear war. This is a known risk that could also possibly be classified as a short-term risk.

How about the granddaddy of emerging markets, China? This market’s short-term risks have been well documented by this newsletter and include:

  • The unraveling of a mammoth credit upturn.
  • Structurally lower growth as the economy shifts from being investment-led to consumer-led.
  • A developed world slowdown hurting its large export market.
  • Prospect for further yuan depreciation in a bid to prop up its exporters.

The list could go on, but these are the main short-term risks. As for the long-term risks, the primary one would have to be the disintegration of the Communist Party, via revolution or otherwise. There are many other long-term risks which we won’t go into here.

Being selective
Asia Confidential has advocated China and South Korea as offering the prospect of above-average long-term returns. That doesn’t mean every investor ought to go out and buy them though. If you have low risk tolerance, then these possible opportunities may not be for you.

Put another way, these markets may seem cheap but could get a lot cheaper, as a result of any of the aforementioned short-term risks. The ability to hang in for the long haul depends on your risk tolerance.

If you think that you have the capacity to take on such risk, then there’s also the opportunity to do some homework of your own on these emerging markets.

For example, when it comes to China, investing in a market ETF is the simplest way to do it. But it may not be the best way. Something to consider is that banks have large weightings in the China market. They account for about a third of the H-share index.

If you buy an H-share ETF, you’re buying large exposure to the Chinese banks. These banks are at the heart of the unwinding of the credit bubble. The largest banks are state-owned and were central players in loans to state-owned businesses during China’s notorious 2009 stimulus. Much of the credit flowed through to the massive infrastructure projects which have since attracted so much attention (ghost cities and so on).

The China banks have extraordinarily cheap valuations, on the surface. Most are priced below book value and with forward PERs of less than 5x. The reason for the low prices is that the market thinks they are risky investments. More specifically, that they have dodgy loans on their books, many of which are likely to turn bad.

It’s very difficult to make an investment case for these banks. Yes, they’re pricing in non-performing loan ratios (NPLs) of 7-8%, which is at the high end suffered by banks in recent financial crises. However, it’s impossible for outsiders to determine what the ultimate figure will be. In banking parlance, it’s impossible to know the quality of the loan book.

If you can’t determine the quality of the loan book and the future earnings power of these banks, it’s also difficult to get a sense of the proper pricing for the stocks. Without a sense of this, you’re investing on faith and little else.

In the view of Asia Confidential, the opportunities in China are likely selective and lay outside of the banks. I’ve mentioned cheaper internet names, insurance and consumer discretionary stocks as areas exposed to the “new”, consumption-driven China, which may be worth exploring. It’s in these areas where there may be a mismatch between risk and price.

Tying all of this back to the notion of long-term risks mentioned earlier, it’s impossible to foresee these risks in China or anywhere else. One course of protection is to have a diversified investment portfolio. In other words, whether buying equities or more specifically, emerging market equities, it’s best not to bet the ranch on them.

AC Speed Read

- Some feedback to recent posts suggests emerging markets are too risky to be investible at this point.

- Risk comes in two forms: short-term and long-term. Short-term risk involves short-term price volatility while long-term risk is the potential for permanent loss of capital.

- Emerging markets hold both risks, but the question is whether these risks are accurately reflected in prices.

- We think in select markets such as China and South Korea that there’s a possible mismatch between risks and prices, providing some potential opportunities.

That’s all for this week. Thank you for taking the time to read this post.

See the original article >>

SPY Trends and Influencers March 29, 2014

by Greg Harmon

Last week’s review of the macro market indicators suggested, heading into the last full week of the First Quarter that equity markets again look tired. Outside of them directly though it looked for Gold ($GLD) to consolidate or continue higher while Crude Oil ($USO) had a similar feel for a reversal in its case. The US Dollar Index ($UUP) was showing strength in the short run while US Treasuries ($TLT) were consolidating in the short term uptrend. The Shanghai Composite ($SSEC) looked good for more upside price action and Emerging Markets ($EEM) looked as if they may want to continue the consolidation. Volatility ($VIX) looked to remain subdued keeping the bias higher for the equity index ETF’s $SPY, $IWM and $QQQ. Their charts were not so sure of that though with all 3 consolidating under the highs on the shorter timeframe but the IWM and SPY looking healthy, and a little better than the QQQ on the longer timeframe.

The week played out with Gold moving lower through 1300 while Crude Oil did reverse and move higher. The US Dollar pulled back Monday but then drifted higher to end unchanged while Treasuries made there first test of major resistance. The Shanghai Composite probed higher but gave it all back to end the week near unchanged while Emerging Markets raced higher ending the week with a topping candle. Volatility had a fairly stable weak moving in a tight range near unchanged. The Equity Index ETF’s showed continued consolidation on the SPY while the IWM and QQQ moved lower. What does this mean for the coming week? Lets look at some charts.

As always you can see details of individual charts and more on my StockTwits feed and on chartly.)

SPY Daily, $SPY
spy d
SPY Weekly, $SPY
spy w

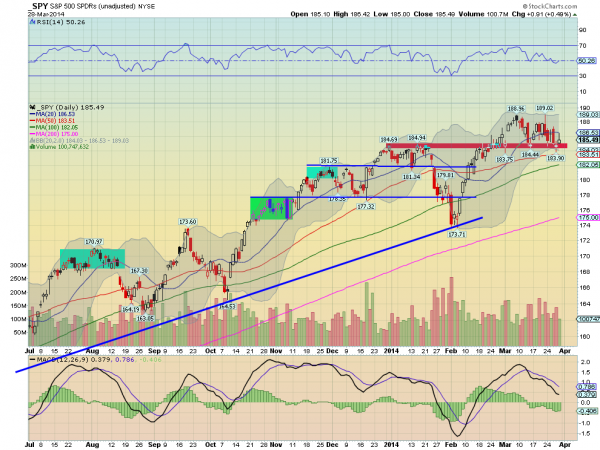
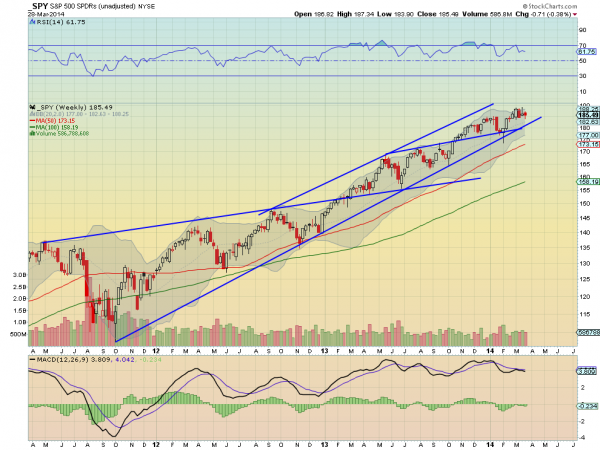
The SPY continued the slow drift lower in a consolidation range over a support zone (in red). The price action came very close to the 50 day SMA on Thursday before a move higher Friday that stalled after touching the 20 day SMA. The RSI on the daily timeframe is trending lower but near the mid line and holding in a bullish range while the MACD is continuing lower. These support more downside. The weekly chart shows a tightening consolidation at the highs. No real damage in price. The RSI is over 60 and moving sideways with a MACD also moving sideways. Signs of consolidation for now that could turn either way. There is resistance at 186.75 and 189 with a move over that resuming the uptrend. Support lower is found at 184 and 181.80 followed by 177.75 and a move under 173.71 changing the trend lower. Consolidation or Pullback in the Uptrend.

As the calendar prepares to turn into April the equity markets are looking weak. Elsewhere look for Gold to continue lower while Crude Oil continues to move higher. The US Dollar Index looks better to the upside as do US Treasuries, but both with big resistance areas nearby. The Shanghai Composite looks back to its downward price action and but Emerging Markets are biased to the upside with some caution after a big week with short term topping signs. Volatility looks to remain subdued keeping the bias higher for the equity index ETF’s SPY, IWM and QQQ, despite the moves lower. Their charts are not so optimistic though with the IWM and QQQ in pullbacks that look to continue while the SPY tries to hold on in consolidation. Use this information as you prepare for the coming week and trad’em well.

See the original article >>

Waterfall pattern starting in white hot Bio Tech sector?

by Chris Kimble

CLICK ON CHART TO ENLARGE

One month ago the Power or the Pattern shared that white hot Bio Tech (IBB) looked to be facing stiff resistance at a very important Fibonacci extension level. (See chart here). At the time members shorted this ETF and since then IBB is off 14% in the past 30 days.

In my humble opinion, what looks to be taking place this past week is more important than 30 days ago, as IBB on a weekly basis is breaking below its very steep rising channel. This is the first solid close below this channel that saw it rally 100% in a little over a years time.

Could a waterfall pattern be in the making? If this white hot sector cools off, could it impact the broad markets? IMHO it can and is!

END OF THE ROAD FOR THE RUSSELL 2000?

CLICK ON CHART TO ENLARGE

Is this the end of the road for the Russell 2000?  Power of the Pattern doesn't feel like its the end of the road, yet a cross roads of resistance and a Fibonacci extension level could become heavy resistance at (1) above.

Bottom line...Two high flyers, Bio Tech and the Russell 2000 find themselves at important price points in my opinion.

See the original article >>

weekend update

by Elliott Wave Theory
REVIEW
The market started the week opening higher, but then took on the character that had started on expiration Friday: sell growth stocks after the opening. During the week the market had three gap up openings, no gap downs, and still ended the week lower. For the week the SPX/DOW were mixed, the NDX/NAZ lost 2.5%, and the DJ World index rose 0.8%. Economic reports for the week remained positive. On the uptick: Q4 GDP, FHFA housing prices, consumer confidence/sentiment, durable goods orders, personal income/spending, PCE prices, the WLEI and weekly jobless claims improved. On the downtick: Case-Shiller, new/pending home sales and the M1-multiplier. Next week we get a look at the monthly Payrolls, ISM and Auto sales. Best to your week!
LONG TERM: bull market
We continue to count this five year bull market as Cycle wave [1] of the next Super cycle bull market. Cycle wave bull markets unfold in five Primary waves. Primary waves I and II completed in 2011. Primary wave III has been underway since then. Primary wave I divided into five Major waves with a subdividing Major wave 1. Primary III is also naturally rising in five Major waves, but both Major waves 1 and 3 subdivided. Currently it appears Major wave 5 is also subdividing into five Intermediate waves. Not at all unusual for a third wave.
SPXweekly
Major waves 1 and 2 of Primary III completed by mid-2012, and Major waves 3 and 4 by mid-2013. Major wave 5 has been underway since then. When Major wave 5 does complete, some time this year, Primary III will end. This should be followed by a substantial correction for Primary IV, probably coinciding with the 4 year Presidential cycle low scheduled for this year. This cycle typically bottoms in July or October. Then when Primary IV ends the market will rise again to new highs in a Primary wave V.
MEDIUM TERM: uptrend weakening
We have reached an interesting juncture in this bull market. As reported in recent weeks the cyclical/growth sectors have been out of sync for a number of months. This week it appeared they are trying to realign again. This would be good news for those who follow OEW analysis. When the four major indices are in sync, it is so much easier to track even the smallest of waves.
Currently we see three potential scenarios, in order of preference, short term. One: the NDX/NAZ confirm a downtrend next week, bottom within a few days, then all four major indices are aligned for the next wave up. Two: the NDX/NAZ is currently bottoming, with no downtrend confirmation, and all four major indices remain out of sync for the next wave up. Three: the situation in Ukraine/Russia worsens resulting in a panic selloff in equity markets, and all four major indices realign at the early February lows. Since we are basically of the “glass is half full mindset”, we will detail the implications of scenario number one.
NAZdaily
As noted in recent weeks the DOW and the NDX/NAZ have been the drivers of this bull market. The SPX is the traders preferred index, but it is basically a hybrid of growth and cyclical issues. The NDX/NAZ as represented by the NAZ chart above, still needs two more uptrends before it can complete Primary wave III. The high at NAZ 4372 in early March appears to be the end of its Intermediate wave iii. An Intermediate wave iv downtrend appears to be underway, and could bottom as early as next week. Should this occur, then the NDX/NAZ need to complete two more uptrends (Major 3 and Major 5) to complete Primary III.
SPXdaily
Should the SPX/DOW not confirm a downtrend while this is occurring. Then they too would only need to complete two more uptrends (Int. iii and Int. v) to complete Primary III. Then all four major indices should remained aligned for the duration of this bull market. Quite an interesting time. If we rule out the sort of ‘black swan’ Ukraine/Russia scenario, we have two scenarios suggesting the market is quite close to an important low. Major wave 3 in the NDX/NAZ, and Int. wave iii in the SPX/DOW could be quite powerful. Our attention will continue to be on the NDX/NAZ next week. Medium term support is at the 1841 and 1828 pivots, with resistance at the 1869 and 1901 pivots.
SHORT TERM
Short term support is at the 1841 and 1828 pivots, with resistance at the 1869 pivot and SPX 1884. Short term momentum ended this volatile week at neutral. The short term OEW charts are negative with the reversal level at SPX 1860.
During the week we spent most of the time elaborating on what was going on in this choppy market rather than detailing the waves. We noted the four consecutive days of higher openings, then growth stock selling within/after the first hour of trading. This started last Friday and continued until this Friday. From the early March highs the NDX/NAZ have dropped about 5.5%, while the SPX/DOW have declined only about 2.5%. While this was all transpiring we were doing some research and reviewing the charts.
SPXhourly
Friday we updated the SPX hourly/daily charts to display a five wave Minor wave 1 high at SPX 1884. What followed appears to be an ongoing Minor wave 2 flat: 1840-1884-1842 so far. When we first started counting this uptrend we counted the pullback (1788-1777) as a wave. Then we got off it because it did not meet some parameters, and the market was quite choppy. After further review it appears the first impression was the correct one. This count suggests a flat is unfolding between the Minute iv low (1834) and the Minute v high (1884). Exactly what one would expect if a market is basing before moving higher, after a very strong and quick beginning.
FOREIGN MARKETS
The Asian markets were mostly higher on the week for a net gain of 1.8%.
The European markets were mostly higher for a net gain of 1.7%.
The Commodity equity group were also mostly higher for a net gain of 3.0%.
The DJ World index is still uptrending and gained 0.8%
COMMODITIES
Bonds remain in a downtrend but gained 0.2% on the week.
Crude is still in an uptrend and gained 2.1% on the week.
Gold has yet to confirm a downtrend and lost 3.0% on the week.
The USD is trying to uptrend and gained 0.1% on the week.
NEXT WEEK
Monday: Chicago PMI at 9:45 and a speech from FED chair Yellen at 9:55. Tuesday: ISM manufacturing, Construction spending and Auto sales. Wednesday: the ADP index and Factory orders. Thursday: weekly Jobless claims, the Trade deficit, and ISM services. Friday: the Payrolls report. Best to your weekend and week!
See the original article >>

Fed Needs To “Stress Test” Itself As Balance Sheet Balloons To $4.3 Trillion

by GoldCore

Friday’s AM fix was USD 1,295.75, EUR 944.15 and GBP 779.68 per ounce.             

Thursday’s AM fix was USD 1,295.00, EUR 942.09 and GBP 779.14 per ounce.


Gold in U.S. Dollars, 1 Month - (Thomson Reuters)

Snapping its four-day losing streak, gold prices recovered very marginally yesterday. Traders said there was a revival of buying by retailers at these lower levels and this contributed to a marginal recovery in gold prices.

Gold climbed $6.19 to $1298.69 at about 4AM EST before it fell back to a new 6-week low of $1285.81 in the next six hours of trade. It then bounced higher into the close and ended with a marginal gain of 0.02%. Silver slipped to as low as $19.649 before it also bounced back higher and ended with a gain of 0.2%.
Gold in Singapore, which normally sets price in the important Indian gold market, rose 0.4% to $1,296.80 an ounce and silver by 0.8% to $19.86 an ounce. Among other precious metals, palladium gained nearly 1% today to $765/oz but is lower for the week.

Gold remains near six week lows and is on track for a second straight weekly decline. Gold has dropped about $100 an ounce from a six-month high in the last nine trading sessions despite increasing concerns about the U.S. and global economy.
There remain concerns that the manipulation of gold prices being investigated by the FSA and Bafin may be ongoing and a factor in recent price weakness.

Gold’s technical position is now negative and the close below $1,300/oz yesterday opens up the possibility of further falls to $1,270/oz and $1,200/oz. The sharp drop in prices in the last few days should bring physical buyers back into the market and support gold.

Gold in U.S. Dollars,  5 Year - (Thomson Reuters)


Demand for gold in Japan surged 500% in the last month as Japanese buyers bought ahead of a sales tax increase and due to concerns about Abenomics and the ongoing debasement of the yen.

A man who has been a trader for 33 years and works at a foreign-owned brokerage told the Financial Times that the tax increase represented a “good opportunity” to buy more gold as he was worried about holding too many yen-denominated assets.

“I plan to hold it for a long time until there is a good time to sell, when the yen collapses or something,” he said.

The surge in Japanese demand is small in tonnage terms in a global context and small vis a vis huge demand from India & especially China and from central banks but shows increasing concerns regarding currency debasement.

Fed Stress Tests “Rattle Banks Around The World”

Yesterday, the Federal Reserve’s stress tests led to jitters in financial markets and in the words of the Financial Times “rattled banks around the world.” Citigroup’s share price was hammered and fell 5.4%

The aftershock of the stress tests was felt beyond U.S. shores for the first time. The U.S. subsidiaries of Royal Bank of Scotland, Santander and HSBC all failed on “qualitative” grounds, which includes failing to project losses rigorously when contemplating a severe recession or market meltdown.

The Fed said that the banks management practices or capital cushions are not robust enough to withstand a severe economic downturn. Not surprisingly, the banks themselves accused the  stress tests as being “opaque”.

Twenty five other banks took part in the Fed's annual "stress test" and received a green light for their planned dividend payouts and share repurchases. Bank of America and Goldman Sachs initially fell short of minimum capital requirements. However, they met the standards after reducing their planned dividend payments and share buybacks over the past week.

The banks now have 90 days to address the weaknesses and risks identified by the Fed and resubmit their dividend and share buyback plans.

The Fed's decision was part of the annual checkup it requires of banks with more than $50 billion in assets. Banks must now undergo tests to ensure they can endure shocks like those that upended the banking system and led to the massive government bailouts in the 2008 financial crisis.

In what the Fed sees as the extreme scenario, the test assumed a rise in the 6.7% unemployment rate to 11.2%, a 50% drop in stock prices and a decline in home prices to 2001 levels. All of which appear a strong possibility given debt burdened state of the tapped out U.S. consumer and the poor fundamentals of the U.S. economy.
Indeed real levels of unemployment in the U.S. are likely well over 11% already.

St Louis Federal Reserve
It is important to note that if the Federal Reserve’s assets were marked to market, it itself is insolvent.
The Fed's balance sheet has ballooned to $4.3 trillion from $800 million in the past five years as the central bank has electronically created trillions of dollars in order to buy their own government bonds and mortgage-related bonds in a radical and indeed reckless attempt to kick the can down the road and prevent a systemic event or a recession or depression.
The Federal Reserve is likely to suffer significant losses on its Treasury holdings once interest rates rise from historic lows. Indeed, the researchers at the San Francisco Fed have recently called for "stress tests" on the Fed itself and it’s assets and income, an echo of the central bank's annual exercise for the nation's largest banks.

See the original article >>

Policy Uncertainty To Blame for India's Economic Slowdown

By Rahul Anand and Volodymyr Tulin

India, after witnessing spectacular growth averaging above 9 percent over the past decade, has started to slow in the last few years. The slump in infrastructure and corporate investment has been the single biggest contributor to India’s recent growth slowdown.

India’s investment growth, averaging above 12 percent during the last decade fell to less than one percent in the last two years. What is especially worrisome is that more and more investment projects are getting delayed and shelved, while the pipeline of new projects has become exceptionally thin.

This slowdown has sparked an intense public debate about its causes. Some commentators, including representatives of the business community, argue that high interest rates, which raise financing costs, are the major culprit, dampening investment.  Others maintain that interest rates are only partly responsible for the current weak levels of investment, suggesting that a host of other factors, particularly on the supply side, are at play.

Our new Working Paper seeks to shed some light on the reasons behind this investment malaise. Using a novel index of economic policy uncertainty—an innovation in our analysis—we find that heightened uncertainty regarding the future course of broader economic policies and deteriorating business confidence have played a significant role in the recent investment slowdown.


Disentangling the investment slowdown


How much of the investment slowdown can be attributed to higher interest rates? We analyzed the connection between interest rates and the investment slowdown, based on a simple investment model that takes into account demand and business confidence indicators, as well as the financing cost of investments.

We find some striking findings. Real interest rates account for only one quarter of the explained investment slowdown.  Further, macroeconomic and financial variables (interest rates, external demand, relative prices, global financial market volatility etc) alone cannot fully explain the weakness in investment.

So what are the other determinants of the recent investment slowdown?  Several causes of weaker investment activity seem to be of supply-side nature. The following key factors stand out as possible contributors to the recent investment slowdown:

  • Rising policy uncertainty. In particular, high profile tax policy decisions announced in the 2012/13 Budget reduced foreign investors’ interest in India, while the increasing difficulty of obtaining land use and environmental permits raised regulatory uncertainty for infrastructure and other large-scale projects.
  • Delayed project approvals and implementation. As a reaction to high-profile governance scandals, project approvals, clearances, and implementation slowed sharply.
  • Supply bottlenecks are particularly pronounced  in miningand power, with attendant consequences for the broader economy, especially manufacturing.

Quantifying the impact of policy uncertainty


How do we pin down the impact of economic policy and regulatory uncertainty?  We rely on a novel measure of policy-related economic uncertainty for India developed and constructed by several Stanford University economists. The application of this index provides an important advancement in quantifying policy uncertainty.

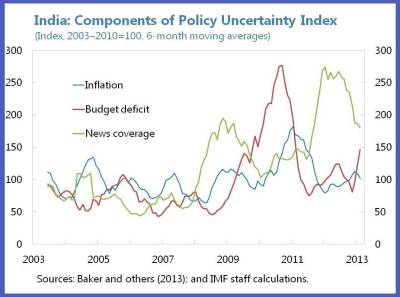
The overall Economic Policy Uncertainty (EPU) measure combines two types of underlying information (see chart). The first component quantifies newspaper coverage of economic policy uncertainty, including regulatory, fiscal and monetary policies uncertainties. The second component combines measures of disagreement among major economic forecasters regarding key macroeconomic variables, namely near-term inflation and the federal government budget deficit.

After controlling for economic policy uncertainty, our results show that that financing costs do not appear to be a critical factor in explaining the decline in new investments. Heightened uncertainty and deteriorating business confidence have played a key role in the decline in new investments and postponement and cancellation of others.  In other words, these results confirm what is perhaps intuitively obvious—clarity in terms of future policy is critical for a pick up in investment and to ensuring that projects underway are completed.

Further, the current level of economic policy uncertainty exceeds its post-Lehman highs, suggesting that uncertainty is primarily driven by India’s domestic policy challenges, and not by global uncertainty factors such as the withdrawal of unconventional monetary policy in advanced market economies.

Policies to revive investment


What does this mean for policy?  The IMF’s 2014 annual review on India suggests that continued progress on key structural reforms, including power sector reforms, easing labor restrictions, and enhancing health and education outcomes would help improve the business climate and domestic investment.

The Indian authorities have taken a number of steps over the last year to address structural issues, including passage of some long-awaited legislative measures. Most importantly, the Government of India has set up a Cabinet Committee on Investment (CCI) as well as a Project Monitoring Group (PMG), to fast track stalled large-scale investment projects.

The fact that the CCI has cleared investment projects worth about 5 percent of GDP since its inception in January 2013 is an encouraging development. As cleared projects are implemented and remaining uncertainties and bottlenecks are removed, investment activity is likely to pick up, paving the way for revitalizing robust and inclusive economic growth in India.

India’s Investment Slowdown

See the original article >>

Time To Worry: The Changing Role of Central Banks

By Moorad Choudhry

The world’s oldest central banks are almost – but not quite – as old as modern commerce. Of course it depends how one defines “modern”. The ancient city of Babylon was a great trading center, as were Phoenecia and Carthage after that. The Bank of England (BoE) was set up in 1694, not to act as supervisor / regulator of the country’s banks but to help the sovereign raise funds to conduct war against the French. The Swedish central bank (the Riksbank) was the world’s first, set up in 1668. But back in those days it too didn’t do what it does now; in the 17th century, it acted more like a private bank - in other words, a credit institution.
changing role central bankingHow times change! Today, central banks are also, almost invariably, regulatory institutions that supervise the country’s banks. A more modern vogue is that of conducting monetary policy. These are two quite separate things; in the UK in 1997 the government split the functions, only for the government in 2010 to merge them back again.
Today we can add another function, which is also quite separate: that of underwriting the private sector. Of course, that role isn’t on any mission statement or set of objectives. It comes under things like quantitative easing (QE), and keeping interest rates at zero for years and years, and buying multi-billion dollars of credit risky assets and placing them on the public sector balance sheet. One can almost call it a sub-set of monetary policy.
Except it isn’t. How many of us have asked recently what the capital base of the “Big 3” central banks are? I mean, if a conventional bank buys a risk-bearing asset, it has to have an adequate capital base of liabilities against those assets. The Fed has a huge QE program; the European Central Bank has underwritten the entire eurozone sovereign debt - could they stand large-scale losses? But why bother with this technicality if they are state-owned bodies? Precisely my point.
The BoE governor Mark Carney recently noted that the UK’s recovery was “neither balanced nor sustainable”. That is actually debatable; one can point to recent statistics in areas such as private sector consumption, GDP growth, wage levels, business investment, unemployment, and so on, and argue against this view. But that’s a separate issue.
I’m wondering when it became the role of the central bank to ensure a balanced and stable growth cycle in the economy. Wasn’t that originally the role of the private sector? Do we now have to wait until everyone is 100% convinced that growth is real and balanced and sustainable before the central bank can do anything so aggressive as to raise interest rates by 25 basis points? And, in the meantime, provide all these blanket guarantees to the private sector, be they banks, sovereign authorities or the stock market?
So why might this be something to question? Because, in the first instance, it seems to have been arrived at by the back door. The “Greenspan Put” has been put forward, convincingly I suggest, as one of the causal factors of the 2007-08 crash. Shouldn’t we ask ourselves, now that the potential abyss of 2009 is past, whether it is something that should be maintained? And secondly, stock market highs and economic recovery built on long-term central bank support – how real is that?
Because if the answer is “not very”, that’s something to worry about.

See the original article >>

Follow Us