by Greg Harmon
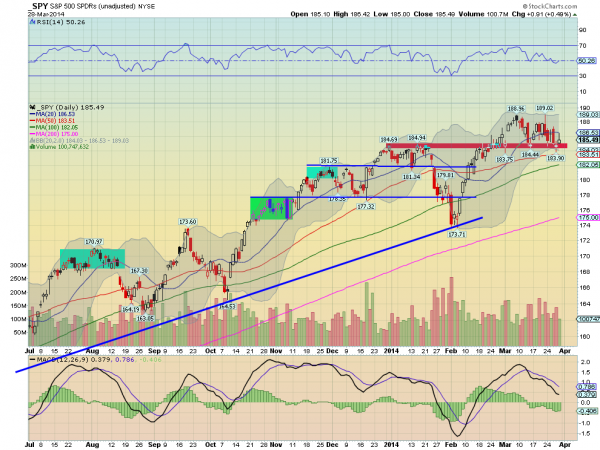
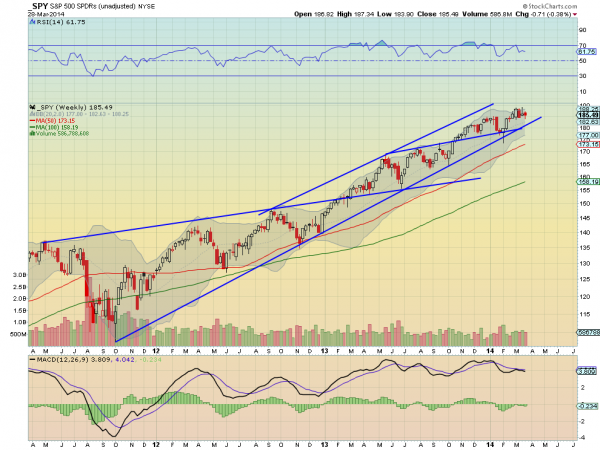
| Last week’s review of the macro market indicators suggested, heading into the last full week of the First Quarter that equity markets again look tired. Outside of them directly though it looked for Gold ($GLD) to consolidate or continue higher while Crude Oil ($USO) had a similar feel for a reversal in its case. The US Dollar Index ($UUP) was showing strength in the short run while US Treasuries ($TLT) were consolidating in the short term uptrend. The Shanghai Composite ($SSEC) looked good for more upside price action and Emerging Markets ($EEM) looked as if they may want to continue the consolidation. Volatility ($VIX) looked to remain subdued keeping the bias higher for the equity index ETF’s $SPY, $IWM and $QQQ. Their charts were not so sure of that though with all 3 consolidating under the highs on the shorter timeframe but the IWM and SPY looking healthy, and a little better than the QQQ on the longer timeframe. The week played out with Gold moving lower through 1300 while Crude Oil did reverse and move higher. The US Dollar pulled back Monday but then drifted higher to end unchanged while Treasuries made there first test of major resistance. The Shanghai Composite probed higher but gave it all back to end the week near unchanged while Emerging Markets raced higher ending the week with a topping candle. Volatility had a fairly stable weak moving in a tight range near unchanged. The Equity Index ETF’s showed continued consolidation on the SPY while the IWM and QQQ moved lower. What does this mean for the coming week? Lets look at some charts. As always you can see details of individual charts and more on my StockTwits feed and on chartly.) SPY Daily, $SPY The SPY continued the slow drift lower in a consolidation range over a support zone (in red). The price action came very close to the 50 day SMA on Thursday before a move higher Friday that stalled after touching the 20 day SMA. The RSI on the daily timeframe is trending lower but near the mid line and holding in a bullish range while the MACD is continuing lower. These support more downside. The weekly chart shows a tightening consolidation at the highs. No real damage in price. The RSI is over 60 and moving sideways with a MACD also moving sideways. Signs of consolidation for now that could turn either way. There is resistance at 186.75 and 189 with a move over that resuming the uptrend. Support lower is found at 184 and 181.80 followed by 177.75 and a move under 173.71 changing the trend lower. Consolidation or Pullback in the Uptrend. As the calendar prepares to turn into April the equity markets are looking weak. Elsewhere look for Gold to continue lower while Crude Oil continues to move higher. The US Dollar Index looks better to the upside as do US Treasuries, but both with big resistance areas nearby. The Shanghai Composite looks back to its downward price action and but Emerging Markets are biased to the upside with some caution after a big week with short term topping signs. Volatility looks to remain subdued keeping the bias higher for the equity index ETF’s SPY, IWM and QQQ, despite the moves lower. Their charts are not so optimistic though with the IWM and QQQ in pullbacks that look to continue while the SPY tries to hold on in consolidation. Use this information as you prepare for the coming week and trad’em well. |
No comments:
Post a Comment