Wednesday, April 13, 2011

VISUALIZING THE DESTRUCTION OF THE CLINTON SURPLUS

by Cullen Roche

Because I am an equal opportunity political hater – I bring you the counterargument of the Paul Ryan story. It’s unfortunate that I even have to write a story like this, but our world has become so divided down party lines that no one appears to be able to filter their economics without first deciding which side of the party line they stand on. It’s no longer about what’s best for America, but what’s best for the political party you back. But this is a good opportunity to lift the veil from some of the myths that surround the nasty politics of economics.

Many have accused me of taking a political stance when writing about the economy and Paul Ryan specifically. That’s simply not true. I often point to the Clinton years as clear evidence that this is not about politics to me, but pure economics. What do the Clinton years have anything to do with our current predicament? Let’s take a look.

The 1990′s were characterized by enormous prosperity in America. A multitude of factors combined to form one of the great economic booms in the history of modern economies. And our government used this opportunity to invoke some politics into the mix. In the late 1990′s our politicians started worrying about our national debt. The rhetoric about America going bankrupt became a persistent theme. And we took drastic measures to combat this supposed threat. Bill Clinton spearheaded the movement towards fiscal responsibility.

So, the government dramatically reduced the budget deficit and sent the US economy briefly into budget surplus. The government was saving money so they could spend it later! Unfortunately, that’s not how our monetary system works. The US government never needs to save in order to be able to spend. The government, as a monopoly supplier of the currency they require us to transact in, is nothing like a household, state, European nation or business.

What happened next directly contributed to the current malaise in the US economy. If we look at the sectoral balances we can see exactly what the Clinton surplus did. As the US economy was running a current account deficit in excess of 2% in the mid 90′s the US government began to shrink the deficit.

This wasn’t entirely misguided, however, it was taken to an extreme. As the current account remained steady near 2% the government’s balance continued to shrink and went positive in 1999. All the while the domestic private sector is being driven into deficit. Why? Because the government was not spending enough to allow the domestic private sector to net save. So what happens as Americans attempt to counteract this?
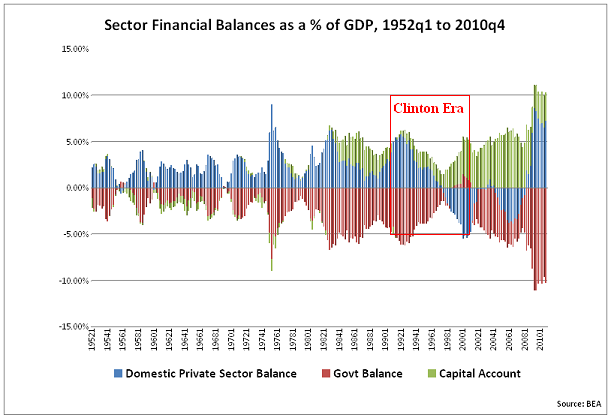
They fund their lifestyles in other ways. This means going into debt. As you can see from household debt levels Americans were taking on an increasingly large amount of debt in order to sustain their lifestyles. We all know what happened in 2000 as the dotcom bubble burst and the economy was thrown into a tailspin. The recession, in many ways, alleviated many of the excesses. This is the natural curing process of the business cycle and capitalism. It is a good thing. But I would argue that the Clinton surplus started the American public on the path towards a debt binge that would not end for another 7 years. It’s not a mere coincidence that the greatest debt binge in American history began during the end of the Clinton years. I believe this can be traced directly back to the Clinton surplus as the sectoral balances clearly show. Of course, there were more moving parts to it than just this, but the surplus played a key role in getting the wheels in motion. And so the seeds were sown for a much larger crisis.
The handling of the economy under the Bush administration is a different chapter in the story, but the moral of the story here is clear – this isn’t about politics. I don’t care for Paul Ryan’s or Bill Clinton’s politics. All I know is that their economics stink. And as we’re all finding out now, America is only as good as its economy and America’s economy is only as good as the people who formulate policy. Clinton sustained a good economy for much of his Presidency. Unfortunately, the wheels came off towards the end and his attempt to fix the US government’s fiscal “problems” played a key role here. Paul Ryan’s plan would catapult us towards the exact same situation. But again, let’s not allow the politics to cloud the economics at work here and like it or not, Ryan’s plan is bad economics given the current balance sheet recession. Just like the Clinton surplus was bad economics in the late 90′s.

Obviously, there are many more moving parts to the current malaise than just government spending and the squabbles between Republicans and Democrats, but I hope you’ll take one thing away from this story – the success of America isn’t about one party being right and the other being wrong. Most politicians don’t have the first clue about the workings of the monetary system so the odds are that they’re all wrong regardless of what they believe. But that doesn’t mean we should accept bad economics just because it fits with our personal political beliefs. Both parties have made enormous mistakes over the last 25 years. Ignoring good economics in favor of politics is no way to get this ship righted.

See the original article >>

Tracking the Wall Cycles in Search of the Business Cycle Top in 2011

By David Knox Barker

One of the contributions to market cycle analysis by the late financial analyst PQ Wall was the discovery that there are nine dynamic market cycles in every business cycle. This cycle is widely known as the 20-week cycle. Investors and traders have been aware of this cycle for decades, although its exact length has been a point of disagreement. If there actually are nine cycles in a business cycle, it is a remarkable and important discovery, and has major implications for investors and traders seeking to understand current market action, and identify the market top expected in 2011. 

In The K Wave (1995), I rechristened the 20-Week cycle the Wall cycle, because it was PQ Wall who discovered the true importance of this cycle. Exactly how PQ made his discovery of the number of Wall cycles in a regular business/trade cycle is a rather lengthy subject. Therefore, the specific focus of this article is limited to the powerful evidence for the existence of nine Wall cycles in the last business cycle and the Wall cycle count in the current business cycle, which is likely to end in a global financial market disaster that goes down in the history books, trumping the debacle into 2009.

The Wall cycle is one of the most important cycles for both investors and traders, allowing them to identify important market turns using market price, cycle time and investor sentiment. Investors and traders ignore this powerful dynamic cycle at their peril. The evidence suggests that the global market decline that just occurred into March 16, 2011 was the termination of a Wall cycle #4 and the beginning of a new one in major developed markets. Wall cycles 3, 6, and 9 are typically the weakest in a business cycle, based on what PQ called third, last and weakest. One of the nine Wall cycles will usher in the top of the current business cycle, and begin a dive in the market cycles that will test investor and trader’s nerves with more gut wrenching global financial turbulence than the 2007-2009 global crash. 

It is important to recognize the basic cycle math used by PQ to determine that there are nine Wall cycles in every business cycle. Through his lifelong quest to unravel the mystery of market cycles, PQ discovered a regular divisibility by four and three built into all market cycles. To arrive at the nine Wall cycles in a business cycle you take a long wave, divide it into four seasons, divide the four seasons into four business cycles, divide the business cycle into three thirds, and divide again by three to arrive at nine Wall cycles in a business cycle. This math also means that a Wall cycle is a long wave divided by 144.

A healthy degree of skepticism is reasonable. The idea that every business cycle divides into nine dynamic Wall cycles, no matter what distortions central bank monetary policy and government intervention inject into the global system, is a rather bold assertion. I was also highly skeptical, until I did extensive cycle research and validated PQ’s rather stunning hypothesis.

This is where the Wall cycle story gets interesting. Although PQ did not describe it as such, what he was essentially arguing was that his cycle math represents a natural law in market cycles. How can human action pursuing purpose through buying and selling in global markets produce such cycles?

In the mid-1990s, I decided to take PQ at his word and test his theory. In order to test it, I concluded that there had to be an ideal length to all cycles, even if the “ideal” rarely occurs. This made sense because PQ proposed that the cycles of human activity in markets were essentially fields of human action in the global economy, with a corollary in the hard sciences and field theory in physics. Physicists have discovered that fields in the hard sciences are governed by degrees of freedom; essentially fields have some play in space-time.
2002-2009 Business Cycle
If you have ever observed Fibonacci ratios of support and resistance in market prices you will readily understand how they act as degrees of freedom in the pricing mechanism of markets. It is clear that most market cycles are dynamic and not static. This means they fluctuate in length and are not fixed. This being the case, the search was on for an ideal cycle length and the Fibonacci degrees of freedom around the ideal lengths.

Without going into detail, when 42 months was tested as the ideal or “natural” length of a business cycle, a remarkable discovery was made. There is a strong tendency for the business cycle to hit date targets that are Fibonacci degrees of freedom around that ideal length. When you take 42 months and divide by nine to test for an ideal length for the Wall cycle, the evidence is even more convincing.

Recognizing the need for a tool to mine market data and prices to discover cycles in price and time, the Market Cycle Dynamics (MCD) software is in development and approaching completion. I now have a test version of the software, and I thought I should demonstrate to readers some of the early results.

The extremely long business cycle from 2002-2009 has been a challenge for all market cycle analysts. It was an unusually long business cycle, bloated by trillions of dollars during the global housing bubble, and late last year we learned that in 2008 and 2009 over $9 trillion dollars in loans from the U.S. Federal Reserve prevented the cycle from putting in a timelier bottom.

The MCD tool was used to analyze the 2002-2009 business cycle for its nine component Wall cycles. The tool allows analysis of cycles in price, time and sentiment simultaneously in ways that were previously impossible. What I discovered is remarkable. In our cycle work, stochastics are used to determine a full cycle, with 20- 80-20 in an appropriate stochastic marking the full turn of a cycle.

The chart demonstrates that in the business cycle from 2002-2009, using an 89 period daily fast stochastic (about 13 weeks), there are “exactly” nine cycles that ran from below 20 to over 80 to below 20 in those blue stochastics at the bottom. That on its own is a shocking and statistically relevant finding far beyond any mere coincidence, but it gets even better. Each one of those yellow arcs on the chart for each one of those nine Wall cycles are generated using a Fibonacci ratio of the “ideal” 141.9-day Wall cycle. The W3 cycle was not exact, but it was close.

It gets even more interesting. That arc that represents the second Wall cycle, labeled as W2, which includes one full trip from below 20 to over 80 to below 20 in the 89 period daily fast stochastics, is a Fibonacci ratio 261.8% longer than the ideal cycle of 141.9 days. Evidently, that’s what trillions in future bad mortgages during the early stages of a global housing boom will buy. The W3 and W6 cycles are 61.8% longer than the ideal, while W9, which received what we now know, was trillions in intervention by global central banks, including $9 trillion in loans by the U.S. Fed, is 161.8% longer than the ideal. These are abnormally large Wall cycles.

Those skeptical of the price, time and sentiment approach to cycles analysis should observe the price lines on the 2002-2009 chart. Those red line price targets and ratios are Level 1 Fibonacci grids generated by the 1982 low and the 2007 high. The green lines are Level 2 Fibonacci grids, i.e., the Fibonacci grid between the adjacent Level 1 price targets. Every one of the Wall cycles turned on a Level 1 or important Level 2 Fibonacci target. 

What this exercise in market cycle turns in price, time and sentiment exhibits is that even a business cycle distorted by trillions in central bank monetary and government fiscal intervention exhibited its nine Wall cycles in price, time and sentiment. If you are not tracking the essential market cycles in price, time and sentiment, you may be missing a big part of the picture Mr. Market is painting.

This brings us to the current business cycle. If you think that QE2 and trillions in deficit fiscal spending and policy are going to make the business cycle go away, and that this time it is different, then go ahead and follow the crowd wherever it leads. If you are interested in tracking the cycles, look at the chart below. It is tracking the Wall cycles in the business cycle beginning March 2009. The bottom in global markets on March 16, 2011 was the bottom of Wall #4. The top of the current business cycle will likely come in the current Wall #5, or even Wall #6, if Chairman Bernanke keeps his helicopter aloft for QE3. However, if that Level 1 1228 target is taken out, this final business cycle of the Kondratieff long wave is in its declining phase into 2012-2013, which conjures up visions of a flock of black swans.
Kitchin Cycle #16

See the original article >>

Follow Us