Friday, March 14, 2014

Buy Low And Sell High To Generate Significant Capital Growth

Super Commodity Strategy generates significant medium term capital growth with simple and strict risk management rules. Our Super Commodity Trading Signal Service takes + 251.85 % since 2009.


In addition we also provide automated intraday and short-medium term signals with some winning trading systems om your managed accounts.

gywxsncx.hyt
Daily e Monthly Equity


31t1laf0.a1h
                Download Historical Results Pdf


Material in this post does not constitute investment advice or a recommendation and do not constitute solicitation to public savings. Operate with any financial instrument is safe, even higher if working on derivatives. Be sure to operate only with capital that you can lose. Past performance of the methods described on this blog do not constitute any guarantee for future earnings. The reader should be held responsible for the risks of their investments and for making use of the information contained in the pages of this blog. Trading Weeks should not be considered in any way responsible for any financial losses suffered by the user of the information contained on this blog.

Natural gas stays in spotlight

By Erik Tatje

NATURAL GAS (NYMEX:NGJ14)

Natural Gas continues to steal the spotlight as price action continues to validate technical levels on the chart. The most significnat technical pivot heading into today’s session appears the be around 4335. After a relatively weak showing throughout the day yesterday, price did to find a bit of support around the 4380 and 4335 pivots on the chart.  Ideally, price should stay contained below the 3400 level and continue to probe lower.  The 4335 support pivot could serve as a “trigger point”, which if broken, could intrduce additional selling pressure into the market and quickly take prices down to the 4265 pivot. Both the intermediate term trend as well as near term momentum are pointing toward lower prices and selling rallies into resistnace looks to be the safest play in the natural gas market. Until price can rally back above the 4540 pivot on the chart, the intermediate directional bias will remain to the short side in natural gas.

Apr. ’14 Natural Gas 30-minute Bar Chart. Source: eSignal

E-MINI DOW

After multiple days of relatively quiet price action, the stocks took a hit yesterday after, what seemed to be, relatively positive economic data reports in Jobless Claims and Retail Sales. The positive reports were not enough to sustain record-high prices in the indices and shortly after the brief rally following the number, the US indices began their decent. The Dow fell over 300 points before eventually finding support around the 16094 pivot. Price has since retested this level and held in the early morning session, which could present a valid long entry pivot for those still confident in US stocks.  The two main technical levels of significance heading into today’s session seems to be the previously mentioned 16094 support pivot, as well as the 16048 level. In the event that the current correction continues lower, a breakdown below 16048 could confirm a bearish outlook in near-term momentum. Also important to note, the 15948–15978 support band has provided structure to the market on multiple occasions over the past few weeks and could come into play if this corrective pullback persists into next week. For those looking for resumption of the underlying bull trend, the 16180 is a solid initial upside target from here and the 16247 level represents a 50% retracement of yesterday’s big move. It is not uncommon for markets to “bounce” up to a Fibonacci retracement level after a big move like this, so keep these Fibo retracement pivots in mind when assessing long profit targets.

Mar. ’14 E-mini Dow 30-minute Bar Chart. Source: eSignal

SUGAR

May 14 sugar has spent some time digesting between the 1730-1847 area on the chart and the recent pullback in sugar could present a valid risk/reward entry level for traders looking to play the long side of sugar. Technically, the 1730–1745 support band appears to be the most relevant technical level for this market heading into today’s session. With an intermediate term trendline intersection the market around the 1730 level as well, this 1730 support now takes on added significance. Buying dips into this level seems to be a valid opportunity anticipating a bounce of support and a resumption of the underlying bull trend. If the market does produce a confirmed break below the 1730 support pivot, it may be advisable for traders to take a step back and reassess this market. Below this support pivot, the market could dip as low as 1670-1675 before encountering significant support. All things considered, the market has not made any significant lower lows to warrant a trend change and the recent corrective pullback into support could offer a high probability entry signal for traders.

May ’14 Sugar 30-minute Bar Chart. Source: eSignal

See the original article >>

Production growth battles geopolitical risk in energy space

By Phil Flynn

Markets across the globe are trying to price in a wide array of risk factors and as bad as that is it might have been a lot worse if it were not for the shale gas and oil revolution in the United States. The International Energy Agency seemed to say just that in their latest report. The EIA says that pressure on global oil markets will ease in spite of rising geopolitical tensions because of surging supply from Iraq and other producers like the United States. Iraqi oil production hit a whopping 30.49 million barrels a day which was the highest levels in 35 years.

This should be a stark warning to Vladimir Putin whose folly in Crimea could force his energy customers to seek a more stable supplier. Russia is very dependent on energy exports and the IEA says that at this point the West and Russia are mutually dependent on each other, but that could change in the near future with global supply on the rise. From a long-term view this invasion of the Crimea could do lasting damage to the Russian economy and while the Chinese may keep buying Russia’s oil they obviously are having problems of their own.

The Guardian reports that “China is braced for a wave of industrial bankruptcies as its slowing economy forces companies with sky-high debts to the wall, the country's premier has said. Premier Li Keqiang told lenders to China's private sector factories they should expect debt defaults as the world's second largest economy encounters "serious challenges" in the year ahead.

Speaking after the annual session of the national people's congress, Li Keqiang said: "We are going to confront serious challenges this year and some challenges may be even more complex."

He told lenders to China's private sector factories they should expect debt defaults. Li said China must "ensure steady growth, ensure employment, avert inflation and defuse risks" while also fighting pollution, among other tasks. "So we need to strike a proper balance amidst all these goals and objectives," he added. "This is not going to be easy," he said.

Li's warning followed the failure of Shanghai Chaori Solar Energy to make a payment on a 1bn yuan (£118m) bond last week. The default was the first of its kind for China and widely seen as pointing to the end of 11th-hour government bailouts for troubled enterprises”

Both China and Russian stocks have been hit hard but don’t look to the euro for safety. Mario Draghi, “Mr. Whatever it takes” is showing his displeasure with the currency’s resent assent.  He is warning that the assessment of price stability is becoming increasingly relevant. Worries about deflationary pressures could inspire stimulus from the ECB. This of course would be a new course for the European Central bank that in the past has been more focused on fighting inflation over everything else.

While the comments by Draghi seemed to slow gold’s epic and historic run it did not break it because it only will enhance gold’s stature as a safe haven in an increasingly unsafe world. Add to that the historic divergence that we have seen between stocks and commodities are reverting to the mean. Gold prices went inverse to stocks at a historic pace now looks poised to recapture everything it gave up last year.

Oil of course is falling as demand prospects are looking more-shaky. Brent crude which gained on WTI earlier on reversed as U.S. economic data suggest that our demand be a bit better that anticipated. Still with U.S. stocks taking a hit the Brent/WTI spread could widen as the show down over the Ukraine will wait for the vote that could provide cover for Vladimir Putin incursions into other countries.

Spring is springing and it has waged on Nat gas prices, still don’t look for prices to fall too far as to have high prices producers will have to be inspired to produce at a record pace. 

See the original article >>

Market Internals Show Deterioration, Trend Still Bullish For Now

by Lance Roberts

This past Monday I penned a piece entitled "10 Signs Of Stock Market Exuberance" which detailed some notes from the discussion that I recently had with another portfolio manager.  Interestingly, this article received a series of diametrically opposed opinions from "why are you so bearish" to "why aren't you recommending all cash in portfolios."   Of course, having two opposing sets of opinions is what makes a market in the first place but this does raise a good opportunity to take a look at the health of the current market rally.

If you are a regular reader of my weekly newsletter then you already know that we are currently at 100% of target allocations.  The mistake that many individuals make is assuming, with regard to Monday's post, is that if I express concern about particular aspects of the market that means I am "bearish" and must be "all in cash."  In fact, expressing a "bearish view" in the current market environment almost rises to the level of heresy (thank goodness that "burning at the stake" has been outlawed, at least for now.)  However, if you want the "bullish view" just turn on the television, pick up any financial editorial or scroll the internet; finding an unbiased non-bullish discussion is about as rare as a "Yetti" sighting these days.

In my view, the real risk is adopting a viewpoint that is inherently "bullish" or "bearish."  This is a trap that investors fall into that leads to "confirmation bias" where opposing opinions are disregarded.  For investors, this is ultimately fatal.  For me, the markets are either "rising" or "falling."   The financial media primarily exists as a coincident indicator only telling me what I already know.  What I need to know is what may cause the current "trend" to change.  More importantly, when is the current "risk" I am taking with my client's money outweighed by the potential "reward."

With portfolios currently fully exposed to the market, the "risk of loss" has been elevated.  Therefore, like a doctor/patient relationship, we can monitor several internal indicators of the markets health in order to gauge the when the "risk" exceeds the potential for "reward."

Net New Highs

The first internal measure I want to examine is the number of NET new highs.  This is the number of stocks hitting new highs less the one hitting new lows.  In an "exuberant" bull market, you would expect to see the number of net new highs at very high levels.

SC-Weekly-NetNewHighs-031314

What the chart above tells us currently is that the number of net new highs is declining.  This is typical as markets become exhausted during a bullish phase.  Unfortunately, net new highs are only useful in indicating a potential correction, but not when that correction turns into a more meaningful reversion.  Therefore, declining net new highs, as markets are rising, should be treated with equal caution.

Advancing Versus Declining Issues (Market Breadth)

Another measure of the internal health of the market is its "pulse."  One way to look at this is the "breadth" of advancing versus declining issues.

SC-Weekly-NYSEAdvDec-Ratio-031314

When the breadth of the market is advancing, as it is now, the markets are within a bullish trend meaning that investors should be exposed to risk.  The problem with market breadth is that it is historically not a very precise market timing indicator and, like net new highs above, doesn't distinguish between short term corrections and full blown reversions.  Therefore, declines in market breadth should not be ignored and evaluated within the context of the overall trend of the market.

Number Of Stocks Above Their 200 Day Moving Average

In a rising bull market the number of stocks above their 200 day moving average (dma) would be expected to be high.  The longer the bull market has run, the higher the number of stocks above their individual long term moving averages will be.  Deterioration in the number of stocks above their 200 dma is a warning that a potential correction is in the making.

SC-Weekly-StocksAbove200DMA-031314

The chart above shows historically when the percent of stocks above the 200 dma have peaked, and began a decline, market corrections have quickly followed.  The problem with this indicator, as with the other measures discussed herein, is the inability to determine when a correction becomes a "mean reverting" event.

Number Of Stocks On Bullish "Buy" Signals

Another measure of market "health" is the number of stocks on "bullish buy signals" as determined by "point and figure" analysis.  Again, the longer a bull market has been in process, the higher the number of stocks on bullish buy signals there should be.  Historically, as shown in the chart below, when this indicator has turned lower corrections were generally soon to follow.

SC-Weekly-BullishPercent-SPX-031314

The current period is the longest since 2004 where the bullish percent index has peaked and turned lower without a significant correction.  The deterioration in the index certainly suggests a much higher risk profile in the market as the bullish strength weakens.

Long Term Moving Average Convergence/Divergence

As I discussed in Monday's article, all of these indicators are "warning signs" that there is potential danger ahead.  That danger could range from a mild correction of 5-15% or something much more mean reverting in nature which could easily approach 30% or more.

What these indicators don't tell us is when the current trend is changing from positive to negative.  As Bill Clinton once stated "What Is...Is."  In the world of investing there really is no "bullish" or "bearish" view, it is simply what "is" until "it isn't."

SC-MACD-Longterm-BuySell-031314

The chart above shows the market as compared to a long term moving average convergence/divergence (MACD) indicator.  What this indicator clearly shows is when the "price trend" has turned from positive to negative and back again.

The current bullish trend remains intact which suggests that portfolios remain fully allocated at the current time.  However, the ongoing deterioration of the "market internals" also suggest "attention" be paid to portfolios.  The "easy money" is long behind us and we are only "marking time" until the next correction or major market reversion.

While the Federal Reserve may have inflated asset prices through continued rounds of liquidity, they have not repealed either economic or market cycles.  The sustained levels of investor complacency, a complete disregard of investment risk and fundamentals, and the continued stretch for yield is a toxic brew that has always ended badly.  This time will be no different.

That last paragraph is not a "bearish" viewpoint, it is just a fact of what currently "is." As a portfolio manager, I must remain invested in the markets when the trend is positive or suffer "career risk."  That is also a fact.  However, understanding when the light at the end of the tunnel is, in fact, an oncoming train is what defines the "long game" of investing.

See the original article >>

Breakout in Gold Price and Gold Mining Stocks!

By: Jordan_Roy_Byrne

Lately we’ve been writing about why we expected the rebound in precious metals to continue without any serious setbacks. After a major low, sentiment can remain muted for several months even in contrast to the improving market action. Yet, a look at history shows that rebounds from major lows can continue unabated and unscathed for more than a year. The rebound in precious metals thus far appears to be following this script. It has received a further boost with the breakout in Gold yesterday and as of now, the breakout in the gold miners.

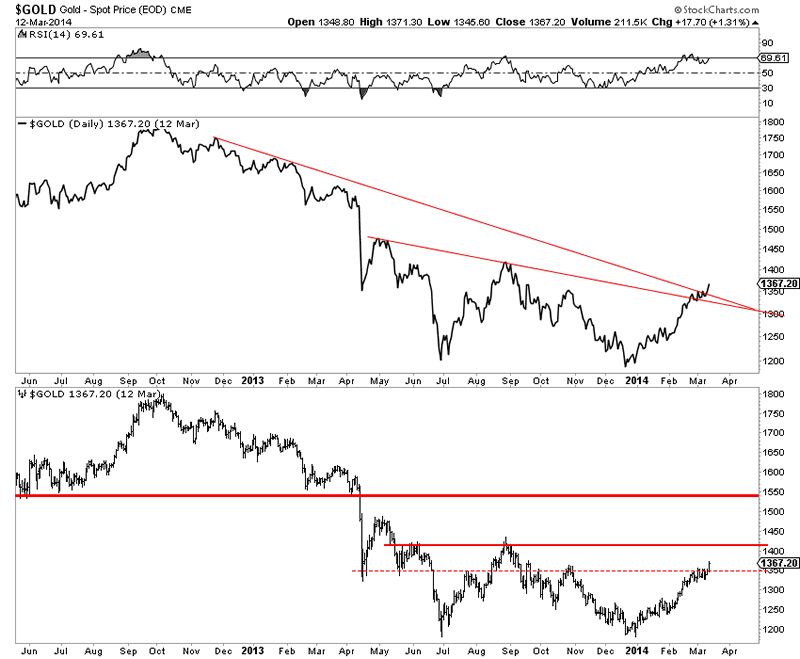
First, let’s take a look at Gold. The chart below highlights the importance of $1350-$1360 which was major trendline resistance since April 2013 and November 2012. With the breakout past $1360, the next key target is $1420. Gold has weekly resistance at $1400 so keep that in mind as well. If Gold can takeout $1420 convincingly on a weekly basis then it could have legs to $1500.

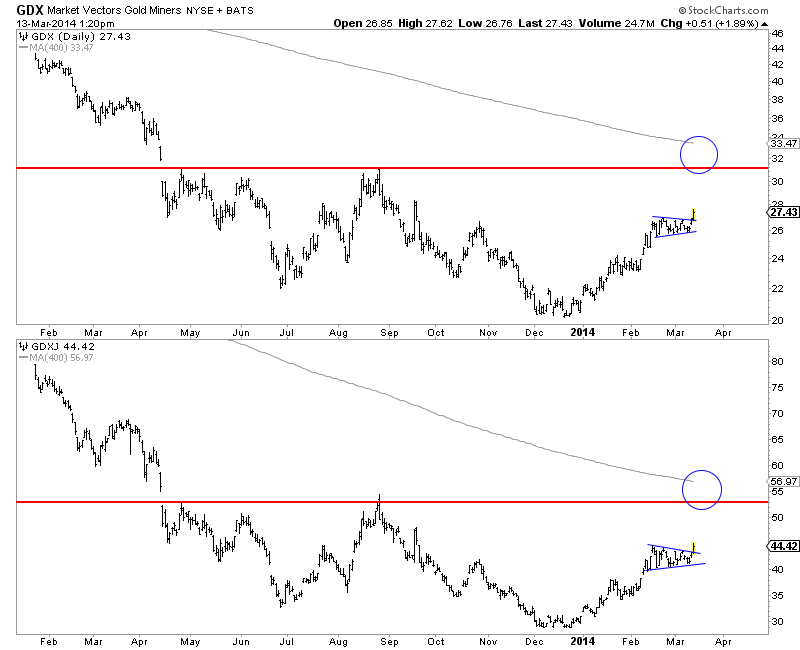
Today we have the gold miners, both GDX and GDXJ breaking out of their consolidations. For several weeks both markets held in tight consolidations which appear to bullish flag continuation patterns. GDX’s upside target is $31 while GDXJ could reach $53. The 400-day moving averages could intersect with these targets to form strong resistance.

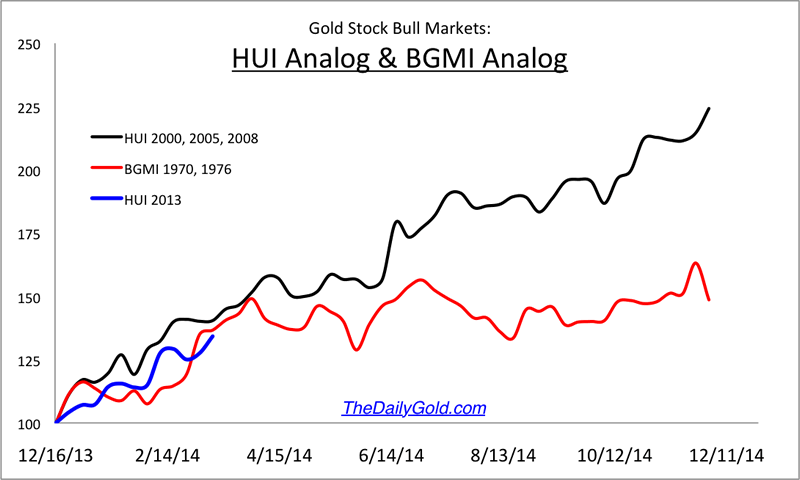
The gold stock bull analog chart shows that this current recovery in the HUI Gold Bugs Index is very much in-line with historical recoveries. The current recovery is in blue.

Last week we wrote:

It is incredibly difficult to buy at this juncture but, as we noted in our last editorial, the evidence favors doing so. Pullbacks, until we see much larger gains should be brief and should be used as an opportunity. ETFs such as GDX, GDXJ, and GLDX have spent the last 11 days consolidating and digesting gains.

When the market evolves according to your thesis you don’t do anything. You sit tight until you decide to take profits or something changes. Considerable near-term upside potential remains in play for the gold stocks. Silver and the silver stocks have lagged in recent weeks but they will perform well if this breakout is sustained as we expect. As the previous chart shows, there is potentially a lot more upside in play for the balance of the year. Be long, sit tight and have an exit strategy (to limit losses) in case things play out differently.

See the original article >>

Ticking Time Bomb: $1 Trillion Leveraged Loan/Junk Bond Issuance + Record Cov Lite

by Jeffrey P. Snider

There has been a lot of discussion about the Chinese credit markets, and rightfully so, as unusual events are in the midst of probing “market” sensibilities as they relate to great imbalances. Along that line, this passage in a CNBC article caught my attention:

Strict government controls, and the fact that state-owned companies own the bulk of government debt prevent the market from acting like a truly contested market, she said. Meanwhile, the same problem is prevalent in the corporate bond market, which is equally owned by banks, insurance firms and fund managers.

“The result is a manufactured spread between government bonds, state-owned firms’ bonds and private firms’ corporate bonds,” she said.

That really doesn’t tell us anything we don’t already know, as we have had good experience with artificial markets ourselves. And that is what interested me the most, mainly that how the analyst described the Chinese market in the two paragraphs above could easily pass for an accurate description of the US credit markets (and Europe, for that matter). We may think there is a free market difference between here and China, but with ZIRP and QE US banks and foreign banks operating onshore here are essentially “state owned.” And if anyone thinks corporate spreads are “market-based” instead of manufactured they live in a different world altogether.

This artificiality gives rise to the runaway situation where credit growth drives itself as a positive feedback loop – the more borrowing takes place after a certain point, the more borrowing needs to take place to keep it all together (I know, Minsky again). That is why I believe the housing market in the US is in serious jeopardy of retrenchment – the bursting of a second (albeit smaller) bubble in such a condensed period of time can potentially have a generational effect on housing.

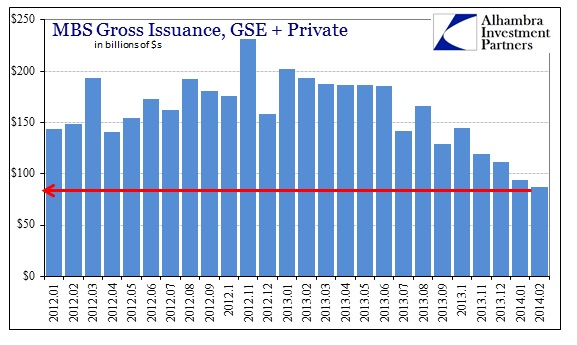
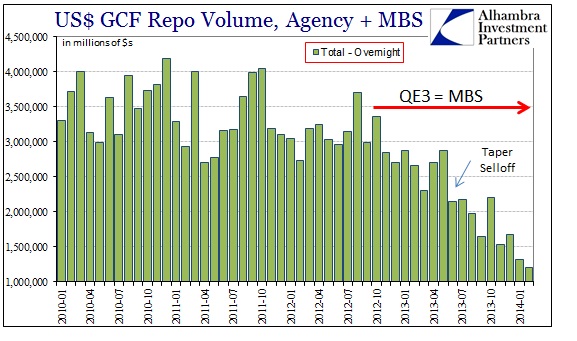
ABOOK Mar 2014 Credit MarketsABOOK Mar 2014 Credit Markets MBS Repo Volume

And this retrenchment was born not of manufactured spreads but of the sudden reappearance of markets awoken from QE-induced slumber. That more than hints at a certain and concerning fragility that is incorporated throughout the post-crisis financial rebuild effort, as you would expect as much since leverage created via “policy” is far less robust than leverage created via organic means. You cannot claim organic fundamentals when a relatively minor increase in the mortgage rate, from record lows to near record lows, produces a 60-70% collapse in MBS (issuance and finance).  Such incongruence is unambiguous evidence of fragility.

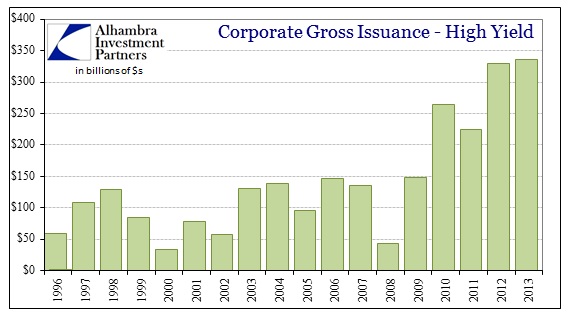
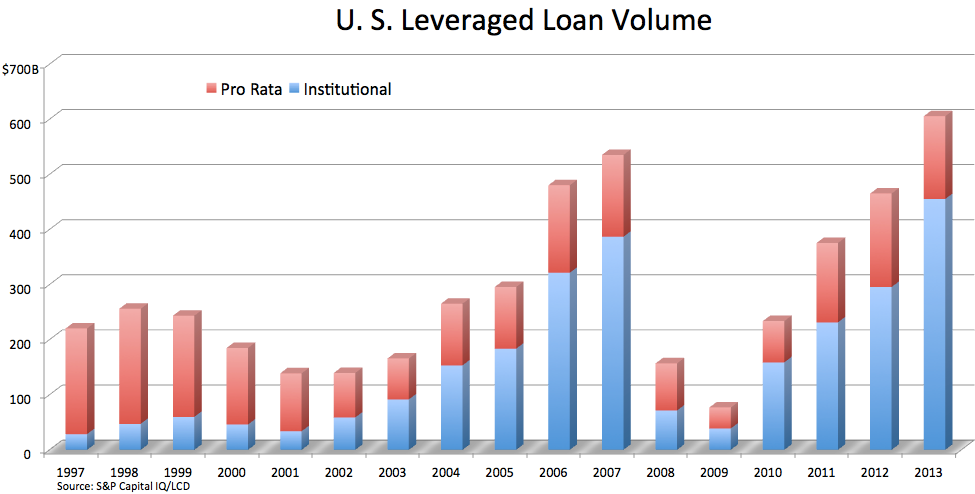
I think that is most evident in the new subprime, or at least the version that has taken on those characteristics within this latest policy “cycle.” High yield debt and leveraged loans (syndicated loans of “low quality” corporate obligors that are bought and sold in discrete packages) in 2013 obliterated the previous cycle peak in 2007.

ABOOK Mar 2014 Credit Markets Corp HY2013-leveraged-loan-volume1

Leveraged loan volume cited above includes only new issuance, meaning that is the marginal expansion of corporate “subprime” borrowing. There is a definite pace to it, as well as junk bonds, clearly moving in cycles that were accelerated beyond historical experience (2004-07, 2010-13). This leverage cycle features no mystery as demand for it is proportional the degree to which spreads and returns are manufactured toward “stimulus.”

Thinking about it in economic terms, there was almost $1 trillion in junk/leveraged loans issued in 2013 that did what, exactly, for the US economy?

It’s not just the pace of credit creation that catches the manipulated spreads here, as quality is assuredly one of the primary factors in determining “cycles.” According to Moody’s, via Barrons:

The average covenant-quality score for high-yield bonds in North America dropped to 4.36 last month from 3.84 in January on Moody’s five-point scale, in which 1 denotes the strongest investor protections and 5 the weakest.

We have been hearing for more than a year that this new subprime has been featuring reduced quality. In terms of leveraged loans, “cov-lite” is now more than half of high yield lending.

As of Jan. 31, the share of loans in the S&P/LSTA Leveraged Loan Index without maintenance covenants grew to a record 50.04%, from 46% at the end of 2013.

Clearly, financial covenants – once a hallmark of secured loans – haven’t been the norm for the new-issue market for some time. In January, 53% of new-issue institutional volume launched was covenant-lite, down from 68% in December.

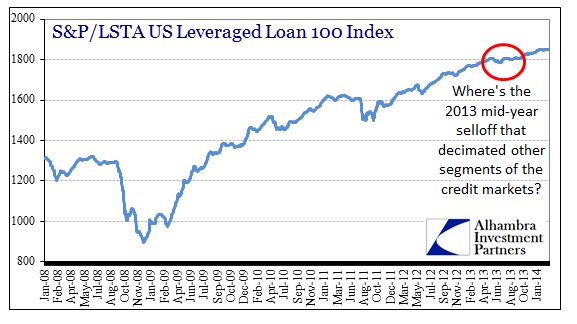
Despite that steady deterioration, there has been exactly zero in the way of perturbation in the leveraged loan market. In other words, the worse these loans get, the more stable prices have become – a telltale sign of bubble mania – which can only be interpreted as participants are convinced nothing bad can happen, ever. Instead, fear is not of loss but of missing out, the very inversion of basic investment fundamentals.

ABOOK Mar 2014 Credit Markets Lev Loans

In the space of only a year or so, the 10-year UST rate is about 100 bps higher, whereas junk bond yields and leveraged loans are about even or lower (particularly in the case of leveraged loans). How is that congruent to what we know about markets? Indeed, that inversion extends in almost every direction, where the riskiest markets have exhibited the most stable and rising prices (I would very much include US equities in that).

The primary problem with this inversion is that it all comes back to misinterpretations of liquidity. If you buy into the leveraged loan premise that exists right now, you are essentially thinking that you will be able to get out if you need to should conditions change (Greater Fool). But that assumption is based on artificial conditions of liquidity that are evident right now, itself manufactured by policy extension. In other words, the volume and bids that exists in these markets today are by no means an indication of what conditions might be like once an inflection is reached (which is inevitable). Narrow spreads like this are an illusion that conditions are favorable and will remain so, but what they really signify is this inversion where risk appears risk-free because leverage has been added solely to policy considerations. The artificiality almost guarantees that will not be the case in relatively short order as revulsion is geometrically more powerful on the downside than complacency on the upside.

It is perhaps the most conspicuous signal of such great imbalance (in dollars) evident at this moment. One final note: tangential to spreads and the rationalizations of them is the historically low default rate. While that may be used as more comfort to buy such junk with reckless abandon, low default rates, particularly this low, are instead indicative of cyclical peaks. But what may be more concerning is that low default rates that persist, due to manufactured spreads and abundant funding, only bunch defaults closer together at that inflection point in the future. In other words, liquidity does not solve solvency problems, only delays the reckoning. Doing so in systemic fashion is the very definition of pro-cyclicality.

See the original article >>

Is the Deep State Fracturing into Disunity?

by Charles Hugh Smith

I recently discussed the Deep State and "throwing Wall Street under the bus" with my friend and colleague Jim Kunstler.

When we speak of The Powers That Be or the Deep State, this ruling Elite is generally assumed to be monolithic: of one mind, so to speak, unified in worldview, strategy and goals.

In my view, this is an over-simplification of a constantly shifting battleground of paradigms and political power between a number of factions and alliances within the Deep State. Disagreements are not publicized, of course, but they become apparent years or decades after the conflict was resolved, usually by one faction winning the hearts and minds of decision-makers or consolidating the Deep State's group-think around their worldview and strategy.
History suggests that this low-intensity conflict within the ruling Elite is generally a healthy characteristic of leadership in good times. As times grow more troubled, however, the unity of the ruling Elite fractures into irreconcilable political disunity, which becomes a proximate cause of the dissolution of the Empire if it continues.
I recently proposed the idea that Wall Street now poses a strategic threat to national security and thus to the Deep State itself: Who Gets Thrown Under the Bus in the Next Financial Crisis? (March 3, 2014)
Many consider it "impossible" that Wall Street could possibly lose its political grip on the nation's throat, but I suggest that Wall Street has over-reached, and is now teetering at the top of the S-Curve, i.e. it has reached Peak Wall Street.
Consider what the extremes of Wall Street/Federal Reserve predation, parasitism, avarice and power have done to the nation, and then ask if other factions within the Deep State are blind to the destructive consequences:
How The Fed Has Failed America, Part 2 (March 12, 2014)
The Fed Has Failed (and Will Continue to Fail), Part 1 (March 11, 2014)
Can anyone not in Wall Street or the Fed look at this chart and not see profound political disunity on the horizon?


source: Poll Shows Why QE Has Been Ineffective (STA Wealth Mgmt)

I recently discussed the Deep State and "throwing Wall Street under the bus" with my friend and colleague Jim Kunstler: here's the resulting podcast, which you can download or listen to on whatever device you are using at the moment: KunstlerCast 250 — Chatting with Charles Hugh Smith
Jim's trademark wit and clarity guide the discussion, and he kindly lets me blather on about the Deep State. I think you'll find the discussion of interest; you certainly won't hear this topic being aired elsewhere.

See the original article >>

U.S. stocks fall as China, Ukraine overshadow American economy

By Joseph Ciolli and Callie Bost

U.S. stocks fell, erasing this year’s gains for the Standard & Poor’s 500 Index (CME:ESM14), as weaker-than-forecast data from China and tension in Ukraine overshadowed reports showing an improving American economy.

United Technologies Corp., Pfizer Inc. and American Express Co. tumbled more than 2.4% to lead declines in the Dow Jones Industrial Average. An S&P gauge of homebuilders lost 3.2%, falling for a seventh straight day. Dollar General Corp. slipped 3.2% as it forecast earnings below analyst estimates.

The S&P 500 fell 1.3% to 1,844.67 at 3:29 p.m. in New York. The benchmark index reversed earlier gains after climbing to within four points of its closing record of 1,878.04 reached on March 7. The Dow dropped 238.67 points, or 1.5%, to 16,101.41. Both gauges are poised for their biggest decline since Feb. 3. Trading in S&P 500 stocks was 4% above the 30-day average at this time of day.

“People have certainly moved on to worrying about global issues and a lot less about domestic ones,” Jeffrey Kleintop, Boston-based chief market strategist at LPL Financial LLC, which manages $414.7 billion, said in a phone interview. “The market is clearly focused on the Ukraine situation today, which could further contribute to volatility tomorrow.”

The S&P 500 has declined 1.6% this week, sending the index to a 0.2% loss for the year, amid concerns that China’s economy is slowing and the crisis in Ukraine is escalating.

‘Very Serious’

The U.S. and Germany stepped up pressure on Russia to back down from plans to annex Crimea from Ukraine after the region holds a referendum in three days, warning they’ll exact an economic toll if Russia doesn’t.

Secretary of State John Kerry told a Senate panel in Washington that the U.S. and Europe will take “very serious” steps the day after the vote “if there is no sign” of a resolution to the crisis.

China’s industrial-output, investment and retail-sales growth cooled more than estimated in January and February, data showed today. China announced an economic growth target of 7.5% last week, the weakest since 1990, and had its first onshore bond default after a solar-panel maker failed to make an interest payment.

“Ongoing concerns about China’s growth and the fluid situation in Ukraine continue to linger on markets,” Ryan Larson, the Chicago-based head of U.S. equity trading at RBC Global Asset Management (U.S.) Inc., said. “As Kerry meets with his Russian counterpart tomorrow in a last ditch effort to divert the referendum, markets could be a little jittery, and we might be seeing some of that play out today as well.”

U.S. Economy

Global concerns overshadowed better-than-forecast data in the U.S. Retail sales rose in February for the first time in three months, as Americans ventured out to shop last month even as colder-than-normal temperatures and severe snowstorms blanketed parts of the U.S. A separate report showed a drop in unemployment benefits for the latest week, indicating further improvement in the labor market.

The government’s monthly jobs report last week showed U.S. employers added more workers than estimated in February. The Federal Reserve is trying to determine how much recent economic data has been affected by weather.

“The lingering question has been how disruptive this deep freeze has been to the economy,” James Dunigan, who helps oversee $127 billion as chief investment officer in Philadelphia at PNC Wealth Management, said by phone. “As we come out of this deep thaw, if we get some better, more clear data on the underlying trend, we’re going to see that the economy is continuing to gain momentum.”

Fed Stimulus

The S&P 500 rallied to all-time highs this year as Fed Chair Janet Yellen said the U.S. economy was strong enough to withstand measured reductions to the central bank’s monthly bond purchases. Three rounds of Fed stimulus have helped push the S&P 500 up 173% from a 12-year low, as U.S. equities begin the sixth year of a bull market that started March 9, 2009.

The Federal Open Market Committee, which meets March 18-19, has cut monthly bond buying to $65 billion from $85 billion in December. Policy makers have indicated they plan to taper by $10 billion at each meeting absent a weakening in the economy.

“After last Friday’s employment numbers, we believed they were worthy of the FOMC continuing to take $10 billion off the table every month,” Ernie Cecilia, chief investment officer at Bryn Mawr Trust Co. in Bryn Mawr, Pennsylvania, said in a phone interview. “After the March 18-19 meeting, we should be at $55 billion a month.”

P/E Ratios

Stocks are falling at the anniversary of a bull market that sent the S&P 500’s price-earnings ratio to 17, approaching the level where equities peaked in 2008. The advance is about a week away from supplanting the stretch of equity gains that lasted from 1982 to 1987 to become the fifth longest of all time, according to Bespoke Investment Group LLC.

It’s also three weeks before the end of the first quarter, a period for which Wall Street analysts have lowered forecasts for U.S. earnings growth to 1.9% from 6.6% at the start of 2014, according to data compiled by Bloomberg. For all of 2014, analysts see profits climbing 7.6%, compared with an estimate of 9.7% at the end of December.

The decline in equities comes after more than $41 billion returned to U.S. exchange-traded funds that own shares in the past four weeks, reversing withdrawals that swelled to as much as $40.2 billion last month, according to data compiled by Bloomberg.

Volatility Gauge

The Chicago Board Options Exchange Volatility Index, a gauge for U.S. stock volatility, rose 15% to 16.58 today. The measure has advanced 21% this year.

Nine of 10 main industries in the S&P 500 fell today, with industrial and technology shares dropping more than 1.7%. The Morgan Stanley Cyclical Index tumbled 1.8% and the Dow Jones Transportation Average slid 1.7%.

An S&P index of homebuilders lost 3.2%, bringing its decline for the month to 8.6%, as Toll Brothers Inc. dropped 3.5% to $36.44 and PulteGroup Inc. declined 3.4% to $19.01.

Discount retailer Dollar General slipped 3.2% to $57.37 after forecasting first-quarter earnings of no more than 74 cents a share, below the 81 cents estimated by analysts.

Family Dollar Stores Inc. tumbled 2.3% to $60.25.

Offshore Drillers

Offshore drillers decreased after ISI Group said in a client note that deepwater rig demand is weaker than the market has anticipated. Diamond Offshore Drilling Inc. slid 4.7% to $44.22, the lowest level since 2005. Noble Corp. fell 4.9% to $28.88. Transocean Ltd. erased 3% to $39.57.

PVH Corp., which owns Calvin Klein, declined 5.6% to $115.20. The company was downgraded to market perform from outperform at Wells Fargo & Co., while Morgan Stanley lowered its rating to equalweight from overweight.

Williams-Sonoma Inc. jumped 9.8% to $64.72. The seller of cookware and home furnishings forecast same-store sales growth of 5% to 7% this year, compared with the 3.7% average analyst projection. Revenue will reach $4.63 billion to $4.71 billion, Williams-Sonoma predicted. Analysts had estimated a number at the low end of that range, data compiled by Bloomberg show.

See the original article >>

Which European Countries Will Suffer The Most If Russia Turns Off The Gas

by Tyler Durden

With the Sunday Crimean referendum seemingly unstoppable now, its outcome certain, it is set to unleash a chain of events that is not entirely predictable but is at best, ominous, as it will involve the launch of trade, economic and financial sanctions against Russia (despite China's stern disapproval), which will lead to a "symmetric" response in kind by Moscow. And in a worst case escalation scenario, should game theory completely collapse and everyone starts defecting from a cooperative equilibrium state, the first thing to go will be European gas exports from Russia, anywhere from one day to indefinitely. So which European countries are most exposed to the whims of Gazprom? The following map from the WSJ, shows just how reliant on Russian gas exports most European countries are.

One wonders just how "stern" any sanctions these countries support and enforce against Russia will truly be. Then again, as the WSJ reports, Europe somehow believes that despite its massive reliance on Ukraine for energy, it can weather a storm:

Mr. Oettinger says Europe is now in a stronger position to withstand possible disruptions in supplies, thanks in part to a mild winter, more storage capacity and pipeline infrastructure that allows more gas to flow from west to east.

But he has also said that the EU should reach out to other gas exporters and build more terminals for liquefied natural gas, and that countries should also start exploratory work on shale gas.

"The Russians are now more dependent on our money than we are on their gas," said Mr. Wieczorkiewicz, adding that around half of Russia's revenues are derived from oil and gas sales. "The EU could also explore ties to Norway, Algeria and Qatar as alternative suppliers, increase the use of coal and import LNG."

But in the short term, others argue that the EU is short of options if it wants to use energy as a tool against Moscow. "Russia remains the largest exporter of gas to the EU; there's no way of [quickly] sourcing those amounts of gas elsewhere," said Simon Pirani of the Oxford Institute for Energy Studies.

"Europe has to ask itself how important is the economic relationship with Russia, which provides that cheap energy, and how important is the political protest that it wants to make" about Crimea, he said.

So who wins in the end: the provider of the commodity, or the buyer who pays with infinitely dilutable fiat, especially if any further escalation by the west against Russia will merely bring China and Russia together even closer. Somehow we think our money is on the KGB spy instead of the clueless and insolvent European bureaucrats.

See the original article >>
German Exporters Fire Warning Shot About Russia “Sanction-Spiral,” Banks At Risk

by Wolf Richter

The “mal-calculation”

It took a while. But it had to come, the public warning shot – after what must have been a ferocious lobbying campaign behind closed doors. No one in Germany is allowed to get in the way of the sacrosanct exporters. The German economic model, to the chagrin of neighboring countries, is based on them.

It wasn’t as bombastic as US Secretary of State John Kerry’s blast to lawmakers that the Ukrainian debacle could “get ugly fast,” and “in multiple directions,” but it had the heft of the German export industry.

Anton Börner, president of the German Association of Exporters (BGA), which represents 120,000 companies, the lifeblood of the economy, warned at a press conference in Berlin that further escalation of the crisis in the Ukraine could hit exporters very hard. He said that the BGA expected exports to rise 3% to €1.13 trillion and imports 2% to €914 billion for a trade surplus of €215.6 billion – the highest in history. But “if the crisis in the Crimea escalates further,” these wondrous forecasts of endlessly growing exports and surpluses “could turn very quickly into a mal-calculation.”

The sanction spiral

Further intensification of “the most serious political crisis in Europe since the end of the war in former Yugoslavia” would degrade bilateral economic relations between the EU and Russia. He warned not to underestimate the drag of secondary and tertiary effects on the world economy. “Russia itself, Europe, Germany, and the whole world have a lot to lose,” he said. “But if there’s a sanction-spiral, Germany has the most to lose.”

About 6,200 German companies were trading with Russia or had invested there. The bilateral trade volume was over €76 billion last year. And German companies have invested €20 billion in Russia. The “sanctions-spiral” that is currently gaining momentum could have “unforeseen consequences,” especially for Russia, he said. They’d be “painful for the German economy, but life-threatening for the Russian economy.”

And there’d be a price to pay, not only of economic nature, but also of political nature, he warned.

Better than pushing someone into a corner

“We merchants are always in favor of keeping a communication channel open,” he said. Within the Western world, Germany had the best connections to Russia, politically, diplomatically, economically, and culturally. So it would have to play a decisive mediator role, Börner said. “Talking is better than pushing someone into a corner.”

Given the “inexperienced and opaque” Ukrainian government, there were additional uncertainties – another reason to deescalate the crisis. The EU would need to integrate Russia and Putin in the decision-making processes, “at eye level and as part of the solution.” Putin should be given the “widest possible understanding for his situation,” but at the same time, it should become clear that unilateral changes of international contracts and borders would “lead his country to the sidelines.”

And the banks?

It isn’t just German exporters that are fretting, and lobbying with all their might. Russia, with an economy that is already stagnating, and dogged by vicious bouts of capital flight, has$732 billion in foreign debt. Relatively little of it is sovereign debt, but nearly $700 billion is owed by banks and corporations – most of them owned or controlled by the Kremlin. Oil major Rosneft and gas mastodon Gazprom owe $90 billion combined to foreign entities; the four state banks Sberbank, VTB, VEB, and Rosselkhozbank owe $60 billion. Some of this debt matures this year and next year.

US banks are marginally involved. Between Bank of America, Citigroup, JPMorgan, and Wells Fargo, they have only $24 billion on the line. But European banks and insurance companies are up to their dirty ears in this suddenly iffy and potentially toxic Russian debt.

When it comes due, it will have to be rolled over, and some of the companies will need to borrow more, simply to stay afloat. Alas, the current sanction regime of visa bans for the elite, asset freezes, and trade restrictions could make that difficult. Then there’s the threat, now more broadly but still unofficially bandied about, that Russian companies should simply default on this $700 billion in debt in retaliation for the sanctions.

Some European banks, including some German banks, might crater. Even the possibility of a major loss would further rattle the confidence in these banks with their over-leveraged and inscrutable balance sheets and their assets that are still exuding whiffs of putrefaction. And this sort of fiasco, as the financial crisis has made clear, has an unpleasant way of snowballing – and taking down the already shaky global economy with it.

During the financial crisis, German exports collapsed, banks toppled and got bailed out, and the economy experienced its two worst quarters in the history of the Federal Republic. No politician in Germany has any appetite to re-experience that. And the banking industry, with its powerful and long tentacles winding their way through the hallways and doors of the German government, has been assiduously at work, quietly and behind the scenes, to whittle any sanctions down to irrelevance.

Washington’s defaulting on an agreement with Russia about Ukraine’s future, and the prospect of NATO troops in Ukraine, convinced Putin and much of the Russian elite that there’s no point in negotiating with the US. Big risks lie ahead.

See the original article >>
Latest data confirm China slowdown

by SoberLook.com

As a confirmation of a significant downward adjustment to China's growth (discussed here), a battery of economic reports this morning all came in materially below expectations.
1. Fixed asset investment:

Source: Investing.com

2. Industrial production:

Source: Investing.com

3. Retail sales:

Source: Investing.com

Clearly there is a seasonal component to these indicators, which may have been impacted by the New Year's holiday. But on a year-over-year basis much of that should have been reflected in the forecasts.

BW: - “The fairly dramatic slowdown is unusual in Chinese economic history of the last decade” and the figures were “shockingly weak,” said Dariusz Kowalczyk, senior economist and strategist at Credit Agricole CIB in Hong Kong. “It points to a major deceleration of momentum in the beginning of 2014,” wrote Kowalczyk in a research note.
Not surprisingly, over the past few days the equity market has been reflecting these worsening fundamentals.

Large cap PRC equities ETF (ticker: FXI) - down 6% in 5 days

See the original article >>
Latest Data Confirm China Slowdown

by AllianceBernstein

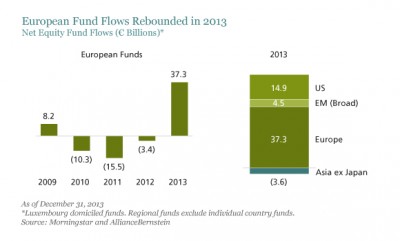
Equity investors are struggling to figure out how to approach the European enigma. It’s clear that a recovery is brewing, but there’s still too much uncertainty for comfort. In our view, distinguishing the European context from that of the US or Japan can help point the way toward unravelling the puzzle.

Investors have been rediscovering Europe. During 2013, flows to non-US regional equity funds investing in Europe turned positive for the first time since 2009, jumping to €37 billion (Display). It’s been a long time since we’ve seen such a clear preference for European equities over other regions.

Phelps_Enigma_display1

But earnings don’t seem yet to support the renewed optimism. Profit margins of European companies are still compressed. Earnings growth remains sluggish across the continent. And earnings revisions for European companies have been below those elsewhere in the world so far this year.

Is the Recovery Real?

So why are investors upbeat? Signs of a nascent recovery of economic growth are clearly part of the story, as some of the hardest-hit countries in the periphery—including Spain, Portugal and Ireland—exited recession last year. Our economists forecast euro-area growth of 1.1% in 2014.

It’s also possible that investors hope the European Central Bank (ECB) will ultimately follow the examples of the US and Japan, where extraordinary monetary policies have helped kick-start the private sector. In other words, perhaps the ECB will eventually be forced to resort to the same type of quantitative easing tactics that have fueled economic growth elsewhere in the largest developed economies.

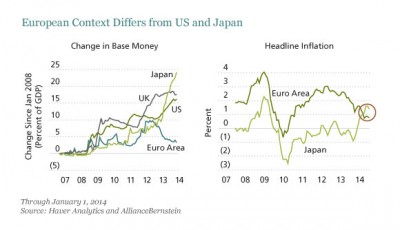
In fact, to date, the ECB has conspicuously avoided following the lead of the Fed and Bank of Japan in expanding the monetary base—despite ECB president Mario Draghi’s famous pledge to do “whatever it takes” to protect the euro (Display, left chart). As a result, inflation in the euro area has continued to decline, in contrast to Japan (Display, right chart), where the Abenomics plan has helped prompt a reversal of persistent deflation. And as long as fiscal austerity remains the norm and quantitative easing isn’t on the policy agenda, the threat of deflation will linger. None of this sounds very good for European stocks.

Phelps_Enigma_display2_d3

Finding Winners in a Complex Landscape

That view, however, depends on how you look at it. In fact, we think the current environment creates an excellent backdrop for discerning, stock-picking approaches. Relatively low levels of earnings and profit margins mean that there is ample room for European companies to improve profitability and deliver growth. But since regional conditions are so shaky, it’s vital to identify those companies with a strategic advantage, global revenue base and superior management that are capable of delivering results. This is not a case of all boats rising at the same time.

Caution is warranted. At the stock level, many European companies are vulnerable and could underperform without a supportive monetary and fiscal environment. And at the portfolio level, passive, diversified approaches offer little protection from potential bouts of weakness. Investors in European index funds may find themselves saddled with exposure to many companies that are less capable of weathering volatility and more susceptible to a potential downturn of the market.

We think global portfolios shouldn’t ignore Europe, where the recovery isn’t fully baked into stock prices, as in some other parts of the world. By using deep research to search across diverse sectors, stock pickers can find companies with better prospects for margin improvement that can do well in challenging conditions—and would be rewarded even more in a surprise acceleration of a European recovery.

See the original article >>
Coffee farmers in C America get double consolation

by Agrimoney.com

Coffee growers in Central America had the dual consolation of a downgrade to the estimate for their losses to the roya fungus, and finding that their crop has become the most expensive of the major grades too.

Promecafe, the Central American coffee organisation, has cut to 1.76m bags its forecast for the region's losses in 2013-14 to the fungus which causes coffee rust, the International Coffee Organization said.

That represents a decline of 135,000 bags on losses of 1.89m bags estimates for 2012-13.

Promecafe, which was created in 1979 to tackle disease threats to coffee output, in June last year had forecast last season's losses at 2.7m bags, and said that the 2013-14 impact could be considerably higher.

Central America produced 15.8m bags of coffee in 2011-12, the last season before rust took hold.

Diverging fortunes

The ICO also revealed that the beans produced in Central America, classified as "other milds", had become the most expensive of the major grades, overtaking values of Colombian milds for the first time in nearly nine years.

From a discount of some 13 cents a pound in February last year, other milds have taken a premium which averaged 1.47 cents a pound last month, a factor reflecting the differing production fortunes of Colombia, where trees from a replanting programme are maturing, and Central America.

And the price reversal, driven by a 31% jump to 173.64 cents a pound in the average price of other milds last month, is expected to stay, despite being historically unusual.

"Production in Colombia is expected to increase further going forward," ICO economist Thomas Copple told Agrimoney.com.

"For Central America, it looks like production is going to stay low for a while."

Too much rain, too little

The ICO remained downbeat over prospects for world output in 2013-14 despite Colombia's recovery and the lowered estimate for Central America's setback, highlighting the impact of downpours in Mexico as well as drought in Brazil.

Amecafe, Mexico's national coffee association, had signalled that output "might be significantly lower than 2012-13, as heavy rains exacerbate the spread of coffee leaf rust", the ICO said.

On Brazil, the organisation highlighted that in the south west of Brazil, the top producing state, the rainfall deficit in January and February approached 500mm, "and it is considered unlikely that there has been any comparably severe event since at least 1950".

The ICO restated a forecast that global 2014-15 coffee production "is now likely heading towards a deficit compared to demand".

See the original article >>
Cold fears for corn to fuel jump in US soy sowings

by Agrimoney.com

Allendale raised the bar on forecasts for US soybean sowings this year, pegging them at 83.2m acres, as the hangover from the unusually cold winter adding to the incentive from prices to plant the oilseed rather than corn, the main rival in spring seeding plans.

The survey results come ahead of a USDA report on prospective plantings which is one of the most keenly awaited crop briefings of the year.

Chicago-based Allendale, revealing the results of a farmer survey, said that growers intend to hike plantings of the oilseed this year to 83.2m acres, up 6.7m acres on last year, and exceeding the 2009 record of 77.45m acres too.

The figure is considerably bigger than the 79.5m acres that the US Department of Agriculture forecast last month, besides estimates from other commentators, many of whom have warned that the official forecast looks too low.

Goldman Sachs this week pegged sowings at 81.0m acres, while Informa Economics has pencilled them in at 81.3m acres, and Jefferies Bache forecast a figure of 80.5m acres.

However, Allendale highlighted the incentive to sow the oilseed being provided by the harsh winter conditions, with soybeans having a later planting window.

Agrimoney.com earlier this week highlighted the worries over seedings being prompted by low soil temperatures.

'Not confident enough on corn'

"We have some issues which are going to be impacting corn planting this year," Rich Nelson, chief strategist at Allendale, said.

"In recent months we have had quite a large snowfall this winter, which has been centred in the eastern Corn Belt, Illinois, Indiana and Ohio. Portions of those states have seen record snowfall."

"A lot of farmers suggested they simply were not confident enough to be planting corn yet.

"So for right now, they were heavily sighted towards soybeans."

Key states

Indiana is "leading the way" in this trend in the eastern Corn Belt, Mr Nelson said, also noting a retreat in North Dakota, where poor weather has prevented farmers harvesting all last year's corn yet.

"After years of North Dakota adding corn acres almost year after year, and becoming one of the players in the mix, it looks like we will now see some resistance against that idea," Mr Nelson said.

The Allendale survey showed corn planting intentions of 92.3m acres, down 3.1m acres year on year, if still the fourth largest since World War II and, again, larger than the USDA foresees.

However, the figure was below the 93.3m acres at which Informa Economics has forecast US corn seedings this year, with Goldman Sachs foreseeing a 93.5m-acre result.

Key ratio

Besides weather conditions, relative pricing of Chicago corn and soybean futures is also seen as a key influence in farmers' decision making.

Jefferies Bache said that the "indifference level" for the ratio between new November soybean futures and December corn futures appears to be at 2.2:1.

The ratio at the close of trading on Thursday was 2.44:1, implying relatively high returns from soybeans.

See the original article >>
Wheat retreats from $7, as broker cautions tell

by Agrimoney.com

Wheat futures hit $7 a bushel in Chicago only to close sharply lower, as momentum from fund buying ran into caution that fears over the Ukraine crisis, viewed at the centre of the price rises, may be being overplayed.

Chicago wheat for March hit $7.00 3/4 a bushel, the highest for a spot contract since October, before reversing to close down 1.3% at $6.79 a bushel.

Wheat for May, the best-traded contract, hit $6.96 1/2 a bushel before retreating to end at $6.73 3/4 a bushel, down 1.5% on the day.

Chicago wheat did worse, dropping 1.5% to $6.73 3/4 a bushel for May, and by 1.3% to $6.79 a bushel for the March contract.

In Paris, the May contract hit E216.00 a tonne, its best for nigh on a year, before paring gains to close down 1.0% at E213.50 a tonne.

'Political crisis'

The early gains were widely attributed to concerns over the threat of Ukraine's crisis to its grain export prospects, besides a dearth of rain for winter wheat seedlings in the US southern Plains too.

"The political crisis in Ukraine and the dryness affecting US winter wheat production is providing support," Paul Georgy at Chicago-based broker Allendale said early in the day.

However, the headway defied a series of cautions that fears over Ukraine may be overdone for now.

'Attractive opportunities to sell'

UkrAgroConsult, the Kiev-based analysis group, said that while 5-10% of Ukraine's grain exports are handled in Crimea – the region invaded by Russian troops, and at the centre of the country's political turmoil - the impact on shipments is likely to prove limited for now as most of the volumes have already been cleared.

At Commonwealth Bank of Australia, Luke Mathews said that "there is only a small probability that Russian-Ukraine tensions cause a meaningful disruption to grain trade from the Black Sea region", viewing prices as offering "attractive opportunities" for domestic producers to sell at.

"The US Department of Agriculture this week confirmed global grain supplies are currently comfortable," he added.

At FCStone's Dublin office, Jaime Nolan Miralles warned that the wheat price may be "divorcing itself from direct wheat/market fundamentals, and I would caution bulls' temperament under such an environment.

While Ukraine remains a "wild card" for the market, especially with a controversial poll on Crimean secession due this week, "if escalation is not the end result there, it is difficult to see where this short term bull run will find its next feed from".

Importers shifting?

Rabobank stuck by a "bearish outlook" for wheat prices in the second half of this year, cautioning that "favourable conditions for most of the major wheat growing regions through the Black Sea and European Union" would spur a 20m-tonne rise in world inventories of the grain – although many commentators have a more conservative estimate.

However, Commerzbank highlighted the potential for worries over Ukraine exports to drive buyers to other markets.

"Uncertainty over the availability of wheat from Ukraine points to higher demand for wheat from the EU and the US, something that is likely to be confirmed by the export figures due to be published today," the bank said.

In fact, US export sales last week fell 14% week on week to 477,000 tonnes, the US Department of Agriculture said, a figure viewed broadly as neutral.

A UK grain trader told Agrimoney.com: "The speculative money still has plenty of scope for putting more cash into the market.

"Wheat has been the one grain in which hedge funds have had a net short. They are way off any kind of net long position which might look like they had overegged the pudding."

See the original article >>
Fallen Tiger, Shaken Dragon

by Minxin Pei

CLAREMONT, CALIFORNIA – Less than 18 months after becoming General Secretary of the Chinese Communist Party, Xi Jinping is poised to cage the biggest political “tiger” – a corrupt top official – in the history of the People’s Republic. Although rumors of the imminent fall of former internal security chief Zhou Yongkang have been swirling for months, many observers remained unsure whether Xi would prosecute Zhou and thus break the party’s long-established unwritten rule of immunity for sitting or retired members of the Politburo Standing Committee.

But doubts about Zhou’s fate have now been dispelled by a recent flurry of uncensored news stories in the Chinese media that revealed shocking details of corruption involving Zhou’s family and former subordinates. One newspaper reported that the authorities recently searched the homes of Zhou’s two brothers. Though these stories have yet to implicate Zhou directly, it will be only a matter of time before the Chinese government officially charges him with corruption.

Whispered reports are even more lurid. Zhou is said to have plotted to murder his first wife, and there are rumors that at the height of last year’s scandal involving disgraced former Chongqing party boss Bo Xilai, he attempted to assassinate Xi in the leadership compound at Zhongnanhai.

Based on what the Chinese press has disclosed thus far, it is clear that the Zhou case will be the ugliest and most sensational scandal involving a senior party leader that the country has ever seen. It will make Bo, an ally of Zhou and a former Politburo member who was sentenced to life imprisonment for corruption, look like a petty thief.

Apparently, the Chinese government is meticulously building a case against Zhou by pursuing two critical leads. The first one targets his son, Zhou Bin, a businessman who has amassed a huge fortune through shady deals and possibly criminal activities.

With so many officials and private businessmen eager to curry favor with his father, Zhou Bin had no difficulty cashing in. His business activities include brokering sales of oil-field equipment to Iraq (causing huge losses for Chinese state-owned oil companies); construction of hydroelectric power stations in Sichuan (where his father was the provincial party boss from 1997 to 2002); providing information technology for 8,000 state-owned gas stations; and investments in real estate, oil exploration, and toll roads.

The most damaging revelation so far concerns Zhou Bin’s friendship with a billionaire mafia boss, Liu Han, who is now standing trial for organized crime and murder. Liu made his fortune with Zhou Bin’s help. In one case, the younger Zhou allegedly used his political connections to help Liu sell two hydroelectric power stations to a state-owned power company for a profit of ¥2.2 billion ($330 million).

The second lead centers on Zhou Yongkang’s former lieutenants. A tactic favored by Chinese anti-corruption investigators is to detain junior officials who have worked closely with their primary target. Typically, these minions are threatened with long prison sentences, or even the death penalty, unless they cooperate.

In this case, a dozen officials who worked for Zhou in the energy sector in Sichuan and in the Ministry of Public Security (where Zhou was Minister from 2003 to 2008) have been arrested. Most ominously for Zhou, the officials include two of his former executive assistants, who presumably have intimate knowledge of Zhou’s activities.

When the Chinese government formally announces Zhou’s arrest – probably after the conclusion of the annual session of the National People’s Congress in mid-March – the revelations of the rot within the Chinese party-state will stun even the most jaded observers. What Zhou, his family, and their cronies have done can be described only as insatiable looting and blatant gangsterism.

More important, the Zhou scandal will almost certainly implicate a record number of senior officials. As of now, one minister, two provincial vice governors, one vice minister, and several senior executives in state-owned oil companies have been detained. More officials are expected to fall in the coming year.

For Xi, ensnaring Zhou in his anti-corruption net will likely provide a boost in his popular standing. He can show a skeptical Chinese public that he has the political will to take down one of the country’s most powerful politicians. Moreover, vanquishing a once-untouchable politician will leave no doubt about Xi’s personal authority.

For the rest of the world, the unfolding Zhou scandal reconfirms a profoundly worrisome fact: the Middle Kingdom remains deeply corrupt. Caging a tiger will not destroy a vampire.

See the original article >>
Emerging Markets’ Bubble Troubles

by Jomo Kwame Sundaram

ROME – Some of the developing world’s larger countries, flush with capital after being recognized by investors as “emerging-market economies” (EMEs), have been pursuing policies with little regard for the lessons of the financial crises of 1997-1998 and 2008-2009. As a result, countries like India, Brazil, South Africa, and Indonesia have been hit by the US Federal Reserve’s gradual exit from so-called quantitative easing (QE) – not just capital-flow reversals, but also a sharp decline in domestic asset prices.

Various developments last year raised expectations that the Fed would begin to taper its $85 billion-per-month open-ended bond-buying program sooner rather than later. This drove up US government-bond yields, and reduced the appeal of higher-yielding EME currencies. As a result, several EME currencies, from the Indian rupee to the Turkish lira, declined sharply.

Moreover, some EMEs have experienced financial-market disruptions and slowing economic growth. Such developments often lead to perverse economic behavior, as rumors and pessimistic predictions become self-fulfilling.

Typically, after international investors “discover” an EME, it receives massive – but easily reversible – capital inflows. The influx of cash fuels domestic asset-price bubbles and booms in related sectors of the real economy, pushing up the real exchange rate and, in turn, weakening incentives for domestic producers.

This drives investors to put even more of their money in non-tradable sectors, such as construction and real estate. The growing current-account deficit is largely ignored, as long as capital inflows continue to cover it and economic growth remains strong. Short-lived market rallies make matters worse, frequently inducing further unfounded exuberance. And when officials recognize the problem, hurriedly announced policy measures, such as capital controls, are usually too little too late, and can have adverse effects in the short term.

Investors, long encouraged to take a short-term view, may be surprised by such developments. But there is little excuse for the failure of policymakers and researchers to anticipate the recent capital-flow reversal. After all, while the Fed’s tapering of QE undoubtedly has contributed to recent events, many EMEs have been in trouble for quite a while, with output growth decelerating gradually and private investment declining.

Capital-fueled economic booms do not significantly improve most people’s lives, because public expenditure on infrastructure, health care, sanitation, education, and social protection does not rise adequately to compensate for adverse consequences. These consequences include accelerating consumer-price inflation (despite slowing GDP growth) and worsening external balances as currency appreciation weakens export growth and feeds a growing appetite for imports.

Many recent EME booms have involved debt-financed consumption binges and investment sprees that relied largely on short-term capital inflows. Making matters worse, the euphoria accompanying bubbles in stock and property markets has fueled credit expansion for businesses and households, with rising private and, in some cases, public debt, as well as current-account deficits, increasingly financed by “hot money” from abroad.

Such debt-driven bubbles have long been known to be unsustainable. But those who have warned of the EMEs’ impending busts have been dismissed as “prophets of doom” who underestimate the EMEs’ potential. The marginalization of economic history in economics education is now exacting a high toll.

The facts are simple: bubbles can collapse easily and quickly, and controlling a panic is virtually impossible. Once markets turn, many of the policies – and policymakers – celebrated during the boom are recast as in a far dimmer light. Former US Federal Reserve Chairman Ben Bernanke may be blamed this time, but EME busts can easily be triggered by anything from a minor change in global conditions to an unexpected growth hiccup or domestic political instability. Even economic difficulties in a neighboring country could be sufficient to prick a bubble.

The resulting crisis, by reducing employment and incomes, stands to hurt many innocent bystanders, most of whom did not benefit significantly from the boom. This is already happening in several EMEs, just as it has occurred many times elsewhere. How many more such episodes must the world endure before they are recognized as the avoidable disasters that they are?

See the original article >>

Gold Stocks Keep Confounding Skeptics

by Pater Tenebrarum

Still a Methodical Advance

This is the second time this week we feel the urge to write about gold stocks, which may be a short term negative contrarian signal. However, we are quite pleased with the classical stair-step advance that has occurred in the sector so far this year. It lacks the extreme volatility that was on display during the previous bear market period and keeps tracing out well-established bullish patterns, which so far continue to lead to follow-through moves. Even better, in spite of the fact that the sector remains one of the best-performing market sectors this year, its rally is barely eliciting comment outside of 'gold bug' circles. In other words, it hasn't even been noticed yet, which is quite remarkable considering GDX is up over 36% since its late December low. GDXJ has surged by an even more impressive 55.5% since then.

As we have pointed out earlier this week, many of the 'old hands' in gold-bug land are cautious as well. Sooner or later there will of course be a setback correcting the advance, but the fact that it hasn't produced a great deal of enthusiasm so far strikes us as a bullish sign. On Thursday, gold stocks once again rallied to a new high for the move, breaking out of the pennant/triangle formation we discussed on Tuesday. In fact, the sector has in the meantime already moved to the next lateral resistance level. This is all the more remarkable as Thursday's move higher coincided with the DJIA shedding 230 points on the day. It seems that funds are rotating out of stock market sectors that have hitherto done well and are partly being redeployed in the gold sector -  which is traditionally negatively correlated with the broader stock market in the long term and has incidentally been among last year's biggest losers. Here is what things looked like as of Thursday's close:


HUI-SPX ratioThe HUI moves to the upside from another triangular consolidation, reaching the next zone of resistance in the process – click to enlarge.


The chart certainly looks good at this juncture. Admittedly, the biggest test is still ahead. The red dotted lines highlight the most important lateral resistance zone, including the 'gap resistance' stemming from the April 2013 gap down. This gap has stopped a number of previous rally attempts. Even if the rally  continues in the short term (which actually looks likely), one should probably expect it to at least stall out and pause for breath around these levels, this is to say, the 280-300 points area in the HUI.

Another point worth mentioning is that the advance quite clearly looks like an impulse wave by now. If one looks closely, it could well be that the second impulse wave (i.e., wave 3) of the sequence is already underway (we will take a closer look at the wave count labeling possibilities in our next update).

Along with the rise in gold stocks, the HUI-gold ratio has also risen from the grave and has just attained its best level since September. This is an important confirming indicator. Rallies in gold usually need to be accompanied by an expansion in this ratio to be validated. And yet, in spite of its recent rise, the ratio remains at what is a quite depressed level historically. In other words, there is still lots of room for further expansion in the medium to long term.


HUI-Gold ratio-Mar-13The HUI-gold ratio – looking good and meticulously respecting lateral support and resistance levels (which are changing places as the advance continues). Don't ask us why, but it obviously does – click to enlarge.


The GDM bullish percent index currently rests at the 40 level – a further improvement, but still far from what would be considered an 'overbought' condition (the index measures the percentage of stocks in the index that are currently sporting a point & figure buy signal).


BPGDMThe GDM's bullish percent index – improving, but not overbought yet – click to enlarge.


Another Look at the Sentiment Backdrop

We already discussed a number of gold and gold stock sentiment measures on Tuesday, inter alia the assets held by the Rydex precious metals fund and the percentage of all Rydex assets they currently represent. Nothing has changed on that front, so there is no point in showing that particular chart again. However, there is another feature of the Rydex precious metals fund that is worth pondering, namely the cumulative net cash flows into the fund. We would actually like to see an increase in these flows at some point, as that would confirm that confidence in the new trend is beginning to rise.

However, at this stage we are not worried yet by the fact that new inflows are so far lacking. The later they happen, the further the rally is likely to travel. Moreover, we like the contrast between today's situation and the rally in Q3 2012, when traders couldn't get their money in fast enough. That rally failed rather spectacularly as we now know, and it did so in a rather devious manner (at first it appeared as though a mere routine pullback was in the works, but then things took a sudden turn for the worse). The differences between the two periods are highlighted below:


Rydex pm cash flowsThe line at the bottom of the chart shows the cumulative net cash inflows into the Rydex precious metals fund. There is a big difference between the enthusiasm with which traders greeted the Q3 2012 advance and the indifference on display so far this year – click to enlarge.


For the moment we are interpreting the lack of inflows as a sign of indifference that is likely due to the string of previous disappointments. Recall in this context that the stock market had to rally for more than three years in a row before the public took notice and began to throw money at fund managers again. Few people want to invest in a sector that has only just started to move up after suffering grievous losses for three years in a row. And yet, it is precisely this statistic that inter alia tells us that this year should be a good one. The gold sector has never suffered a decline for three years in a row that was not followed by a sizable rally (admittedly, the current rally is already sizable, at least in percentage terms. However, one must keep in mind that it has started from an extremely low base).

Skepticism is also revealed by another batch of indicators we have occasionally discussed in the past. During the bottoming period between July and December 2013 we have pointed out that strong pessimism on precious metals was inter alia reflected by the fact that closed-end bullion funds were continually trading at historically large discounts to their net asset value. These NAV discounts continue to persist in both GTU (a gold bullion fund) and CEF (a mixed gold and silver bullion fund). The discounts have recently tightened a bit and we actually want to see them eventually disappear. However,  it is not a problem if that takes a little while. The longer the advance retains its 'stealth' characteristics, the better it probably is.


GTU-navGTU continues to trade at a fairly large discount to its NAV. However, it has recently begun to come in a bit from the extremes recorded last year- click to enlarge.


CEF-navA similar picture is presented by CEF – it is still trading at a large discount to NAV, but the discount is no longer quite as extreme as it was in Q4 of last year – click to enlarge.


Conclusion:

In summary, there is a technically quite solid looking rally underway that is so far greeted with a mixture of skepticism and indifference. That actually increases the probability that it will continue. However, it is clear that there will be a sizable setback at some point to correct the advance. The upcoming FOMC meeting could possibly provide the trigger for such a correction, as the central bank is highly likely to stick with its 'tapering' course for the moment. However, regardless of any near term gyrations that may occur, it still appears likely to us that the sector has finally turned the corner for good.


HUI-SPX ratio

The HUI-SPX ratio has turned around this year as well – click to enlarge.

See the original article >>
US Stock Market – More Bubble Evidence

by Pater Tenebrarum

A Slightly Ominous Development

Below we show a few stock market related charts that indicate that the recent rebound may well have been part and parcel of at least some sort of corrective period, in spite of several indexes attaining new highs. Note here that we don't care why the market reportedly fell on Thursday. No-one knows for sure whether the reasons cited in the financial press were really the culprit (allegedly, a worsening of the  Russian/Ukrainian situation was to blame; but very often the excuse doesn't really matter. After all, the Ukraine situation was completely ignored so far).

First, a chart of the DJIA and the SPX for comparison purposes. The interesting thing is that the two measures have diverged at the most recent peak. Note in this context that divergences in the performance of various indexes have been increasing since the beginning of the year. That is usually a negative sign.


failed retestThe DJIA turned back down before reaching a new high, contrary to the SPX, which did (most other popular indexes also reached new highs, but performance divergences have opened up further between all of them) – click to enlarge.


We realize of course that a few down days don't necessarily mean much, even if one of them was a big one. However, trading volume has declined throughout the rebound, and one could therefore interpret the action as an 'Ordian retest' (following Tim Ord's rule for retests that occur on lower volume), even though most indexes actually managed to eke out slight new highs. The fact that the DJIA did not confirm the other measures is definitely ominous. Keep in mind though that the monetary backdrop suggests that there is still enough juice out there to keep asset prices elevated. However, since it is simply not possible to tell with certainty at which point the continuing slowdown in money supply growth will actually begin to matter, one must remain alert – especially as there are many signs that we are in the middle of a veritable mania of historic proportions.

Bullish Sentiment Out of Bounds

One of these signs is evident in various permutations of Rydex fund data. As we always point out, these represent a useful microcosm of market-wide sentiment. As they represent actual positioning date, they are actually superior to surveys. Decisionpoint has its own way of representing the data, in that it inter alia constructs a ratio that compares bull and sector fund assets with the sum of bear and money market fund assets. This particular ratio is back at  levels last seen in March of 2000, something we did not expect to ever witness again. And yet, here it is (h/t to Greg Schnell from stockcharts.com, who pointed this fact out in Thursday's market message):


Rydex LT menus, stocksTo summarize this: the ratio of bull assets vs. bear + MM fund assets is back to where it was at the year 2000 peak. Both bear assets and money market fund assets are at the lowest level in 16 years. Bull assets are back at their 2007 peak. We have highlighted excessive 'hate' and 'love' with the red and blue vertical lines respectively. As you can see, it usually pays to take warnings from the Rydex data seriously. Right now market participants seem to be 'all in' and betting on further gains – click to enlarge.


The leveraged Rydex ratio (which measures the ratio of bull and bear assets deployed in leveraged funds) has experienced a blow-off move late last year that absolutely dwarfed anything that has been seen before by a huge margin (in fact, by a margin of 100%). It has since then retreated, but only to a level that is still above what used to be the historical extreme before this massive blow-off move.


leveraged RydexNever before have traders in leveraged Rydex funds been more optimistic than at year-end 2013. The current level of optimism is still way above the peaks that have been recorded in the past. As an aside, a decline in optimism from totally one-sided to slightly less totally one-sided concurrently with slightly higher prices actually represents a negative divergence – click to enlarge.


The range in which the mutual fund cash-to-assets ratio has been trapped since 2010 is the lowest in the history of the data, which have been collected since the 1950s. It was below 4% the entire time (currently at 3.6%). Note that the then record low made at the year 2000 peak was actually 4.4%. Today this would be a 'relatively high' reading. Extremes are obviously no longer what they once were.

It's a good thing that neither Mr. Bernanke nor Ms. Yellen can see any signs of a bubble anywhere, otherwise we would really have to worry by now.


mufu cash

Since 2010, the mutual fund cash-to-assets ratio has been in the lowest range ever. To some extent this could be explained by technicalities, but one should be careful with rationalizations. It definitely indicates that mutual funds represent a major source of potential selling pressure once the market turns down – click to enlarge.


Lastly, here is a look at one of the main antagonists to stocks, namely US treasury bonds. We find that the exact opposite sentiment currently reigns with respect to t- bonds. The Rydex bond ratio shows that almost 6 times as much money is currently devoted to the fund that is short t-bonds than the fund that is long t-bonds.

What is especially remarkable is that there have been huge inflows into the short fund on a very slight dip in bond prices in early March, and that they have not been reversed in the face of a once again improving bond market (on the contrary, a big chunk of money has flowed into the short fund very recently). Such stubborn bearishness in the face of a better acting market is usually a big red flag.


Rydex bond ratioThe Rydex bond ratio – 5.81 times more money is devoted to shorting bonds than to long positions in bonds. Although this ratio has seen much greater extremes in the past, this is still a level that has historically presaged bond market rallies – click to enlarge.


Conclusion:

Caveat emptor. As we always stress, the peak can by definition only occur once, so trying to forecast it is a mug's game. However, it is not a futile endeavor to try to assess the risk-reward situation. Clearly, the current situation is firmly tilted toward risk. That might change again provided a correction produces enough apprehension to quickly and appreciably alter some of the data we have discussed in recent days.

See the original article >>

Follow Us