Saturday, February 7, 2015

The Week Ahead: Will Apple or Energy Stocks Revive the Market?

by Tom Aspray

It seems certain that most investors will be glad January is over and are hoping that February will be less volatile. Many are worried that a lower close in January will mean a lower close for the stock market in 2015.

The so-called January Barometer, developed by Yale Hirsch, has an 88% chance of determining where the market will close using data since 1950. This does not include years where the market closed flat. Recently, it has not been as accurate. The S&P 500 closed January lower in 2014 (-3.43%), 2010 (-3.82%), 2009 (-8.54%), 2008 (-6.09%), and 2005 (-2.53%).

The Spyder Trust (SPY) had a positive return in each of these years except 2008. Data from Morningstar shows the following annual returns: 2014 (13.46%), 2010 (15.06%), 2009 (26.32%), and 2005 (4.83%). In every year except 2008 and 2009, the S&P 500 was also up the following February.

Click to Enlarge

However, I would not expect a return to low volatility in the near future and it could last for most of the year. The Wall Street Journal chart shows that the volatility spiked in October as crude oil started its collapse. An increase in volatility is not surprising as the prior two years had historically low volatility. So far this week, the S&P 500 has had some extreme ranges which have averaged 1.5% daily.

This earnings season has been full of both positive and negative surprises and it isn’t over yet. Several big-cap names have been hit hard as Microsoft (MSFT) will close at the lowest level in six months, while Caterpillar (CAT) made a new low for the year.

This is where the relative performance analysis can be quite helpful as I noted in my review of the big banks before they reported earnings. The analysis of the regional banks also looks negative, suggesting they will continue to be weaker than the S&P 500. The financial sector has been the poorest performer, so far, in 2015.

The stock market seemed to be more interested in the earnings from Apple, Inc. (AAPL) last week than they were about the FOMC announcement. Over the past few weeks, I had received some inquires about my technical view for Apple’s stock.

Following Comments Unfollow Comments

Click to Enlarge

Therefore, in Tuesday’s column Buy Apple on an Earning’s Miss, I looked at the monthly, weekly, daily, and intraday charts. On all time frames, the technical studies indicated that AAPL had completed its correction from the November high. The weekly chart shows the break of the downtrend, line a, on January 23.

The weekly relative performance had also turned higher and moved back above its WMA and the recent high. The OBV multiple time frame analysis was also positive, consistent with the end of its pullback. It should close the week at another new high.

With the stock’s close Monday at $113.10, a pullback was required to set up a favorable entry price and keep the risk in the 5% area. At the time, I thought it would take an earnings miss to drop the stock to the recommended buying levels. Instead, the stock was hit hard along with the rest of the market, closing before the earnings at $109.03. It is trading at $119.50 early Friday afternoon.

As always, my article elicited a host of comments from people who thought I either was predicting lower earnings, hoping to drive the stock down for my own benefit, or just was not familiar with the company at all. As a technical analyst, I never predict earnings.

Though I do not currently own an Apple computer, I started doing technical analysis on a series of three networked Apple II computers thirty-three years ago and I have followed the company every since. I do not own any Apple stock except in a mutual fund and do not recommend stocks that I own. I certainly was not short the stock, given the positive technical readings.

This news was followed by very surprising earnings from Amazon on Thursday as they actually reported a profit. The stock is up over 13% in early trading on Friday. There were some casualties as Qualcomm (QCOM) dropped 11% last Thursday on disappointing earnings and the apparent loss of some chip business with Samsung.

So, can Apple and the technology sector take the market out of its trading range and provide the fuel for another push to the upside?

Following Comments Unfollow Comments

Click to Enlarge

The monthly chart of the Dow Jones Technology Index (DJUSTC) made a slightly higher high in December before closing lower. It is also set to close down over 3% in January. The sector was hit hard in October as the long-term support, line a, was tested. This month’s low took the index back to where it closed in October.

The monthly relative performance broke its downtrend, line c, at the start of 2014. It is still well above its rising WMA but below the 2012 high. The monthly OBV has turned lower but did make a new high in November.

The weekly studies (not shown) are slightly negative and a weekly close under 1012 would signal a deeper correction. The index needs a close back above 1045 to complete the recent sideways pattern on the daily chart.

Though there are plenty of companies still to report, from a technical perspective, I can’t count on technology to turn the market higher right now. Actually, I think the energy sector has a better chance as many of the large oil companies have held up pretty well after their earnings were released. It may be that their weak earnings and spending cuts are already factored into their stock prices.

Click to Enlarge

The energy sector and crude oil prices do have a seasonal tendency to bottom in February. The seasonal chart of crude oil shows a typical peak in July, line 1, which is followed by a decline into December.

Historically, the final low comes in early February as indicated by line 2. Though crude was down a bit last week, the March contract will form a weekly doji. Therefore, a close this week above $46.55 would trigger a HCD buy signal.

Higher crude would help calm the increased fears of deflation as the EuroZone reported a drop of 0.6% in the year through January. This will help the ECB sell its quantitative easing plan.

It is also thought that the lower crude oil prices will stimulate buying in other areas. In fact, Spain’s economy is showing the strongest growth in seven years. I continue to expect that the EuroZone economy will surprise many by the end of the year.

The very weak Durable Goods report last Tuesday helped increase the selling in an already weak stock market. The media ignored the sharp rise in Consumer Confidence to 102.6, which was the highest reading since 2007. I had thought last week that it would get above 100 soon but not that fast.

Click to Enlarge

The New Home Sales also beat expectations, while the Pending Home Sales were weaker than expected as they declined 3.7% in December. Last Friday’s GDP report disappointed economists as it reflected a growth rate of just 2.6%. Most were expecting GDP to grow 3.2%. Much of the gain was a result of consumer spending, but it did reverse the positive trend of the past two quarters.

The Chicago PMI came in stronger than expected on Friday while the University of Michigan’s Consumer Sentiment reading of 98.1 held on to the strong mid-month reading.

This week, the focus will be on manufacturing and jobs. On Monday, we get the PMI Manufacturing Index, ISM Manufacturing Index, and Construction Spending. This is followed on Tuesday by Factory Orders.

Along with the ADP Employment report on Wednesday, we also get the ISM Non-Manufacturing Index with the monthly jobs report on Friday.

What to Watch

The stock market tried to rebound several times on Friday but the sellers took over in late trading to close the major averages near the day’s lows. Therefore, some of the key ETFs may close the week below their quarterly pivot levels (see Pivot Table here). This will be updated in Monday’s column.

The failure of the market to respond more positively from the prior week’s upside reversal is a concern. In last Friday’s column Any Warnings from the Monthly Charts?, I took a detailed look at the monthly charts of the NYSE Composite, Spyder Trust (SPY), PowerShares QQQ Trust (QQQ), and the iShares Russell 2000 (IWM).

The monthly indicators typically warn of more significant corrections like we saw in 2011. As I noted last week, a strong close was needed to turn the weekly studies higher. The weekly studies on all the averages except the NYSE Composite have deteriorated further.

A break of the widely watched 1990 level in S&P 500 is likely to trigger heavier selling. If we do see such a further downside break this week, we are still likely to see a snap back rally that will allow us to adjust our strategy. In light of the detailed analysis of the monthly charts, I will focus today on the weekly charts of two key market tracking ETFs.

The daily studies are close to generating additional sell signals and may do so today once the final numbers are in. Some stocks, like those recommended in Three Market Leading Healthcare Picks, are likely to hold up better than the major averages.

The sentiment picture also reversed last week as the bullish % from AAII rose from 37.14% to 44.17%. More importantly, the bearish % dropped sharply from 30.79% to 22.39%.

Click to Enlarge

The 5-day MA of the % of S&P 500 stocks above their 50-day MAs turned down last week as it closed at 47.97%, which is one standard deviation below the mean of 65.01%. This suggests that it could drop below the January 20 low of 41.36% before the correction is over.

The weekly chart of the NYSE Composite shows that it looks ready to close below the 20-week EMA at 10,770 but may finish above the quarterly pivot at 10,597. These levels can be a valuable way to navigate volatile markets.

There is further weekly support from early January in the 10,440 area, line a. This also corresponds to the monthly projected pivot support for February. The weekly starc- band is at 10,216.

Click to Enlarge

The weekly NYSE Advance/Decline will turn down this week but is still close to an all time high. It would take a week or more before it breaks decisively below its still rising WMA. There is more important support at line b. The daily A/D line is still holding above its WMA.

The weekly on-balance volume (OBV) has deteriorated in the past week as it has dropped back below its WMA, which has now flattened out.

A daily close back above the 10,870 level would be positive.

S&P 500
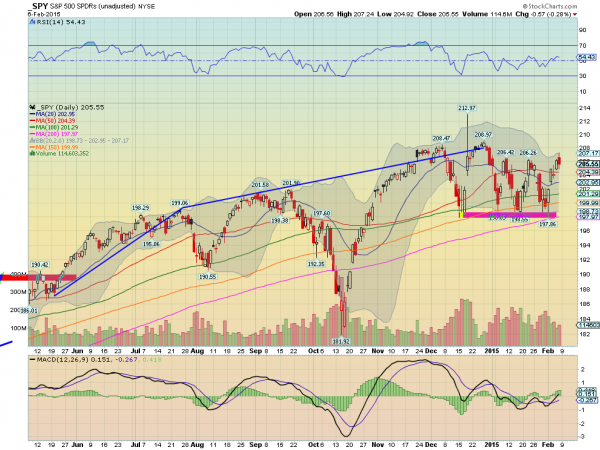
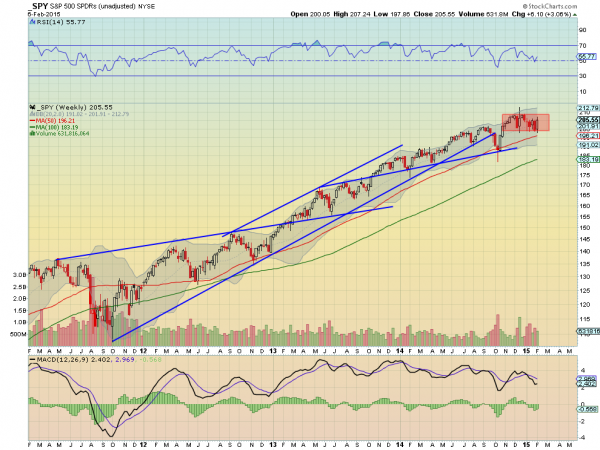
The weekly Spyder Trust (SPY) has been in a tight range over the past four weeks, despite the wide daily swings. In afternoon trading, it is still above the quarterly pivot at $199.42. The starc- band is at $196.76 with further support in the $194 area.

Click to Enlarge

A daily close above $206.50 would be an important sign that the market is ready to move to new highs. The weekly starc- band is now at $215.74.

The SPY moved above and below the slightly rising 20-week EMA at $202.97 quite a few times last week.

The weekly S&P 500 A/D line made a new high at the end of 2014 and is holding just slightly above its WMA. The daily A/D line (not shown) is still holding above its recent lows but is slightly below its WMA.

The weekly on-balance volume (OBV) looks ready to close the week below the previous low and its WMA, which is a bearish sign. It is still well above the long-term support at line c. The daily OBV is just below its declining WMA.
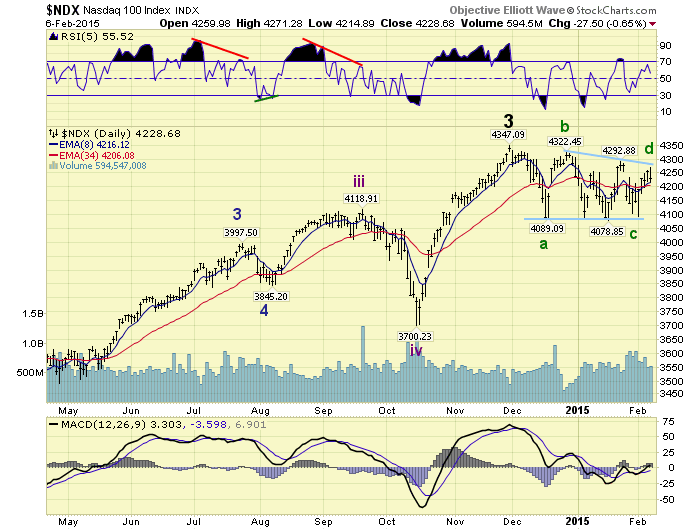
Nasdaq 100
The PowerShares QQQ Trust (QQQ) continues to hold above the quarterly pivot at $99.67, which also corresponds to the four week lows. The weekly starc- band is at $96.59 with the weekly support at $94, line d.

The Nasdaq 100 A/D line made twin peaks in December and is likely to close just below its WMA. It is also quite close to the longer-term uptrend, line e. There is more important support now at the October lows. The daily A/D line formed higher lows last week, but closed below its WMA.

The weekly OBV dropped below its WMA in the first full week of January and has now moved below the prior low. It is therefore now in a short-term downtrend. With the higher close on Friday, the daily OBV (not shown) is back above its WMA.

There is minor resistance now at $103.18 with more important at $104.58. A daily close above this level is needed to shift the short-term momentum to the upside. There is additional resistance in the $105.25-$105.86, which is the upper boundary of the recent trading range.

See the original article >>

SPY Trends February 7, 2015

by Greg Harmon

Last week’s review of the macro market indicators suggested, heading into February the equity markets looked biased to the downside to start the month. Elsewhere looked for Gold ($GLD) to continue to consolidate in the short term uptrend while Crude Oil ($USO) was ready for a bounce or reversal in the downtrend. The US Dollar Index ($UUP) seemed ready to consolidate sideways in the uptrend while US Treasuries ($TLT) continued to be biased higher.

The Shanghai Composite ($ASHR) was also consolidating in its uptrend while Emerging Markets ($EEM) looked to have failed in their attempt to rally and were biased to the downside. Volatility ($VXX) looked to remain low but drifting up easing the wind behind the equity markets to a light breeze. The equity index ETF’s $SPY, $IWM and $QQQ, all saw risk to the downside in both the daily and weekly charts with the QQQ the strongest on the longer timeframe followed by the IWM and then the SPY, but the IWM possibly a bit stronger on the short timeframe over both the QQQ and SPY.

The week played out with Gold drifting lower in consolidation before falling to end the week while Crude Oil started higher. The US Dollar consolidated all week in a slight downward path while Treasuries pulled back all week from the new high. The Shanghai Composite continued to pullback from the highs, consolidating the big move, while Emerging Markets tried to rally again and failed. Volatility pulled back from the high but remained above the range of move of 2014. The Equity Index ETF’s all bottomed on Monday and moved higher the rest of the week with the SPY and IWM making higher highs but the QQQ lagging. What does this mean for the coming week? Lets look at some charts.

SPY Daily, $SPY
spy d

The SPY started the week making a marginal new low Monday. At that point a series of two lower highs and two lower lows. A downtrend despite the consolidating look. But that did not even last until the afternoon as it started higher. The next 3 days continued higher and ended by making the first new marginal higher high of the year. Downtrend over? Friday messed that up again moving higher to start but reversing to close down on the day. A good week over all. The RSI on the daily chart shows another leveling just over the mid line, neither bullish or bearish, while the MACD is starting to drive higher. A continuation and follow by the RSI could turn the market higher.

SPY Weekly, $SPY
spy w

The weekly chart shows the consolidation range continuing for the 14th week between 200 and 209. The positives are that the RSI has held over the mid line the entire time as it pulled back, in the bullish zone, and the MACD may be turning back towards a bullish cross. The 50 week SMA is still below and a touch there has been what it has taken to trigger a move higher. There is resistance at 206.40 and 209 before a Measured Move higher to 225. Support lower comes at 204.30 and 202.30 before 200 and 198.60. Continued Consolidation in the Uptrend.

Heading into next week the equity markets are coming off of a good rebound higher but showed signs of exhaustion Friday. Elsewhere Gold looks to continue to pullback while Crude Oil tries to move higher off of a bottom. The US Dollar Index may continue to consolidate the rise, pulling back mildly, while US Treasuries are biased lower in their uptrend. The Shanghai Composite looks to continue its pullback from a major run higher and Emerging Markets continue to consolidate in a bear flag in their downtrend.

Volatility looks to remain low but slowly rising slowing the wind be=hind equities to move higher. The equity index ETF’s SPY, IWM and QQQ, are all in a consolidation pattern in the intermediate term, despite the moves higher last week. The IWM looks the strongest and may test the all-time highs this coming week while the SPY is close behind but the QQQ a bit weaker. Use this information as you prepare for the coming week and trad’em well.

See the original article >>

Weekend update

by Tony Caldaro

REVIEW

February kicks off with a strong week. The market started the week at SPX 1995. Despite a gap up opening on Monday the market quickly dropped to SPX 1981 in the first half hour of trading. That was the low for the week. After a choppy beginning off that low, the market rallied to SPX 2072 by Friday with only two sizeable pullbacks along the way. Then, late afternoon Friday, it had its biggest pullback since that low. For the week the SPX/DOW gained 3.40%, the NDX/NAZ gained 2.15%, and the DJ World index gained 2.30%. On the economic front negative reports outpaced positive reports. On the uptick: personal income, construction spending, consumer credit, auto sales, ISM services, monthly payrolls and the WLEI. On the downtick: personal spending, ISM manufacturing, factory orders, the ADP, the MMIS, the monetary base, plus weekly jobless claims and the trade deficit increased. Next week’s reports are highlighted by Retail sales, Export/Import prices and Business inventories.

LONG TERM: bull market

We continue to label this market as a Cycle [1] five Primary wave bull market. Primary waves I and II completed in 2011, and Primary wave III appears to be still underway. Primary I divided into five Major waves with a subdividing Major 1, and simple Major waves 3 and 5. Primary III appears to be following an alternate path. Thus far it has a simple Major wave 1, and a very extended/subdividing Major wave 3. Should our count be correct: Major wave 3 completed in early-December, Major wave 4 may have just completed in early-February, and a potential subdividing Major wave 5 has just begun.

SPXweekly

We had noted last week that our long term indicators were not displaying any signs of a Primary III high as of yet. But we have been offering that 20% probability count on the DOW charts. Should Primary III continue to extend, a 70% probability, we could see it continue until mid-2016. Then a quite steep Primary IV should follow, before the market launches Primary V to new highs some time in 2017. This is the potential scenario we have been considering since the fall of 2014. However, we are still awaiting new all time highs in 2015 before making any price projections going forward.

MEDIUM TERM: uptrend

After hitting an all time high in late-December, the market went into a choppy sideways correction in January. Since that uptrend did not take much more than just one week, and the NDX failed to confirm an uptrend, we labeled that high an Int. wave b of a larger Major wave 4 correction. This suggests the SPX 2079 high in early-December would be considered the Major wave 3 high. Then the SPX 1973 low in mid-December Int. wave a, the SPX 2094 high in late-December Int. b, and the recent SPX 1981 low Int. wave c.

SPXdaily

This count would suggest Major wave 4 ended with an irregular failed flat in the SPX/NAZ, and just an irregular flat in the DOW/NDX since they both made lower lows. Under this scenario the rally that started this week would be the beginning of Major wave 5. There is also another possibility. Major wave 4 could be forming a triangle. Under this scenario the waves remain the same, but the current rally is Int. wave d, and the market should soon decline to complete Int. wave e ending the triangle around SPX 2000. This is illustrated below in the NDX chart.

NDXdaily

Fortunately we can put some probabilities on these two scenarios as well. This week the market generated a WROC signal. This signal usually precedes an uptrend confirmation. Over the past 50+ years its success rate has been 96%. While we are still awaiting the uptrend confirmation we can also place a probability on whether or not it will be a D wave. Historically this has only occurred 11% of the time. Therefore the WROC suggests the market has a 96% probability of being in an uptrend, and the uptrend only has an 11% probability of being a D wave of a triangular Major wave 4. Medium term support is at the 2019 and 1973 pivots, with resistance at the 2070 and 2085 pivots.

SHORT TERM

If we go with the most probable count: Major wave 4 ended in an irregular failed complex flat at SPX 1981 on Monday. We can then start to track this potential uptrend as a impulse wave starting, probably, Int. wave i of Major wave 5. The first thing we were looking for this week was a five wave advance off the low. This would suggest the market is impulsing rather than just rallying in a corrective wave. We did observe five waves up from SPX 1981: 2010-1991-2040-2028-2050.

SPXhourly

The next thing we were looking for, on a larger time frame, is of course five waves again. Thus far we have seen four waves: 2010-1991-2072-2050. To get the fifth wave the should now rally to SPX 2072 or higher, and then have a larger pullback. Should this occur we would label it Minor wave 1 of an Intermediate wave i uptrend. This would also fit with the hourly chart posted above. Should the market fail to reach, or exceed, SPX 2072 during the next rally, then it may still be a wave d despite the probabilities. However, the probabilities do favor an impulsive uptrend underway with new all time highs soon. Short term support is at SPX 2037 and SPX 2028, with resistance at the 2070 and 2085 pivots. Short term momentum ended the week oversold after hitting extremely overbought on Friday.

See the original article >>

Tell Tale Signs of a Correction

by Tom Aspray

The rough stock market performance in January 2015 increased the bearish sentiment, and while some are warning of a severe 15% or more correction, others think we are already headed for a bear market. The very weak close on Friday, January 30 did not help as many bulls were holding their breath before the following Sunday’s opening in the futures. The fear was alleviated somewhat by the strong stock market performance in early February.

So what can you do to be prepared in advance for a sharp double digit correction? These are often panic attacks where investors and traders become skeptical that earnings will justify the current stock price levels. That does fit with the current fundamental outlook as many are nervous about what long-term impact the strong dollar and lower crude oil prices will have on earnings.

Some technical analysts will warn of a correction because of low volume or divergences in some of the well known momentum studies like the RSI, MACD, or the stochastics. Others who have been negative on the market as it has continued to move higher will issue warnings based on their own unique or proprietary technical methods.

The standard definition of a correction is a decline of less than 20%, while a decline of over 20% is used by many to signal that we are in a bear market. I have never liked that definition as the financial media often uses it to scare the average investor out of stocks just before the correction is over. Most true bear markets last significantly longer than corrections and take prices much lower.

Since the 1980s, my favorite indicator for identifying a market correction in advance is the NYSE Advance/Decline line. Since ETFs were introduced, I have used the signals from the NYSE A/D line to trade widely followed ETFs like the Spyder Trust (SPY) as well as inverse ETFs like the ProShares UltraShort S&P 500 (SDS).

In early 2009, the advance decline data also became available on the S&P 500, Nasdaq 100, Dow Industrials, and Russell 2000. I follow these A/D lines also since they can give you valuable insight on what market segments are leading or lagging the markets. For example, the Russell 2000 A/D topped out in July 2014 warning of the weakness in the small-cap stocks.

Without more historical data on these A/D lines, I rely on the many years of experience I have in successfully using the NYSE A/D line to gauge the market’s overall trend . Over the years, some have questioned the use of the NYSE since it contains a large number of interest rate sensitive issues. This has always been part of its makeup, but that has not kept it from being accurate in the past.

In this week’s trading lesson, I will focus on several very sharp market corrections that have occurred over the past thirty years. This, I hope, will allow you to identify future corrections in advance. I believe it will also illustrate that the warning signs of a correction take time to develop so that you will be less apt to react emotionally to a sudden correction or bear market headline.

One of the sharpest and most often discussed market corrections occurred in the fall of 1987. Some view this as a bear market since the S&P 500 dropped 33.5% in just 99 days, but the long-term charts now make a strong case that this was just a correction in the bull market that began in 1982.

Click to Enlarge

The weekly chart of the S&P 500 and the weekly NYSE Advance/Decline line reveals that the A/D line peaked on March 20, 1987. The S&P 500 peaked four weeks later and then corrected 9% over the next month. The S&P 500 dropped below its rising 20-week EMA several times but did not close below it.

Eight weeks after it peaked, the A/D line moved back above its WMA, and by June 19, the S&P had also exceeded the April highs. The rally continued for the next two months as the S&P 500 made a new high the week of August 28 before closing the week lower. This new high was 11.2% above the April high.

The A/D line had formed a much lower high as indicated by line b. This negative divergence is evident by comparing the slopes of lines a and b. The divergence took 20 weeks to form, and as I have mentioned previously, the length of the divergence can provide valuable clues as to how severe the correction may be.

In September 1987, the A/D line dropped below its WMA one week after the S&P made its high. The S&P reached its 20-week EMA before it bounced for two weeks, point 1, before it, again, turned lower. This was typical of a failing rally as they often just last two bars when they are going against the trend. The A/D line was very weak on the rally as it stayed well below its declining WMA, point 2.

The A/D line violated its support (line c) the week before the market really crashed as it lost 30% in the following two weeks. This is probably the most extreme example of why serious students of the market need to develop a regular schedule of market analysis, especially when they are seeing significant divergences in the A/D line.

Click to Enlarge

Now let’s look at the daily chart for the same time frame to see how its signals can be combined with the weekly analysis. The daily A/D line peaked at the end of March and formed a short-term negative divergence at the April 7 high, point 1, as the A/D line was barely able to move above its WMA. This short-term bearish divergence resistance was not overcome until early June (point 2) when the A/D line began a new uptrend.

The A/D line was clearly in a short-term uptrend by the end of June, but was still well below the March highs. The short-term uptrend in the A/D line, along with its WMA, were both broken in late August as the A/D line had stalled below the March highs, line b.

In the nine days after the high on August 25, the S&P 500 lost 8.6%, and more importantly, the A/D line dropped below the July low (point 4), which was a sign of weakness.

From a low of 308.56 the S&P rallied back to 328.94 on October 2. The A/D line just barely made it above its WMA on this rally (point 5) and still showed a clear pattern of lower highs and lower lows. This was a classic example of a failing rally.

On Tuesday, October 6, the S&P 500 closed at 319.22 and the A/D line dropped below its WMA. Just two days later, the A/D line had dropped below its previous low, which was a definitely a sign of weakness. This was two days before Black Monday collapse.

Click to Enlarge

The next correction I would like to examine is the 19.9% decline than occurred in 1990, which lasted 85 days. The weekly A/D line was positive at the start of 1989 as it moved above its downtrend and its WMA (see arrow).

The weekly A/D made a series of higher highs before it peaked on September 1, 1989. Just four weeks later, it made a lower high (see arrow) while the S&P 500 was clearly higher.

Drawing a line through these lower highs, line c, allows one to monitor what I call the bearish divergence resistance. As I have noted frequently in my daily columns, a break through these resistance levels can generate new buy signals.

The following week, the A/D line dropped below both its uptrend, line b, and its WMA. For the next eight months, the A/D line stayed below its declining WMA. It did rally back to its WMA in January 1990 but soon resumed its downtrend. By February of 1990, the S&P 500 had already dropped 11%.

By early May, the S&P 500 was in a short-term uptrend (blue line), and by early June, the A/D line was finally able to move back above its WMA but did not break its downtrend. As the S&P was forming higher lows between February and April, the A/D line was forming lower lows, line d. This warned that the rally was weak as fewer stocks were pushing prices higher.

The weekly A/D just reached its downtrend, line c, from the prior year’s highs on July 13. This completed a more pronounced forty-five week negative divergence, and the following week, the A/D line dropped back below its WMA, line 1. In the twelve weeks after the S&P 500 made its high, it declined 20.3%.

Click to Enlarge

As is sometimes the case, the daily A/D line peaked on August 8, 1989 (point 1), almost a month ahead of the weekly A/D line. It formed a lower high in early September (point 2) and then tested its uptrend, line a. The A/D line was significantly lower on October 10 (point 3) even though the S&P 500 was 3% higher than it was in August. The support in the A/D line that went back to December 1988, line a, was convincingly broken in October. This confirmed the divergence at point 2.

The S&P 500 made a marginal new high in January 1990 (point 3) as the daily A/D line just reached (point 3) its bearish divergence resistance at line b. The daily A/D line had dropped sharply by the end of January, confirming a new downtrend. The A/D line made further new lows in April, before it rose back above its WMA in early May.

In early June, the S&P 500 hit a high of 368.78-which was well above the January high of 360.59-but the A/D line had failed to move above the bearish divergence resistance at line b.

In July, the S&P 500 made another new high, but the A/D line failed to surpass its June high. Eight days after the S&P high, the A/D line dropped below the June lows, line d, which confirmed that the correction was underway.

See the original article >>

Greece Exposes The Global Economy's Achilles Heel

by Chris Martenson

The new Greek political party, known as Syriza, the Coalition of the Radical Left, has done the unthinkable: they've dared to speak the truth.

In this case, the truth is perfectly captured by the blunt assessment by the new Greek finance minister, Yanis Varoufakis, who recently declared "I'm the finance minister of a bankrupt country."

Such honest assessments are not supposed to be uttered in politics, no matter how true they may be. And so, as you can imagine, the machinery of the defenders of the status quo is in quite a lather over the whole affair. And it's doing everything it can to minimize and marginalize the new Greek government.

One editorial in the Financial Times summed up the establishment view quite well, I thought, putting its contempt for those who dare to simply state what is true right on the table:

Athens plots a daring escape from the troika

Feb 2, 2015

Syriza is as radical as any party to take power within the eurozone. Hardly any of Greece’s new cabinet have experience of government; predictably, its first week was studded with chaotic interventions, including a clumsy blunder into EU-Russian relations. Syriza’s rhetoric is still more suited to a university seminar than a serious programme of government.


To summarize, the European establishment considers Syriza to consist of radicals with no experience in government who are acting chaotically as they blunder about brandishing immature rhetoric more suited to young students than the serious business of governing.

And that was just the opening paragraph.

As I said, the new Greece administration has got the powers that be in quite a lather. Why is that?

I think it's because the new Greek rulers have dared to call a spade a spade. They've spoken the unspeakable. They've said that the vast quantities of debt accumulated by Greece, enabled by central bank money-printing programs, are simply unpayable under current terms.

Of course, this is no different than the situations of Italy, Portugal, Ireland, Spain, the UK, France, Japan -- or even the US -- which is precisely why it's being considered such a horrendous foul for Greece to publicly speak as it is now. Such honesty does not have a welcome place in modern politics, and more dangerously, it threatens confidence in the entire system.

Who Is Syriza Exactly & Why Are They In Power?

Since the Syriza party is causing such a stir, I suppose we should take a closer look, especially since so many other 'anti-austerity' groups exist in Europe that might become emboldened and try a similar path.

In Wikipedia we find this description:

The coalition originally comprised a broad array of groups (thirteen in total) and independent politicians, including social democrats, democratic socialists, left-wing populist and green left groups, as well as Maoist,Trotskyist, eurocommunist but also eurosceptic components. Additionally, despite its secular ideology, many members are Christians who, like their atheistic fellow members, are opposed to the privileges of the state-sponsored Orthodox Church of Greece.

In 2012 Syriza became the second largest party in the Greek parliament and the main opposition party. It came in first in the 2014 European Parliament election. In mid-2014, polls showed it had become the country's most popular party. In 2015, in the snap polls held on 25 January, Syriza defeated the ruling coalition and went on to become the winning coalition getting 36.3% of the popular vote and 149 out of 300 seats in the Hellenic Parliament.

Syriza has been characterized as an anti-establishment party, whose success has sent "shock-waves across the EU". Although it has abandoned its old identity, that of a hard-left protest voice, becoming more populist in character, and stating that it will not abandon the eurozone, its leader Alexis Tsipras has declared that the "euro is not my fetish".

The party has grown in power over the same time frame that the people of Greece have been living under what most consider to be punishing austerity.

Under the austerity conditions imposed by the European bureaucrats upon the Greek nation, suicides have risen by 35%,  unemployment is nearly 30% overall -- nearly 60% for those under the age of 25, having fully doubled from 2010 levels -- while wages have fallen by nearly  40%.

Note that the rise of Syriza aligns very well with the decline of employment and wages:

These are quite understandable reasons for the rise of a party touting a plan to end the pain. Whether they can deliver on that plan is another matter.

The attempts to malign and bully the Syriza politicians into conformance with standard EU practices is likely to fail. The Syriza politicians have a mandate from the people that will not last if they kowtow to the standard 'kick the can down the road and follow orders' crowd from Brussels.

The basic problem for the EU political leadership is that the Syriza party is made up of people who came from the outside, consider themselves outsiders, and have no instinctive desire to please existing institutions or lobbyists. They simply aren't playing the game as it's "supposed" to be played.

Weeks Away From Running Out Of Money

The clock is ticking...Greece is possibly only weeks away from running out of money. So the situation is quite serious:

Greece may be ‘weeks’ away from running out of money

Feb 3, 2015

Carl Weinberg, chief economist at High Frequency Economics in Valhalla, N.Y., reminded clients in a recent note that Greece’s debt schedule eventually leads to a scenario that ends in a government shutdown and/or default, possibly within a matter of weeks.

“Greece will end up with a default, possibly in the form of a restructuring with a sizable haircut, but possibly in the shape of an outright default,” Weinberg wrote. “The only question is how soon. To believe otherwise cannot possibly be more than wishful thinking.”

Pinning down the exact date when the government would run out of cash under current circumstances is difficult due to a lack of daily data on its exact cash position. But Weinberg says that, unofficially, the government was down to 2 billion euros ($2.3 billion) in mid-January.

In order to finance all the repayments, Greece would have to roll over the outstanding T-bills, run a balanced budget on at least a cash basis, and sell €27.6 billion in new bonds, Weinberg says.


With just a couple of billion euros in the coffers, the Greek government has almost no breathing room. It did hold an auction to roll over some of its debt on Feb 3rd, but the bids were very small, and only 625M euros of T-Bills (very short term paper) were bought at the offered rate of 2.75%.   

That was barely two-thirds of what was needed to service the upcoming T-Bills maturing on Feb 6th, which total 947M euros. And then on Feb 13th, another 1,400 M euros of T-Bills will mature. And so on throughout the coming weeks and months.

At this rate, the 2 billion euros on hand will not last long. Without some sort of relief, Greece will enter default, triggering all sorts of fun for the holders of its debt and any unfortunate parties that waded back into the pool to sell credit default swaps for Greek debt (and some did).

The only logical thing for anyone in Greece to do is to remove their deposits from Greek banks and place them somewhere safer, like in a non-Greek bank (or even under the mattress).

Many are finally now doing that. Though given the obvious warning signs over the past few years, it's a mystery to me why they've waited this long:

The ECB has just recently upped the pressure by removing a waiver that allowed Greek banks to post Greek sovereign debt as collateral for euro liquidity (are you watching Spain?). Essentially, this means that the Greek bonds the banks were holding as an 'asset' have just become a non-asset as far as the ECB is concerned.

The next step in this crisis is for capital controls to be imposed, to prevent further hemorrhaging of deposits from Greek banks in order to preserve the banks and prevent their utter collapse.

Despite all of this pressure and the inability of the Greek government to fund itself, it seems that the Syriza party is sticking to its course:

Greece Sticks to Anti-Austerity Demands Following ECB Loan Cut

Feb 4, 2015

(Bloomberg) -- Greece held fast to demands to roll back austerity as the European Central Bank turned up the heat before Finance Minister Yanis Varoufakis met one of his main antagonists, German counterpart Wolfgang Schaeuble.

The encounter at 12:30 p.m. in Berlin came hours after Greece lost a critical funding artery when the ECB restricted loans to its financial system. That raised pressure on the 10-day-old government to yield to German-led austerity demands to stay in the euro zone. Shares of Greek banks plummeted.

The government “remains unwavering in the goals of its social salvation program, approved by the vote of the Greek people,” according to a Finance Ministry statement issued overnight. Its aim is “coming up with a European policy that will definitively put an end to the now self-perpetuating crisis of the Greek social economy.”


So an intense game of chicken is playing out before our eyes. Neither side seems willing to bend. On the one side, you have Greece being led by people who know that the current path being demanded by the EU leads to many years, perhaps decades, of punishing depression for the people of Greece.  On the other side is the EU, which worries that if Greece "gets away" with debt restructuring, other weak countries in the Eurozone will want to as well.

"Fire!"

There's no easy path for Greece and the new Syriza administration appears to know this. That's why they're seeking to chart a different course. This upsets the lumbering bureaucracy of the EU ,which has shown a remarkable inability to admit that its prior policies were the wrong ones and have obviously failed.

While Greece is a tiny spec of the EU economy (~1%), the fact that the truth is finally being spoken about its broken finances is a very dangerous match to light at this time. Why? Because most of Europe shares the same unworkable math as Greece. Everybody in power fears what would happen if the entire pile of unpayable claims were to suddenly vaporize.

It's kind of like being in a crowded movie theater when a fire breaks out. The first few people to catch on leave somewhat calmly, as most watch from their seats.  But once it becomes 'socially acceptable' to leave, there's a mad scramble for the exits and pandemonium ensues.

So I can understand the desire of the EU officials to avoid such a panic. But at the same time, their absolute inability to acknowledge the billowing smoke is a very harmful form of denial.

With Syriza shouting "fire!", the EU bureaucracy is predictably seeking to cast the current Greek leadership as illogical, whack-a-doodle pranksters in the hopes that nobody takes them seriously.

Oops. Too late:

In Madrid, 100,000 flock to anti-austerity Podemos rally

Jan 31, 2015

Madrid (AFP) - At least 100,000 people poured into the streets of Madrid on Saturday in a huge show of support for Spain's new anti-austerity party Podemos, riding a wave of popularity after the election success of its Greek hard-left ally Syriza.

A sea of demonstrators chanted "Yes we can!" and carried signs reading "The change is now" as they made their way from Madrid city hall to the central Puerta del Sol square in the first major march called by Podemos, which has surged ahead in opinion polls in a crucial election year.


So the current high stakes are quickly getting higher.

The sad part of this tale is that the time to have begun to deal with structurally-unsound levels of debt was many years ago, even before the crisis hit in 2008. But even sadder, that crisis was the fire alarm that should have been heeded. But it was completely ignored by the political and banking establishments in the developed world, who instead opted to pour more money and more debt into the financial system rather than face up to the simple truth that Too Much Debt is a very bad central operating principle.

Greece has merely exposed the fatal flaw of the modern economy, it's Achilles Heel (to stay with the Greek motif), which is that, by definition, a system suffering from Too Much Debt cannot pay it back.  The only meaningful question to address at this stage is: Who is going to eat the losses?

The banks would like that to be the citizens of Greece, and the citizens would prefer it to be the other way around.  This is the drama that is now playing out.

So Why Should You Care?

If you're living in Greece, obviously you have a direct interest in how Syriza's brinksmanship plays out. And if you live in the EU, you should be watching closely to see what the larger ramifications may be for the Eurozone. But should this Greek drama concern the rest of us?

Absolutely.

The sovereign insolvency at the heart of the Greece crisis is not unique nor isolated. Most other countries around the globe share the same terminal condition of having Too Much Debt. Greece, a small player, is simply succumbing earlier than they are.

And as Greece proves you can't get blood from a stone, other countries will similarly demonstrate their debts cannot be repaid in full, either. And losses will eventually -- inevitably -- have to be taken. And when that happens, watch out.

In Part 2: The Approaching Great Unraveling - Are You Prepared? we detail out how, in today's over-indebted, over-leveraged, and intensely interconnected global economy, the losses created by sovereign insolvencies will spark a cascade of mortal shocks across the world's financial system. Some countries will fall into deflationary depressions while others will experience roaring inflation. Massive failures will ripple across industries and vast amounts of wealth will be transferred from the hands of the many into the few well-positioned in advance.

The developments in Greece are sending us a clear warning. Are you listening?

See the original article >>

Follow Us