by Greg Harmon
Last week’s review of the macro market indicators suggested, heading into February the equity markets looked biased to the downside to start the month. Elsewhere looked for Gold ($GLD) to continue to consolidate in the short term uptrend while Crude Oil ($USO) was ready for a bounce or reversal in the downtrend. The US Dollar Index ($UUP) seemed ready to consolidate sideways in the uptrend while US Treasuries ($TLT) continued to be biased higher.
The Shanghai Composite ($ASHR) was also consolidating in its uptrend while Emerging Markets ($EEM) looked to have failed in their attempt to rally and were biased to the downside. Volatility ($VXX) looked to remain low but drifting up easing the wind behind the equity markets to a light breeze. The equity index ETF’s $SPY, $IWM and $QQQ, all saw risk to the downside in both the daily and weekly charts with the QQQ the strongest on the longer timeframe followed by the IWM and then the SPY, but the IWM possibly a bit stronger on the short timeframe over both the QQQ and SPY.
The week played out with Gold drifting lower in consolidation before falling to end the week while Crude Oil started higher. The US Dollar consolidated all week in a slight downward path while Treasuries pulled back all week from the new high. The Shanghai Composite continued to pullback from the highs, consolidating the big move, while Emerging Markets tried to rally again and failed. Volatility pulled back from the high but remained above the range of move of 2014. The Equity Index ETF’s all bottomed on Monday and moved higher the rest of the week with the SPY and IWM making higher highs but the QQQ lagging. What does this mean for the coming week? Lets look at some charts.
SPY Daily, $SPY 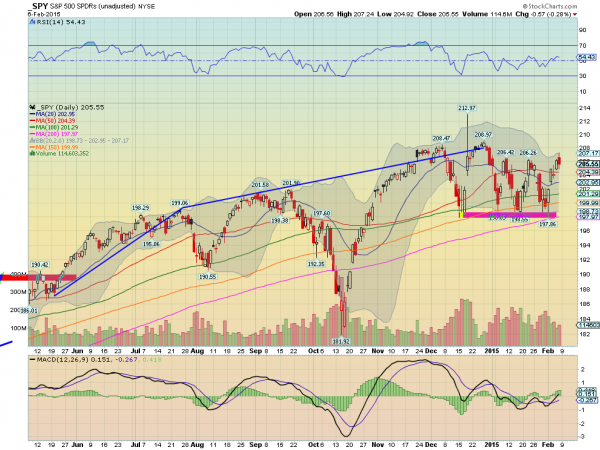
The SPY started the week making a marginal new low Monday. At that point a series of two lower highs and two lower lows. A downtrend despite the consolidating look. But that did not even last until the afternoon as it started higher. The next 3 days continued higher and ended by making the first new marginal higher high of the year. Downtrend over? Friday messed that up again moving higher to start but reversing to close down on the day. A good week over all. The RSI on the daily chart shows another leveling just over the mid line, neither bullish or bearish, while the MACD is starting to drive higher. A continuation and follow by the RSI could turn the market higher.
SPY Weekly, $SPY 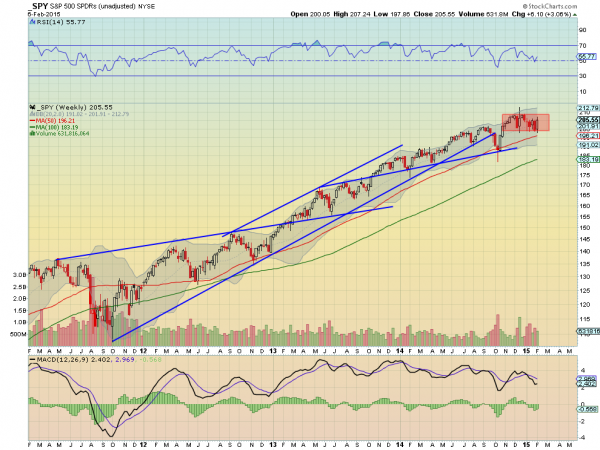
The weekly chart shows the consolidation range continuing for the 14th week between 200 and 209. The positives are that the RSI has held over the mid line the entire time as it pulled back, in the bullish zone, and the MACD may be turning back towards a bullish cross. The 50 week SMA is still below and a touch there has been what it has taken to trigger a move higher. There is resistance at 206.40 and 209 before a Measured Move higher to 225. Support lower comes at 204.30 and 202.30 before 200 and 198.60. Continued Consolidation in the Uptrend.
Heading into next week the equity markets are coming off of a good rebound higher but showed signs of exhaustion Friday. Elsewhere Gold looks to continue to pullback while Crude Oil tries to move higher off of a bottom. The US Dollar Index may continue to consolidate the rise, pulling back mildly, while US Treasuries are biased lower in their uptrend. The Shanghai Composite looks to continue its pullback from a major run higher and Emerging Markets continue to consolidate in a bear flag in their downtrend.
Volatility looks to remain low but slowly rising slowing the wind be=hind equities to move higher. The equity index ETF’s SPY, IWM and QQQ, are all in a consolidation pattern in the intermediate term, despite the moves higher last week. The IWM looks the strongest and may test the all-time highs this coming week while the SPY is close behind but the QQQ a bit weaker. Use this information as you prepare for the coming week and trad’em well.
No comments:
Post a Comment