 |
Sunday, September 14, 2014
Stock bull-bear line blurred by pending Fed action

SAN FRANCISCO (MarketWatch) — A two-day Federal Open Market Committee meeting looms before investors in coming days.
Stocks snapped a five-week winning streak Friday, with the Dow Jones industrial Average DJIA, -0.36% down 0.9%, the S&P 500 Index SPX, -0.60% falling 1.1%, and the Nasdaq Composite Index COMP, -0.53% off by 0.3% for the week.
Investors will be on the lookout for the two magic words of “considerable time” in the Fed’s FOMC policy statement. That phrasing relates to when the Fed expects to begin raising interest rates from near-zero levels. Omission of the phrase from the statement could indicate a hike sooner than investors have been expecting.
Dan Greenhaus, chief strategist at BTIG, who thinks the “considerable time” language might survive in the September meeting’s policy statement, said the relentless move in stocks since 2011 has sucked in the last of the bearish strategists, some of whom are forecasting notable gains by the end of the year.
“Since we, like others, haven’t gotten absolutely more bullish, this has left us relatively more bearish,” Greenhaus said.
Bearish strategists have continued to loosen up and hike their targets. This past week noted bear Gina Martin Adams at Wells Fargo Securities dropped her 1,850 year-end target in favor of a 12-month target of 2,100, as earnings strength is beginning to counter the fear of Fed volatility. Similarly, David Bianco at Deutsche Bank raised his target to 2,050 from 1,850.
Holdouts to raising targets are fewer, but remain. Brian Belski at BMO Capital Markets is sticking by his 1,900 target, emboldened by others’ target raises, and convinced that stock prices have gotten ahead of themselves and need earnings to catch up, especially with the Fed wrapping up its easing programs.
BTIG’s Greenhaus is also wary of how investors will digest Fed policy going forward.
“As we increasingly approach the end of 2014, the bias does indeed remain to the upside but the fact remains that we’re closing in on tighter Fed policy and that is often not good for equities,” Greenhaus said.
With QE training wheels off: Will earnings provide momentum?
In the slow time between earnings season peaks, a few notable company will be releasing results this week.
Adobe Systems Inc. ADBE, -1.99% reports on Tuesday. FedEx Corp. FDX, +0.81% General Mills Inc. GIS, -0.90% , and Lennar Corp. LEN, -1.39% report on Wednesday. Then, on Thursday, Oracle Corp. ORCL, -0.44% , ConAgra Foods Inc. CAG, -0.49% , and Red Hat Inc. RHT, -1.86% release quarterly results.
Following that it’ll be less than a month before we’re back in the thick of earnings season in October.
Currently, about 75% of companies on the S&P 500 offering quarterly outlooks are guiding below the Wall Street consensus, according to John Butters, senior earnings analyst at FactSet. While that may seem high compared to the five-year average of 66%, it’s below the 83% from this time last year, and on par with the 75% from three months ago heading into this past earnings season.
In fact, corporate outlooks are at their most optimistic in nearly two years, according to Savita Subramanian, Bank of America Merrill Lynch equity and quant strategist, in a recent note.

BofA Merrill Lynch US Quantitative Strategy
Outlook optimism highest in nearly two years.
“After growing increasingly negative on earnings guidance since 2010, management is finally sounding more constructive,” Subramanian noted. “The 3-month ratio of above-consensus to below-consensus earnings guidance ticked up to 0.60 as of the end of August, just below average and at the highest level since December 2012.”
Third-quarter earnings for the S&P 500 are currently expected to grow by 6.2%, down from an estimate of 6.5% a week ago., according to Butters.
"Low Volatility Everywhere" - BIS Sounds Alarm Alert On Pervasive Complacency Masking Systemic Shocks
by Tyler Durden
Here comes another BIS report, and another stark warning by the central banks' central bank, the Bank of International Settlements, best known for selling gold at key inflection points, that not only are asset prices are at "elevated" levels but that market volatility remains "exceptionally subdued" thanks to ultra-loose central bank policies around the world. In other words: pervasive complacency boosting the asset bubble to unseen levels and masking the threat of systemic shocks.
First, a flashback: this is what the BIS warned back in June 2014.
"... it is hard to avoid the sense of a puzzling disconnect between the markets’ buoyancy and underlying economic developments globally.... Despite the euphoria in financial markets, investment remains weak. Instead of adding to productive capacity, large firms prefer to buy back shares or engage in mergers and acquisitions.
As history reminds us, there is little appetite for taking the long-term view. Few are ready to curb financial booms that make everyone feel illusively richer. Or to hold back on quick fixes for output slowdowns, even if such measures threaten to add fuel to unsustainable financial booms. Or to address balance sheet problems head-on during a bust when seemingly easier policies are on offer. The temptation to go for shortcuts is simply too strong, even if these shortcuts lead nowhere in the end.
This follows a just as solemn warning back in June 2013, when it warned that the monetary Kool-aid party is coming to an end:
Can central banks now really do “whatever it takes”? As each day goes by, it seems less and less likely... Six years have passed since the eruption of the global financial crisis, yet robust, self-sustaining, well balanced growth still eludes the global economy. If there were an easy path to that goal, we would have found it by now.
Monetary stimulus alone cannot provide the answer because the roots of the problem are not monetary. Hence, central banks must manage a return to their stabilisation role, allowing others to do the hard but essential work of adjustment.
Many large corporations are using cheap bond funding to lengthen the duration of their liabilities instead of investing in new production capacity.
Continued low interest rates and unconventional policies have made it easy for the private sector to postpone deleveraging, easy for the government to finance deficits, and easy for the authorities to delay needed reforms in the real economy and in the financial system.
Overindebtedness is one of the major barriers on the path to growth after a financial crisis. Borrowing more year after year is not the cure...in some places it may be difficult to avoid an overall reduction in accommodation because some policies have clearly hit their limits.
Which brings us to today, and the just released latest quarterly reviews, whose topic is summarized by the title of the chart below:

In today's release, instead of discussing leverage, or asset levels, this time the BIS' take on the global asset bubble, the same one decried by Deutsche Bank last week, is by way of collapsing volatility: i.e., the #1 specialty of the VIX-selling team at Libery 33, where Kevin Henry is such an instrumental part. Some exceprts:
After the spell of volatility in early August, the search for yield – a dominant theme in financial markets since mid-2012 – returned in full force. Volatility fell back to exceptional lows across virtually all asset classes, and risk premia remained compressed. By fostering risk-taking and the search for yield, accommodative monetary policies thus continued to support elevated asset price valuations and exceptionally subdued volatility.
Here, in addition to pointing out the obvious, the BIS highlights something that everyone else has been scratching their heads over: how with a world on the edge of war the global markets are just shy of all time highs:
Increased geopolitical stress had surprisingly little effect on energy markets. In the spot market, oil prices actually fell by around 11% between end-June and early September (Graph 1, right-hand panel). Market expectations for oil demand were revised down, largely on disappointing growth in the euro area and Japan. Incoming data from China were mixed, with that country’s manufacturing PMI registering an 18-month high in July, but falling back in August. All in all, demand factors seemingly offset concerns over potential short-run supply disruptions.
So how does the BS explain this paradox? Simple: hopes for even more easing, this time from the ECB:
The spell of market volatility proved to be short-lived and financial markets resumed their rally soon afterwards. By early September, global equity markets had recouped their losses and credit risk spreads once again consolidated at close to historical lows. While geopolitical worries kept weighing on financial market developments, these were ultimately superseded by the anticipation of further monetary policy accommodation in the euro area, providing support for asset prices.
In other words, central banks are now perceived to be more powerful even that the threat of regional or not so regional war.
Yet the core BIS' warning this time is one about complacency, as Reuters notes: "There were several references in the report to the "extraordinarily" and "exceptionally" low levels of volatility, suggesting the BIS feels markets may be getting too complacent and therefore vulnerable - and therefore ill-equipped to a shock."
To summarize: the bank that supervises all central banks has first warned about new and disturbing all time highs in leverage, then a global asset bubble driven largely by companies investing in stock buybacks instead of growth, and now about widespread unsustainable complacency. Surely this reiteration of everything that Zero Hedge has been warning about for years should be sufficient to send the e-mini comfortable above 2000 as soon as futures are open for trading.
Finally, here are the key BIS charts:


Finally, a quick annotation by us on one of today's key BIS charts showing when and where things changed:

Why U.S. Equities Are Hitting All-Time Highs
by Roman Chuyan
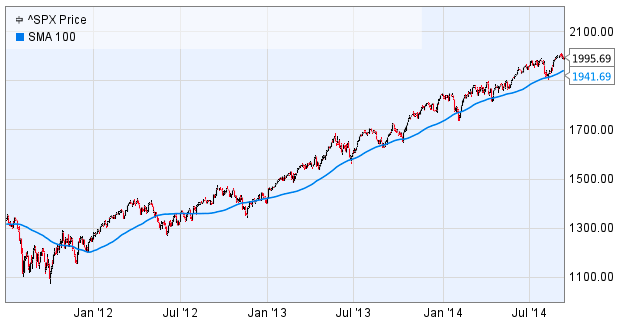
The U.S. equity market has continued its uninterrupted bull run for three years in a row. The last significant correction occurred in July-October of 2011, and was -18% from peak to trough.
Source: Ycharts
This has been especially surprising to some observers given all the geopolitical problems around the world. Triggered by several armed conflicts (Ukraine, Gaza, the ISIS) the recent dip in stocks in July-August nonetheless ended up being minor - just -3.9% from peak to trough. Equities recovered strongly in August, with the S&P 500 (NYSEARCA:SPY) up 3.95% in the month (a total return of 9.9% YTD), reaching new all-time highs and crossing the psychologically-important 2000 level.
Audiences are bombarded with bearish opinions by the financial media and on the web (including here on Seeking Alpha), while we rarely see a bullish one. This is a known phenomenon - people react more strongly to bad news than good. The media, that are in the business of attracting and engaging the broadest audience possible, know this. As the old newspaper men used to say, "when it bleeds, it leads." Bearish voices get louder during market declines, as it did in August when perma-bears ranging from Marc Faber to Jim Grant, to Peter Schiff, were featured in the financial media to present their always-bearish cases. While bearish opinions get all the prominence in the media, the case of strong economic fundamentals gets little notice.
Economic Fundamentals
But why are U.S. stocks doing so well? It's because U.S. economic fundamentals are very strong - I provide just a few examples below. Fundamentals drive markets, not geopolitics.
At Model Capital Management, we monitor over 20 fundamental factors that influence equity index returns, according to our tactical investment research. We categorize these factors into Economic, Valuation, and Market groups. In this article, I cover some of the purely-economic factors. I will write about non-economic fundamentals that belong to Valuation and Market groups in a follow-up article, so please stay tuned.
Durable Goods Orders surged 22.6% in July to $300.1 billion, according to the Commerce Department. This was by far the sharpest monthly increase, and the highest monthly order volume, in the history of the series, dating back to 1992. Orders were fueled by aircraft and automobiles; excluding transportation, orders are still close to an all-time high (see chart).
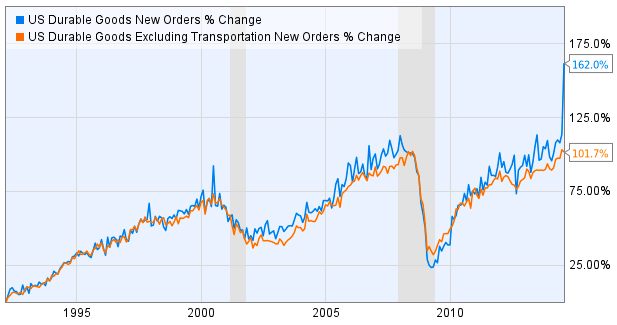
Source: Commerce Department
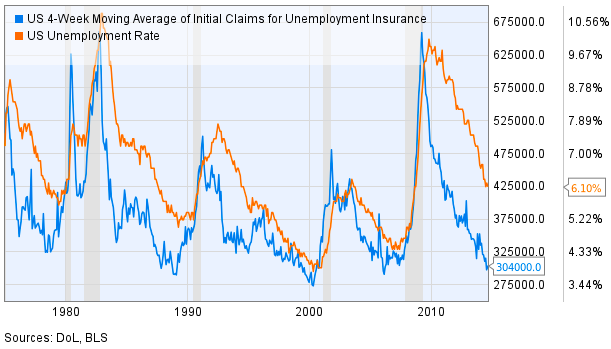
Employment was slow to recover from the Great Recession. But it has now not just recovered - it is, in fact, quite strong, both historically and compared to other developed economies. Initial jobless claims are at 304,000 (on a 4-week-average basis). In the past 40 years, claims reached this low level only three times: in 1988, in 1999-2000, and briefly in 2006 (see chart). Unemployment rate lags jobless claims; it took some time to for it to recover to the current level of 6.1%, as it did after the previous severe recession of 1981-82. However, with claims this low and with strong job openings, it's only a matter of time before unemployment and workforce participation rate recover as well.
Consumer sentiment and spending are healthy as well. For example, a measure of Consumer Sentiment just released today rose to 84.6, the second-highest monthly reading since 2007 (after July-2013). Of course, not all is perfect yet in the economy, which the bearish observers are quick to point out - income and unemployment rate are lagging (as they typically do). We must be realistic - it's a process that takes time. The strength in most areas of the economy (housing, jobless claims, job openings, consumption) should lift those lagging factors over time.
Based on fundamental factors, our tactical investment management models expected strength in U.S. equities all of this year, which gave us at Model Capital confidence to keep our portfolios in full risk-on position - and they did well. While data may change at any time, our models expect strength in U.S. equities to continue in the near term. Based on that, we recommend to overweight U.S. equities and underweight bonds. Allocate the maximum amount allowed by an investor's risk tolerance (or institution's investment policy) to broad U.S. equities - example ETFs are SPY, the Vanguard Total Stock Market ETF (NYSEARCA:VTI), and the iShares Core S&P 500 ETF (NYSEARCA:IVV). We also currently recommend an overweight to Growth factor (the iShares S&P 500 Growth ETF (IVW), the Guggenheim S&P 500 Pure Growth ETF (RPG), and the PowerShares QQQ Trust ETF (QQQ) are some examples).
Low volatility is a sign of high risk-taking, BIS official says

WASHINGTON (MarketWatch) — Low volatility and compressed risk spreads are signs of high risk-taking, a Bank for International Settlements official said as part of the group’s quarterly review.
The BIS is often referred to as a central bank for central banks, and it’s been warning for years of the dangers of very low interest rates.
The chart above shows the implied volatility of the S&P 500, Euro Stoxx 50, FTSE 100 and Nikkei 225, weighed by market cap.
“A common mistake is to take unusually low volatility and risk spreads as a sign of low risk when, in fact, they are a sign of high risk-taking,” said Claudio Borio, head of the monetary and economic department at the BIS.
“It all looks rather familiar. The dance continues until the music eventually stops. And the longer the music plays and the louder it gets, the more deafening is the silence that follows.”
Borio told reporters that volatility is low because of “muted uncertainty” about the economic outlook and unusually accommodative monetary policy. “People may not necessarily like what they see, but they seem to think they see it more clearly,” he said. Borio added that the last time uncertainty was this low was in 2007 — just before one of the largest forecast errors the economics profession has ever made.

Debt issuance has picked up markedly from companies headquartered in emerging market countries, the BIS notes.
Hyun Shin, an economic adviser and head of research at the BIS, says there’s good and bad in that development.
“On the one hand, developing countries have large capital needs, so mobilizing the savings of the rich countries to harness these opportunities is clearly welcome,” he said. But leverage also has increased significantly.
Emerging-market companies also have extended the maturity of their obligations.
“Yes, the share of debt to be refinanced every year has fallen, but longer maturities make fixed rate bonds more sensitive to interest rate movements, which makes them riskier for investors,” he said.

There’s evidence of “herding” by asset managers in asset markets. Widespread benchmarking and short-term performance assessment limit the willingness of portfolio managers to depart from the norm.
During last year’s taper tantrum, retail investors withdrew from funds when prices were falling and re-entered when prices were rising. That forced funds to do much the same.

The BIS took a look at house prices across several countries. Based on comparing prices to income and rent, Canada could see a reversal or a slowing in growth, and Belgium and France could see a further deterioration.
At 17%, the U.S. is near the top in terms of real house price growth over the last three years. Spain, by contrast, has seen a 21.5% slide.
It's Hard To Ignore George Soros' SPY Put Position Anymore
by David White
George Soros is a multi-billionaire hedge fund manager. He is perhaps most famous for his role in the Quantum Fund - a fund he established in 1969. A $1000 investment then would have made you $4 million by 2000. This fund has been one of the most successful hedge funds in history, and George Soros has the consequent reputation as a pre-eminent money manager.
On August 15, 2014, MarketWatch reported that Soros Fund Management had increased its put position on the S&P 500 (NYSEARCA:SPY) from 1.28% of its holdings to 4.79% in Q1 2014. It had then roughly tripled that in Q2 2014 to 13.54% of its holdings. According to Whalewisdom.com, Soros' put position in the SPDR S&P 500 ETF amounted to 16.6513% (about $2.21B) of his total portfolio value of $13.27B as of June 30, 2014. It is Soros' top portfolio holding. George Soros doesn't usually make bets this big on a whim and he has historically been correct on a lot of his big bets. Investors should consider following his example. Such a bet would provide a hedge against a large downside move by the US equities market, which many are increasingly worried is coming.
Since I am sure a few readers will ask about Soros' new positions on June 30, 2014, the major new ones are: CONSOL Energy Inc. (NYSE:CNX) - 1.7664%, Google Inc. (NASDAQ:GOOG) (NASDAQ:GOOGL) Class C - 0.8431%, Level 3 Communications Inc. (NYSE:LVLT) - 0.5914%, Time Warner Cable Inc. (NYSE:TWC) - 0.491%, and New Oriental Education & Technology Group (NYSE:EDU) - 0.4823%.
Back to the main topic. Soros seems to be sure that the S&P 500 will eventually fall dramatically. His actions have been a doubling down at each new interval recently. Will this mean he is definitely right? No one could say that for sure. However, the S&P 500 has not had a strong pullback since July 18, 2011-August 15, 2011. The bull market has been in effect since early March 2009. That's about 66 months. The average length of a bull market since 1871 has been 67 months. The median length has been only 50 months. We are starting to become very overdue for a bear market. The median bear market drops about 38% in roughly two years. Soros may be planning on this. He may be planning on just a strong pullback, which also seems overdue.
Soros may also play both of the above possibilities. That is, he may take some profits if he gets a strong pullback before he gets a bear market. For instance, many pundits feel that we are overdue for a strong pullback; that could occur almost immediately. However, many feel that a bear market will not start until after the midterm elections. They feel that the politicians will not allow that. After the midterm elections, there would likely be the Christmas rally. That is something that has been historically hard to stop. Then, there is typically a small cap rally in January. However, if the overall market performs poorly in January, that often signals a bad year. Such a signal could easily be the start of the bear market that is increasingly overdue. It is easy to see Soros' logic. It may be wise to hedge the market to the short side along with him at this point. Besides you would be getting short at a point where he has already doubled down twice. Your odds of success should then be better than his.
I am suggesting following Soros, but it is not just his reputation or just the long in the tooth bull market that makes me think he may turn out to be right. The following are further indicators that we may see a negative turn in the market soon:
1. The margin debt level for the NYSE is incredibly high. When the selling starts, there may be a huge rush to the door and prices may overshoot to the downside due to the large amount of fear that the rush to the exit engenders (see chart below).
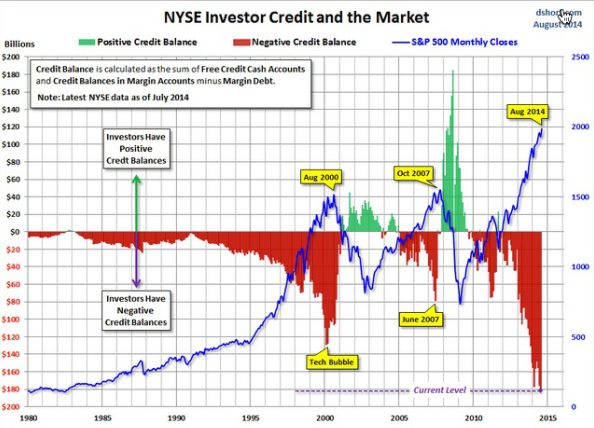
2. As investors can see, the large negative credit balances have marked the ends of the previous two bull markets rather dramatically. The current negative credit balance is notably bigger than either that of the tech bubble or that of the pre-Great Recession bubble. We may see a dramatic fall. I'm sure Soros has seen this chart or one like it.
3. The CAPE (Cyclically Adjusted PE) for the S&P 500 is abnormally high at 26.27 as of September 12, 2014. The mean is 16.55 and the median is 15.93, so the current reading is significantly higher than normal. This indicates that the S&P 500 is over priced. It needs to sell off for many investors to think they are getting a bargain when they buy.
4. The US GDP growth rate for Q2 2014 was 4.2%; but for Q1 2014, it was only -2.1%. This averages out to a weak GDP growth for 1H 2014 of +1.05%. Many expect growth in 2H to be as high or higher than the Q2 2014 growth, but the Trading Economics figures are lower than that at +3.0% for Q3 2014 and +2.8% for Q4 2014. Further these are just forecasts. The actual numbers could easily underperform (or outperform) the forecasts.
5. Russia is in a recession, according to the IMF, and the increasing sanctions by the EU and the US over the situation in the Ukraine are only likely to make that recession worse. Further Russian retaliatory sanctions against the US and the EU are bound to hurt both of those economies as well.
6. The final Chinese HSBC/Markit Purchasing Managers' Index (PMI) fell to 50.2 in August 2014. This is almost to the contraction point of less than 50.0. The August Chinese PPI was -1.2% year over year. This was slightly worse than expected and a negative value is usually interpreted as a sign of a slowing economy. Reinforcing this thesis was the Chinese Industrial Production year-over-year gain of only 6.9% for July 2014 compared to the previous month's 9.0% gain. The Foreign Direct Investment year over year for July was also down -0.4% - the first fall in 17 months.
7. If China's economy slows too much, there is the very real possibility of a massive credit crisis in China. I have seen estimates for bad debts as high as $4T; but they may be much more. For instance, one report issued by the National Audit Office December 30, 2013 said that just the borrowing by provinces, counties, and townships reached roughly $3T as of June 2013. This was up 63% since the end of 2010 and it has surely gone up more since June 2013. Much of the Chinese "local government debt" is bad debt already. They have no way of paying it back. On top of this debt, there is the national debt, the business debts, and debts of individuals. The more the economy slows, the more debt will go bad. My estimate is that a critical level may be the 5%-6% GDP growth range for China. Chinese GDP growth was 7.5% in Q2 2014, which is still far above that. However, it is wise to remember that Chinese GDP growth was 10.4% in 2010 and it was over 10% for many of the years from 2003-2010. This allowed credit based on a 10%+ growth level to build up considerably, and China may be in for a severe credit crisis as its economy continues to slow. Plus don't forget it is the world's second largest economy. It is no longer some small isolated economy that the US can ignore.
8. The trouble in the Ukraine seems to be escalating rather than abating. Israel is having trouble with the Palestinians again. Iraq is in a state of Civil War, and Obama is now overtly helping the sitting Iraqi government with US air power. Many are starting to carp that he is starting a new war without Congressional approval. This is a bit of a fuzzy area for the moment. However, over the longer term, Obama probably needs Congressional approval and it is not clear he will get it. What will happen then? The uncertainty of this situation, even more than the possibility of another US war in Iraq (and possibly Syria), could derail the bull market.
9. Argentina defaulted on its debt.
10. Brazil may be in a new recession. Its GDP shrank -0.6% in Q2 2014, and its Q1 GDP growth was revised downward to -0.2%.
11. Italy is in recession again; and the 18-country Euro Area GDP growth was flat at 0.0% for Q2 2014. Portugal's Banco Espirito Santo needed a 4.9B Euro bailout. Austria's largest bank, Erste Bank, saw its stock crash after it revealed a 40% surge in bad debt provisions, which led to a -$2.2B loss. The IMF thinks Europe's financial sector has $2T in bad debt on its books, so there is probably a lot more bad news to come. Draghi's recent QE moves would seem to confirm this thesis. Then there are the roughly 25% unemployment rates in both Greece and Spain. Plus, youth unemployment in Europe is greater than 50% in Spain and Greece, and it is over 40% in Italy and Croatia. The overall picture is ugly; and the sanctions by Russia can seemingly only lead the EU further down the rabbit hole. If the EU economy goes into another recession, which it seems close to doing, that will in turn have negative effects on the US and Chinese economies.
12. There are many more economic data points that I have left out, but the above ought to be enough to give readers an idea of the perils of the current world economic situation. The above does not mean that the sky is falling. However, it does mean that investors need to keep a close eye on the world economic situation. It could deteriorate easily; and if it does, we could be in for some very hard times.
All told, the rationale behind Soros' bet on a down move in the S&P 500 seems sound. That doesn't mean we will get one immediately or even with the new year. However, it probably does mean that investors may want to start to hedge their portfolios as Soros is doing. If you decide to do so, keep in mind that he still has only 16.6513% of his portfolio in this negative bet as of June 30, 2014. It may be roughly $2.2B, but that is only because Soros manages a lot of money. Consider also that Soros may be averaging into his position. He has already doubled down twice. Meanwhile, the S&P 500 is up 8.86% for 2014 through the market close on Friday September 12, 2014. He has lost money on this bet thus far, but he is a seasoned investor. He does not believe he can time the market perfectly. Investors who decide to follow his strategy should keep in mind that they likely cannot time the market perfectly either. Their strategies should recognize that reality. Any put position should be long dated.
If you consider that a bear market is usually a 2+ year event, you should be able to find an appropriate strategy for you. A 38% fall from the recent SPY closing high of $201.11 would be to $124.69 per unit of the SPY ETF. If you don't believe this large a fall will occur, you can bet on a lesser fall. For instance, the SPY January 2016 $195 put options are $14.62. They would become profitable at any price below roughly $180. If you did a put spread, you might use $180 as the bottom. You could sell these $180 puts for $9.50, or you could sell the $170.00 puts for $6.98, etc. (to partner with the $195 puts you bought). The spread would cost you less than simply buying the $195 January 2016 puts, but it would also limit your profits.
Some people will just want to short the SPY ETF itself, but investors should keep in mind that they must pay the dividends (about 1.78% annually) on any SPY units that they are short. Plus, you will be losing money for all of the distance the SPY goes up. If you are sure of a downturn, this is not a huge issue. However, remember the old adage, "the stock market can stay irrational longer than you can stay solvent." With options your risk is at least defined. This is one reason some investors such as Soros prefer to use puts. Further, the options control many more shares with much less money. That allows Soros to still bet many things to the upside, while using options as downside protection.
Buying Stocks Based on How Other People Feel
One of my favorite pastimes is dissecting accepted Wall Street wisdom to see if it contains any value for investors or traders. Often, upon examination, the widely held beliefs turn out to be closer to magical thinking than financial acumen.
One of the more recent examples is the way some analysts use data on sentiment to determine how much an investor should allocate to equities. The problem is that the sentiment data is inconclusive and sometimes contradictory. There is no signal within the noisy data.
Sentiment is extremely difficult to use as an indicator because it is only rarely at the extreme readings needed to generate a reliable trading signal. Recall the March 2009 low, where every measure of sentiment was deep in the red. Or October 2002, by which time the Nasdaq Composite Index had fallen almost 80 percent from its high and everyone hated tech stocks. These extreme events are rare.
One of the analysts who has observed these phenomena for many decades is Laszlo Birinyi, formerly of Salomon Brothers, and now of Birinyi Associates. In this weekend’s Masters in Business interview, Birinyi describes why so many sentiment measures are worthless. There is no usable signal in the American Association of Individual Investors bull/bear survey, Birinyi says. Many other such polls also lack a consistent methodology or are otherwise flawed. They are useless to investors, he says.
Lately, I have been seeing a spate of articles and blog posts that try to make the claim otherwise. Many of these are either inconsistent in their understanding of sentiment or misstate the significance.
ZeroHedge is one such site. Known for its insightful analysis of derivatives and flash trading, its ventures into sentiment readings have been less successful during the course of the 200 percent rally in the Standard & Poor's 500 Index. But one recent post on the site contained a surprisingly bullish subtext. A post headlined “CNBC Viewership Plunges To 21 Year Lows” shed light on the persistent apathy of individual investors toward equities. High levels of investor attention to financial media often accompany market bubbles -- or crises.
Data confirm this lack of enthusiasm. The Federal Reserve’s Survey of Consumer Finance found that “only 48.8 percent of Americans held stock either directly or indirectly in 2012.” According to CNBC, this is the lowest level since 1995. The Wall Street Journal also noted that mutual fund investors were “stepping back” from U.S. equities.
There is lots of anecdotal evidence that suggests the markets have become too frothy and that sentiment has become too bullish. Lately, many bears who fought the tape the entire way up have abandoned the cause. As the Journal's blog Moneybeat reported, Gina Martin Adams, senior analyst at Wells Fargo Securities, threw in the bearish towel. This was months after Morgan Stanley’s Adam Parker capitulated. And longtime bear David Rosenberg famously turned bullish more than two years ago.
However, as the old saw goes, the plural of anecdote is not data. Until we can quantify what various strategists who have missed a huge rally turning bullish actually means to future market action, it's best to take all sentiment data with many grains of salt. No one has the ability to consistently forecast any of the inevitable market corrections (despite being told the trick). Instead, I have found it best to ignore the short-term action and concentrate on being on the right side of the long-term trend.
Rest assured, as soon those extremes in sentiment appear, you will be reading about them in this space.
Vote YES On Scottish Independence – Scotland Finally Has A Chance To Get Free From The British
By Michael Snyder
Scottish voters finally have the opportunity to fulfill William Wallace's dream of a Scotland that is free and independent of England forever. All they have to do is vote yes next week. Without a doubt, a divorce from the British would be quite messy, and life would probably be more comfortable in the short-term if Scotland remains part of the United Kingdom. But hopefully the people of Scotland are looking beyond short-term concerns. Today, the United Kingdom is a horribly repressive Big Brother police state that is dominated by bureaucratic control freaks. You can hardly even sneeze without violating some kind of law, rule or regulation. And the London banking establishment is at the very heart of the debt-based global financial system which is enslaving so much of the planet. Scotland finally has a chance to get free from all of this. All it is going to take is a yes vote on Scottish independence.
It looks like it is going to be an incredibly close vote. Recent polls show that the result could go either way. Needless to say, this is causing the British establishment to freak out quite a bit.
For example, a couple of large banks have attempted to sway the vote during this past week by publicly declaring that they will have to move to England if the vote for Scottish independence is successful...
The Royal Bank of Scotland announced Thursday that it is making contingency plans to move its legal incorporation to England in the event of a “yes” vote. In addition, Lloyds Banking Group said it had made arrangements to establish “new legal entities” in England should voters in Scotland decide to sever ties with Britain.
And there have been lots of other warnings of "economic disaster" for Scotland if it does not remain part of the United Kingdom...
Standard Life, the pensions company, disclosed that it was planning to move part of its business to England to protect its customers, while BP and Shell backed expert predictions that North Sea oil will have all but run out by 2050. It also emerged that nearly $2-billion has flowed out of U.K. equity funds in the past two months amid heightened uncertainty over what separation would mean for the economy.
Honestly, it is probably true that there would be some short-term economic disruptions for Scotland.
But in the long run the Scottish would probably be in quite good shape considering how much of the North Sea oil they would own. Just check out the following excerpt from a recent Bloomberg article...
The discovery of North Sea riches in the 1970s planted the seed of modern-day Scottish nationalism as supporters of independence cried “It’s our oil!”
Four decades later, nothing will be more important to the economic future of Scotland than the oil industry should the country vote to end the 307-year union with the rest of the U.K.
Reserves of oil and gas would be split, possibly along the so-called median line, already used to allocate fishing rights. The division would hand the Scots about 96 percent of annual oil production and 47 percent of the gas, according to estimates for 2012 by the University of Aberdeen’s Alex Kemp and Linda Stephen cited by the Scottish government.
What most British politicians won't tell you is that it would probably be the British that would suffer the most economically in the short-term and in the long-term.
In fact, if there is a yes vote for Scottish independence it is being projected that the value of the British pound will fall substantially and we could see a "negative shock" in British financial markets...
Adam Memon, the head of economic research at the Centre for Policy Studies, said: “The principal immediate threat would be to sterling and the stability of the financial markets. The recent selloff is a mere warning of what may come if the Scots actually do vote for independence.”
Threadneedle Investments said: “Given the constitutional and economic uncertainties attached to a potential break-up of the UK, a vote for independence would be likely to deliver a negative shock to UK financial assets and lead to meaningful currency weakness.”
And actually, the Scottish are not going nearly far enough with this vote for independence. For example, according to Yes Scotland a newly-independent Scottish government would continue to have allegiance to the Queen...
The Scottish Government’s proposal is that the Queen remains Head of State in Scotland, in the same way as she is currently Head of State in independent nations such as Canada, Australia and New Zealand.
This would be the position for as long as the people of Scotland wished our country to remain a monarchy.
Speaking as an American, let me say that getting rid of the British monarchy has worked out exceptionally well for us.
Hopefully the Scottish people will make a similar decision sooner rather than later.
If Scotland does indeed end up voting for independence, it could give momentum to similar movements all over Europe.
Just this week, hundreds of thousands of Catalans took to the streets in Barcelona to demand the right to vote on independence from Spain...
Thousands of Catalans have rallied in Barcelona, Spain, demanding the right to hold a referendum on independence.
Participants, waving Catalan flags and wearing the flag's red and yellow colours, stood in a V-shape formation, indicating their desire for a vote.
Protesters were energised by Scotland's forthcoming independence referendum - and many also waved the Scottish flag.
The regional government has called a referendum for 9 November. The Spanish government says the vote is illegal.
Could we end up seeing a number of new nations emerging from the chaos that is about to engulf Europe?
This is clearly not what the establishment wants. In fact, George Soros says that "this is the worst possible time" for Scottish independence.
That alone is a really good reason to vote yes.
Personally, I am rooting for the Scottish people on this one. I truly hope that they are finally able to win their freedom.
The people of Scotland have been pushed around by the British for centuries.
Now they finally have a chance to stand up to the tyranny of London.
They finally have a chance to get free.
Let us hope that they take it.
America's Poor Have Never Been Deeper In Debt
by Tyler Durden
Ever since the Lehman bankruptcy, one of the main reasons given by the perpetual apologists about why i) the so-called "recovery" has been the worst in US history and ii) the Fed has been "forced" to conduct 6 years of wealth transferring policies, boosting the stock market to all time highs and creating a record wealth split in US society between the super rich and everyone else (one that surpasses even that seen during the roaring 20s) is that the US consumer, scarred by the economic crash, has been rushing to deleverage and dump as much debt as possible.
There are two problems with that story:
- First, as we first pointed out in 2012, US households are not deleveraging, they are defaulting, a huge difference which goes to motive and intent, and shows that instead of actively paying down debt households are instead loading up on as much debt as they can, which at some point they simply stop servicing (for a detailed analysis of this disturbing trend, read our series on the student loan bubble).
- Second, when it comes to the poorest quartile of US society, some 14 million people, it is dead wrong. In fact, as the Fed's triennial Survey of Consumer Finances, released last week showed, America's poorest have never been more in debt!
As usual, the full story is one of nuances. As Bloomberg reports, as a result of the first point - mass defaults - US household debt has indeed declined on an average basis. Indeed, average debt burden for all families stood at about 105% of pretax income in 2013, down from about 125% in 2010 and the lowest level since the 2001 survey.

Of course, since economists are unable to grasp the difference between default and deleveraging, one look at the chart above gives them reason for hope. As Bloomberg summarizes:
The improved finances, along with more recent signs that consumers are feeling comfortable about borrowing again, has given some economists cause for optimism: The more progress households make in getting out from under their debts, the logic goes, the greater the chances that renewed spending will boost growth.
In reality, the "improved finances", namely those tens of trillions in financial assets that have been artificially reflated courtesy of the Fed's monetary policies, have benefited the tiniest sliver of US society - about 1% or less depending on whose calculations one uses. Everyone else, the bulk of US society, was forced to simply stop paying down their credit card and thus "delever."
But for a good perspective of what the part of society that is at the opposite end of the 1%, namely those 14 million or so Americans who comprise the poorest quartile of households, look no further than the chart below, which shows just what Americans are really doing up until that point where default does equal "deleveraging", even if it means loss of access to all credit for a period of several years:

From Bloomberg: "The poorest quartile of families is the only group that owes more than it owns. Thanks to declines in the value of assets, the group's average leverage ratio -- debt as a percent of assets -- increased to 137.5 percent in 2013, the highest on record since the survey started in 1989."
And there you have it - not only is America not actively delveraging, on the contrary, it is loading up on as much debt as it possibly can (or banks will allow it judging by the decline in mortgage-type debt, driven mostly by supply constraints and qualification factors) until the band snaps and in a perverse circle of illogic, releveraging becomes default becomes deleveraging.
Bloomberg has some ideas here, including commenting on the one observations we have been making since 2011: the relentless rise in installment debt, i.e., student and car loans:
There are various possible explanations for the poorest families' financial predicament. Incomes have declined, making debt burdens look worse. Some previously wealthier people probably migrated into the group as the value of their homes fell below what they owed on mortgages. More ominous is a steady increase in installment debt, a category that includes both student and auto loans -- areas that have recently seen a lot of questionable lending to lower-income borrowers.

Bloomberg's conclusion:
Whatever the drivers, the data suggest that the 2008 crisis and subsequent economic malaise have left a troubling legacy: A group of the poorest families, numbering roughly 14 million, whose precarious finances make them vulnerable to shocks and limit their ability to contribute to future growth. That's hardly a strong foundation for a healthy recovery.
But mass "deleveraging" is good, they said. It means tons of pent up releveraging and recovery, they said...
While the lying is understandable - after all confidence must be rebuilt at all costs - what is worse is that the Fed believes it can withdraw from QEasing because it is convinced that US society as a whole is able to take on more debt, when in reality a record number of Americans are locked out of the debt market (due to recent or imminent defaults) for years. As a result the Fed's entire logic for pulling out of the market is based on an epically flawed assumption. Which is why, as we explained back in late 2013, we give the Fed a few months of POMO-ess shock and awe for the S&P500 mixed with fears of what a rate hike will do to the market, pardon economy, before the Untaper and the reZIRP fully enter the financial lexicon.
Finally, while we have shown this chart in the past, here it is again. It really does explain everything.

Will the Fed Change Course?
by oldprof
(09/14/14) After a number of meetings where the FOMC announcement merely confirmed widespread expectations, this week’s result may be different. I expect everyone to be wondering, Will the Fed change course?
Prior Theme Recap
In my last WTWA I nervously suggested that there would be a surprising focus on individual stocks rather than macro factors. This proved to be a good call, and I even had the right reasons: Apple announcements, Alibaba, and a dearth of economic news. The competing story was the surprising dollar strength at the end of the week.
Feel free to join in my exercise in thinking about the upcoming theme. We would all like to know the direction of the market in advance. Good luck with that! Second best is planning what to look for and how to react. That is the purpose of considering possible themes for the week ahead.
Calling All (Young) Writers
The Financial Times and McKinsey and Company have joined to offer the Bracken Bower Prize for the best proposal for a book on the challenges and opportunities for growth. A prize of £15,000 will be given for the best book proposal. It is also a good way to attract a publisher for your idea. Entries close on September 30th. More information is available here.
This Week’s Theme
The scheduled highlight of this week (despite some competition from Scotland) is the FOMC policy announcement. This is one of the meetings where the Fed updates individual and consensus projections and provides additional transparency with a press conference from the Fed Chair.
The result of the modern transparency efforts is often additional confusion!
Here is what you need to know in advance:
-
The forward guidance language is likely to change. Even the doves on the Fed want to communicate more data dependence rather than a calendar-based forecast. Leading Fed expert Tim Duy explains why this change would be helpful:
The trick is to change the language without suggesting the timing of the first rate hike is necessarily moving forward. The benefit of the next meeting is that it includes updated projections and a press conference. Stable policy expectations in those projections would create a nice opportunity to change the language. Moreover, Yellen would be able to to further explain any changes at that time. This also helps set the stage for the end of asset purchases in October. A shift in the guidance next week has a lot to offer.
- Experts at major firms vary widely in their expectations. Calculated Risk has a good summary.
-
Alan Greenspan spoke to insurance company executives, explaining nine negative points about the economy. He emphasized that none could be easily fixed. Focusing on the topic where he is most expert, here was his take on the upcoming turn in Fed policy:
We have to taper at some point, and things will only turn around once we see commercial and industrial loans tease that money out of the federal system and paid out to the commercial markets. This is a necessary condition for inflation. It is not happening yet. But it will. And when it does, Greenspan says, it will surprise us with how quickly it moves. Be prepared.
Will the Fed change course? What will be the market reaction?
As usual, I have a few thoughts to help with that question. First, let us do our regular update of the last week’s news and data. Readers, especially those new to this series, will benefit from reading the background information.
Last Week’s Data
Each week I break down events into good and bad. Often there is “ugly” and on rare occasion something really good. My working definition of “good” has two components:
- The news is market-friendly. Our personal policy preferences are not relevant for this test. And especially – no politics.
- It is better than expectations.
The Good
There was a lot of very good news, supporting the general thesis of economic strength.
- Q2 GDP growth is getting revised higher. It is “massive” according to this article (Goldman’s estimate is now 4.7%) and it is spilling over to Q3 estimates.
- Deficit reduction in the US. The combination of very slow growth in spending and a brisk increase in revenues has reduced the deficit. Scott Grannis calls the 3% gap “very manageable. His analysis includes this helpful chart:

- Michigan sentiment beat expectations. Doug Short always has a fine analysis of the confidence data and his chart would be a great example for a college class or textbook on data analysis. He shows the data series, the average level, the relationship with GDP and the clear ties to recessions — all in one attractive chart.

- Retail sales met current expectations and beat estimates if you consider revisions. The market, especially fixed income, saw this as economic strength, so that is how I am scoring it. Retail was weak in Q1 and the Q2 rebound was generally disappointing. Last week’s report was a welcome sign of strength. Doug Short’s analysis explains the significant and frequent revisions. Steven Hansen at GEI sees the data as mixed. Bespoke has an interesting angle, with an emphasis on gasoline prices. When fuel prices were spiking, some observers noted that this artificially inflated retail sales with consumption that was actually negative for the economy. Now that we are seeing fuel price decreases it is important to remember that this is a drag on retail sales. Nick Timiraos at the WSJ sees lower gas prices translating quickly into other spending.

The Bad
There was also some negative news, some of which is difficult to translate into a market effect.
- Ukraine conflict turns worse. As I write this, the apparent progress toward a cease fire (noted last week) has ended. Another Russian convoy is entering Ukraine without permission. Shots have been exchanged. Also, the Treasury is expanding sanctions.
- China’s imports have stalled according to the analysis from Dr. Ed Yardeni. Imports are an important indicator of economic strength, so the data are worth following. Dr. Ed is suspicious of the report, however, partly because the data come out so promptly — much faster than other countries. We would all like to know about the Chinese economy, but it remains challenging to follow. For what it is worth, here is the Yardeni chart:

- Labor force participation might not be able to increase much according to recent research by Fed economists. I covered the significance of this issue in a recent WTWA post featuring employment. If there is little potential for increase in LFP, then we are closer to increased wage costs than Fed Chair Yellen expects. Max Ehrenfreund of The Washington Post has a good story and this chart:

- Scottish secession worries. The chance of a “yes” vote on Scottish independence seemed remote a week ago, but the polls have changed dramatically. Here is the betting line via The FT – negative as of Thursday, but very fluid. Here are the implications for investors.
-
Dollar strength is a negative for some stocks. Mohamed El-Erian explains the underlying dynamics, with a nod to the Scottish jitters. The relationship between the dollar and stocks seems to involve dramatic “regime” changes. There are periods of risk off/risk on where the dollar has an inverse correlation with stock prices. The long-term relationship shows stronger stocks aligned with a stronger dollar. Brian Gilmartin does a first-rate job of translating this trend into impacts on specific stocks. Check out his analysis. Here is the key quote:
A strong dollar benefits importers and penalizes exporters, all other elements being equal. I wish I could access the data, but I would guess that, after 2008, and the growth of BRIC’s and such in the last decade, of total US GDP, the US is a larger “net exporter” than say in the late 1990’s when the Asian Tigers collapsed, so prolonged strength in the dollar could have a net-net negative impact on SP 500 earnings over time, if the strength in the dollar is persistent.
The Ugly
Our “ugly” list for the last few weeks remains unfortunately accurate. We had headline news from all conflicts with plenty of violence and death competing for our attention. The Ebola crisis, cited a few weeks ago, continues to worsen. We may have to accept these as the “standing ugly list” so that we can consider new issues. These are all very ugly, but I want this category to be open to new entrants. If I missed something this week, please raise it in the comments!
The Silver Bullet
I occasionally give the Silver Bullet award to someone who takes up an unpopular or thankless cause, doing the real work to demonstrate the facts. Think of The Lone Ranger. No award this week. Nominations are welcome.
Quant Corner
Whether a trader or an investor, you need to understand risk. I monitor many quantitative reports and highlight the best methods in this weekly update. For more information on each source, check here.
Recent Expert Commentary on Recession Odds and Market Trends
Doug Short: An update of the regular ECRI analysis with a good history, commentary, detailed analysis and charts. If you are still listening to the ECRI (three years after their recession call), you should be reading this carefully. Doug includes the most recent ECRI discussion concerning continuing economic weakness in Japan. Doug covers the possible implications for the US.
Bob Dieli does a monthly update (subscription required) after the employment report and also a monthly overview analysis. He follows many concurrent indicators to supplement our featured “C Score.”
RecessionAlert: A variety of strong quantitative indicators for both economic and market analysis. Dwaine’s “liquidity crunch” signal played out as projected. This week he highlights his HILO Breadth index which he has designed to pinpoint bottoms and to warn of protracted corrections. Current readings imply an opportunity that usually shows up only once a year. Check out the full post for a description and charts.
Georg Vrba: Updates his unemployment rate recession indicator, confirming that there is no recession signal. Georg’s BCI index also shows no recession in sight. Georg continues to develop new tools for market analysis and timing. Some investors will be interested in his recommendations for dynamic asset allocation of Vanguard funds.
The Week Ahead
After last week’s avalanche of news, we have a more normal week for economic data and events.
The “A List” includes the following:
- FOMC announcement (W). Taper continues, but what signal for the future of rate hikes?
- Housing starts and building permits (Th). Any change in the sluggish housing market would be welcome.
- Initial jobless claims (Th). The best concurrent news on employment trends.
- Leading indicators (F). Widely followed indicator of economic prospects.
The “B List” includes the following:
- Industrial production (M). Confirmation for the strong ISM surveys?
- CPI (W). At some point the threat of inflation will be relevant, but it will take a few worrisome reports.
- PPI (T). See CPI.
I am not very interested in the Philly Fed, although some follow it as the first release of data from the new month. I am even less interested in the Empire index.
The referendum on Scotland’s independence could be a wild card.
Breaking news from Ukraine and Iraq has become a part of the investment landscape. These stories are having an effect, but are nearly impossible to handicap on a short-term basis.
How to Use the Weekly Data Updates
In the WTWA series I try to share what I am thinking as I prepare for the coming week. I write each post as if I were speaking directly to one of my clients. Each client is different, so I have five different programs ranging from very conservative bond ladders to very aggressive trading programs. It is not a “one size fits all” approach.
To get the maximum benefit from my updates you need to have a self-assessment of your objectives. Are you most interested in preserving wealth? Or like most of us, do you still need to create wealth? How much risk is right for your temperament and circumstances?
My weekly insights often suggest a different course of action depending upon your objectives and time frames. They also accurately describe what I am doing in the programs I manage.
Insight for Traders
Felix remains bullish. Uncertainty is now more modest and is moving lower. Our Felix trading accounts remain fully invested. Broad market ETFs are also positive.
You can sign up for Felix’s weekly ratings updates via email to etf at newarc dot com.
Insight for Investors
I review the themes here each week and refresh when needed. For investors, as we would expect, the key ideas may stay on the list longer than the updates for traders. The current “actionable investment advice” is summarized here. In addition, be sure to read this week’s final thought.
We continue to use market volatility to pick up stocks on our shopping list. We do this because we also sell positions when they reach our (constantly updated) price targets. Being a long-term investor is not the same as “buy and hold.”
Here is our collection of great advice for this week:
Confusing politics with investing is an expensive mistake. The discussion from Tim Mullaney at MarketWatch is well worth reading for the examples. He emphasizes the mistakes from one political perspective, but he tries to make the right generalization:
The point is: Don’t listen to people who tout investments based on their politics. It’s a sure sign they lack the dispassion needed to evaluate securities and make you money.
If you or I were advisors for a political campaign we would always attack the party in power, including all of the policies. This was just as true when the GOP held the Presidency. It is fine to have strong opinions and to use those in voting and in your private discussions. Meanwhile, wouldn’t you prefer to profit no matter who is in power? That is why I recommend being politically agnostic.
Morgan Housel has a great list of things where investors should “know the difference.” Here is a good example:
You should know the difference between average and normal. You should never think “average” is what should be happening right now. The S&P 500 has gone up an average of about 9% a year over the last century. But since 1900, stocks have gone up or down more than 20% in almost twice as many years as they have gained between 5% and 10%. Nine percent is average, but chaos is normal. Same goes for valuations. They’re more likely to be swinging between some state of insanity that no one can justify than hovering near an historic average.
OK – I can’t resist providing a second oneJ
You should know the difference between a contrarian and a cynic. A contrarian knows the masses get it wrong sometimes. A cynic thinks he’s smarter than the masses all the time.
John Woerth at the Vanguard Blog shares a list of mistakes – and also some good moves. Here is one example:
Chasing yield. One of my first fixed income investments was Vanguard GNMA Fund. I was attracted to the high absolute and relative yield and didn’t fully appreciate the principal risk that accompanied the investment. I wasn’t expecting, nor was I accustomed to seeing, the fluctuations in the net asset value of what I naively considered to be a conservative government bond fund. Experience, they say, can be a cruel teacher.
Mistake: Greed and ignorance.
Lesson: Don’t chase yield or past performance. Do your homework and have realistic expectations for the reward and risk potential of any investment that you’re considering.
Tren Griffin at 25iq has A Dozen Things I’ve Learned from Josh Brown – all good. Here is one example:
“The next time you hear someone say we’re overdue for a correction, ask them for a copy of the schedule. Unfortunately, markets are biological rather than mechanical in nature and, as such, precision in timing is nowhere to be found.” A market is more like a cat than a machine. This is what Josh is referring to when he says markets are “biological.” In more technical terms, a market is a “complex adaptive system” and for that reason trying to make short term predictions about the future is folly. If you want to be an “active” investor I suggest a value investing approach: the occurrence of certain types of events over the long term (change in a stock price) within your circle of competence can occasionally be predicted in a way that gives you odds that are substantially better than even – but that happens rarely. When it does happen, bet big. The rest of the time, don’t bet. Accept this fact of life sooner rather than later, and you will be wealthier and happier.
Instead of worrying about market valuation, look for cheap stocks, writes Patrick O’Shaughnessy. (This was one of my themes at the SF Money Show. I know, I know. I am overdue in trying to turn this presentation into blog posts). He uses Apple’s stock as an example, with this chart:

Some are not seeking opportunity because they are worried about possible market declines. If that is your situation, you have plenty of company. This is one of the problems where we can help. It is possible to get reasonable returns while controlling risk. You can get our report package with a simple email request to main at newarc dot com. Also check out our recent recommendations in our new investor resource page — a starting point for the long-term investor. (Comments and suggestions welcome. I am trying to be helpful and I love and use feedback).
Final Thought
This week brought some pushing back against the “Fed haters.” Maybe it was the extra time to muse that I highlighted in last week’s WTWA!
Here are two examples:
- Cordell Eddings notes that potential bond investors missed a $1 trillion return.
-
Joe Weisenthal wrote provocatively that it might be the “final humiliation” of the Fed haters. This earned him a CNBC debate with Peter Schiff where they employed the instant scoring feature. You can watch it yourself and cast your own vote. Weisenthal wrote as follows:
Over the last several years, anti-Fed “policy bears” have been warning about how the extraordinary steps taken to juice the economy would end in disastrous.
Some predicted surging interest rates. Some people predicted runaway inflation. And a lot of folks said that the Fed was murdering the dollar.
Well, none of that has happened. And not only that, the dollar is one of the strongest currencies in the world.
The CNBC debate, where Schiff scored a narrow victory, tells us more about the audience than the merits of the arguments. There are two distinct time frames for consideration.
- In the short-term, trader time frame there will be a jump in interest rates, including the long end of the curve, with any hint of an accelerated change in Fed policy. The long end, while not directly controlled by the Fed, does react to expectations and the term structure of rates. Related impacts include a stronger dollar and weaker stocks. Mark Gilbert notes that traders tend to over-react.
- In the long term, the Fed policy change is a data-dependent reflection of a stronger economy (assuming that it is not driven by inflation fears). Modestly rising rates are not a threat for stocks as long as the economy is strengthening.
This means that traders must be nimble, prepared to shift with perceptions. Investors who understand the background may get an opportunity to buy another dip. If it reflects recent history, the dip may be shallow.

Subscribe to:
Comments (Atom)