Thursday, February 3, 2011

Top Earnings Season Triple Plays

by Bespoke Investment Group

Each earnings season we put an emphasis on the companies that have reported triple plays.  These companies beat earnings estimates, beat revenue estimates, and raise guidance.  We consider these stocks the cream of the crop of earnings season, and we find many of our new long positions from this group each quarter.
So far this earnings season, 55 companies have reported triple plays, which is 8% of the total companies that have reported.  A list of all 55 companies is provided on the last page of this report.
We went through the price charts of each of these 55 stocks and found the ones that we believe currently look the most attractive based on their chart patterns.  Ten of the 55 stocks stood out the most to us, and they are listed below.  We provide charts and company descriptions for each name on the following pages.  Not only do these names have strong technicals, but they also have positive momentum on the fundamental side because of their strong earnings reports.  If you’re looking for names to get long, we believe this list is a good place to start. [..]

Continue reading this article >>

Data points to stronger growth momentum

By Lucia Mutikani

(Reuters) - Growth in the U.S. services sector in January was the fastest in more than five years, another sign the economy started 2011 on a solid footing, with measures of employment showing more strength.

Reports on Thursday, including a sharp fall in weekly claims for jobless benefits, painted a more bullish picture for the world's biggest economy as it recovers from the worst recession since the Great Depression.

U.S. inflation pressures appeared mostly under control even as commodity prices surge -- in stark contrast with other parts of the world -- helped by U.S. businesses keeping a tight grip on labor costs, the largest expense for most companies.

"Momentum from the end of 2010 is carrying over. It will be another year of recovery and repair," said Robert Dye, a senior economist at PNC Financial Services in Pittsburgh.

The Institute for Supply Management's index of national non-manufacturing activity rose to 59.4 last month, its highest level since August 2005, from 57.1 in December.

Economists had expected a dip to 57.0.

A reading above 50 indicates expansion in the service sector, which accounts for more than 80 percent of U.S. jobs, and it was the 14th straight month of growth.

The surprise pick-up in growth, which mirrored a similar acceleration in U.S. manufacturing in January, was further confirmation that the economic recovery was broadening.

Federal Reserve Chairman Ben Bernanke on Thursday acknowledged the improvement in the recovery but said the economy still needed help, citing persistently high unemployment.

The U.S. central bank is committed to buying $600 billion of government bonds by June to stimulate the economy further.

"Even so, with output growth likely to be moderate for a while and with employers reportedly still reluctant to add to their payrolls, it will be several years before the unemployment rate has returned to a more normal level," Bernanke told the National Press Club in Washington.

A surge in consumer spending lifted the economy to a 3.2 percent annual growth rate in the fourth quarter of 2010, quickening from a 2.6 percent pace in the three prior months.

STRENGTHENING DEMAND WILL BOOST JOBS

Economists believe strengthening domestic demand will translate into increased hiring.

A Labor Department report showed new claims for state jobless benefits fell 42,000 to a seasonally adjusted 415,000, unwinding most of the previous week's weather-induced spike.

Economists had forecast claims dropping to 420,000.

The claims data falls outside the survey period for the closely watched payrolls report for January, due on Friday.

The economy probably created 145,000 jobs, according to a Reuters poll, after adding 103,000 in December. Reports on Wednesday suggested private hiring was gathering pace.

Expectations for a pickup in job growth were bolstered by a jump in the ISM's employment gauge to its highest since May 2006.

The data had little impact on U.S. financial markets. Stock market investors were more worried about increasing chaos in Egypt. U.S. stocks fell and prices for government debt also traded lower. The dollar rose against a basket of currencies.

The improving U.S. economic picture was underscored by retailers posting a 4.2 percent rise in sales, handily beating Wall Street expectations for a 2.7 percent gain.

Sales grew strongly despite the snowiest January in six years.

Heavy snow and cold weather slowed the downward trend in initial jobless claims by causing a backlog in applications but economists believe they will soon drop below 400,000, a level believed to signal strong job growth.

"We think the trend in claims is coming down because small firms are firing fewer people. With credit now easing we are hopeful claims will fall significantly further over the next few months," said Ian Shepherdson, chief U.S. economist at High Frequency Economics in Valhalla, New York.

A second Labor Department report showed that although businesses faced rising input costs, they kept labor costs down by wringing more from workers, helping keep inflation muted.

Nonfarm productivity, a measure of hourly output per worker, rose at an annual rate of 2.6 percent in the fourth quarter after rising at a 2.4 percent pace in the third quarter.

The increase, which was well above economists' expectations for a 2 percent growth rate, bodes well for company profits.

Unit labor costs, a gauge of potential inflation pressures closely watched by the Fed, fell at a 0.6 percent rate after dipping 0.1 percent in the third quarter.

"It's showing that even though we are seeing some sector-specific inflation among businesses that are exposed to commodities, that is not threatening to cut into profits," said PNC Financial Services' Dye.

Dye said he did not expect the rise in commodity prices to feed into so-called core inflation, which the Fed monitors, as overall economic conditions still remained slack. Core inflation strips out volatile food and energy costs. [..]

Continue reading this article >>

Uranium Prices Continue to Surge

By Dave Brown

The spot market price for uranium climbest almost 3 percent from the previous week, reaching $70.00 per pound, according to the Ux Consulting Company. On January 21, TradeTech had reported a $2.50 increase to $69.00 per pound, which was the highest level reported since April 2008, with strong signals that the spot market price might break the $70.00 threshold. The reports of missed production targets from several producers, including the January 20 Paladin Energy Ltd. (TSE:PDN) (ASX:PDN) announcement, have already exerted upward pressure on the price.  Paladin Energy announced that its 2011 operational target was reduced 14 percent due to production delays at its Kayelekera project in Malawi and Monday's news of Denison Mines (TSE:DML) (AMEX:DNN) scaling down production for the year should escalate this effect on near term pricing forecasts.
Following the Denison announcement of a 17 percent reduction in production estimates, the market responded very strongly sending the stock price into the $3.85 range, an increase of approximately 11 percent over the previous trading session. Denison expects that uranium production should total 1.2 million pounds from ore in stockpile and from the Beaver, Pandora and Arizona 1 mines as well as production from the alternate feed circuit at the White Mesa Mill in the United States. Vanadium production is projected to total approximately 2.2 million pounds. The company will focus its efforts on exploration as it looks to boost production to at least 10 million pounds a year by 2020.  Denison will spend $8.8 million on exploration in 2011, including $6 million at Wheeler River in the uranium-rich Athabasca Basin of Saskatchewan.

Bullish tone for uranium from President's State of the Union address

President Obama called for low-carbon energy, including nuclear sources, to provide 80 percent of America's electricity by 2035, in a State of the Union speech that stressed the need for new innovation and direct investment in energy technology. Focusing on several transformative energy related “Apollo projects of our time,” Obama mentioned one initiative at the Oak Ridge National Laboratory, which he indicated utilizes “supercomputers to get a lot more power out of our nuclear facilities.”
President Obama, House Speaker John Boehner and members of Congress on both sides of the aisle have identified nuclear energy as an area of potential cooperation, a notion that continued in congressional reaction to the President's clean energy portfolio. Meeting an 80 percent clean energy goal by 2035 is ambitious; however, if current and successive administrations become increasingly involved in working with a cooperative congress in bipartisan discipline, a national energy policy could mean excellent potential returns for uranium industry stakeholders and investors.

Regulatory safety review

Last week a team of international nuclear safety experts completed a two-week International Atomic Energy Agency (IAEA) review of the regulatory system for nuclear safety in Romania.

The team was comprised of experts from 12 countries: Canada, the United States, France, Germany, the United Kingdom, Ireland, Brazil, South Korea, Slovakia, Slovenia, Bulgaria, and Ukraine.  They highlighted the Romanian system's most effective features and suggested areas of improvement for the country´s nuclear regulatory authority. The IAEA has conveyed the team's main conclusions, and a final report will be submitted to the authority in about two months.

The mission was a peer review based on the IAEA Safety Standards and was not an inspection or an audit, and it builds upon earlier safety reviews that Romania has requested over the past several years. The scope covered the Romanian nuclear regulatory framework for all types of facilities and was conducted from January 17  to 28. The IAEA team coordinator David Graves said, "I've been pleased by Romania's openness and transparency. The country has a strong history of inviting IAEA safety review missions, setting a good example for the international community." [..]

Have reached their targets?

Qui a lato riportiamo i grafici di Cotton, Euro Bund, Heating Oil e British Pound,  i cui prezzi si stanno avvicinando ai target dei rispettivi cicli in essere. A questo si accompagnano alcune divergenze negative che potrebbero portare ad ritracciamento dei prezzi dagli attuali massimi di periodo.

Here we report the charts of Cotton, Euro Bund, Heating Oil and British Pound, whose prices are approaching the the target of their cycles in place. This is accompanied by some negative divergences which could lead to a prices retracement from the current high


Two Sell Short Set-up With Very Low Risk

Due set-up di vendita con rischi contenuti su Soybeans e Soybean Meal, sulle cui chart giornaliere continuano le divergenze negative. Vendere sotto i minimi di mercoledì con rigido Stop Loss sopra il massimo di ieri. Cancellare gli ordini nel caso i prezzi salgano sopra il valore di Stop loss.


Two Sell Short set-up with very low risk on Soybeans and Soybean Meal, on which daily chart continue the negative divergence. Selling below Wednesday minimum with hard stop loss above the yesterday high. Cancel orders if prices rise above the value of stop loss.

Commodities Reach Two-Year High as Global Growth Drives Demand

By Stuart Wallace and Claudia Carpenter

(Bloomberg) -- Commodities, last month’s best- performing asset class, jumped to their highest in more than two years on prospects for strengthening demand and shortages as global growth improves and extreme weather destroys crops.

The Standard & Poor’s GSCI Total Return Index of 24 commodities rose as much as 0.6 percent to 5,152.9 points, the highest since November 2008. The gauge was at 5,151.7 as of 10:41 a.m. in London. Cotton, rubber and copper rose to records and Brent crude oil advanced for a fifth day to $102.64 a barrel, the most since September 2008.

Commodities have risen for five consecutive months, the longest winning streak since 2004, bolstered by an improving economic outlook. Raw materials also advanced as drought in Russia, flooding in Canada and a cyclone in Australia ruined crops and as protests across the Middle East spurred concern about supply disruptions.

“What is new is that the fundamentals are getting tighter and the political risk premiums are increasing for energy and agriculture,” said Jean-Marc Bonnefous, a co-founder of London- based Tellurian Capital Management LLP, which invests in energy, metals and agriculture.

Copper for delivery in three months rose as much as 0.6 percent to $10,000 a metric ton on the London Metal Exchange today, extending this year’s advance to 4 percent. Aluminum, zinc, tin, lead and nickel also gained.

Supplies of copper, nickel and tin will all fall short of demand this year, according to Barclays Capital. A decade-long boom in commodities may last “a couple of years” longer before supply catches up with demand, billionaire investor George Soros said in an interview in Davos, Switzerland on Jan. 27.

Rubber Futures

Rubber futures traded on the Tokyo Commodity Exchange gained as much as 3.8 percent to an all-time high of 490.2 yen a kilogram ($6,004 a ton) as rain in Thailand, Indonesia and Malaysia, the top three growers, curbed output.

Brent crude rose for a fifth day in London as protests in Egypt turned violent, prompting concern that supplies will be disrupted and unrest may spread to other parts of the Middle East. Egyptian President Hosni Mubarak has faced a week of unrest. Protesters were also gathering in the Yemeni capital of Sana’a today and Jordan’s King Abdullah replaced his prime minister this week.

“All eyes in the oil market are on the riots and protests in Egypt right now,” said Robert Montefusco, senior broker at Sucden Financial in London. “That’s keeping prices strong, though there hasn’t been any disruption to supplies.”

Suez Canal

Egypt’s Suez Canal is open and operating normally today, Ahmed El Manakhly, head of traffic for the Suez Canal Authority, said by phone. About 50 ships were transiting yesterday and the same number is expected today, he said.

Raw sugar was little changed in New York trading after jumping to a 30-year high of 36.08 cents a pound yesterday. Sugar cane plantations in Australia, the third-largest exporter, suffered severe damage after Tropical Cyclone Yasi cut through an area accounting for a third of output.

“We are going to see a massive reduction in the amount of sugar that region produces,” Steve Greenwood, chief executive officer of Brisbane-based producers group Canegrowers, said today on Bloomberg television.

World food prices surged to a record last month, led by increases in costs for dairy products, the United Nation’s Food and Agriculture Organization said in a report today.

Continue reading this article >>

CLEAR CAPITAL: HOME PRICES STABILIZED IN JANUARY

by Clear Capital

The latest housing report from Clear Capital shows some signs of life in the housing market (via Clear Capital):
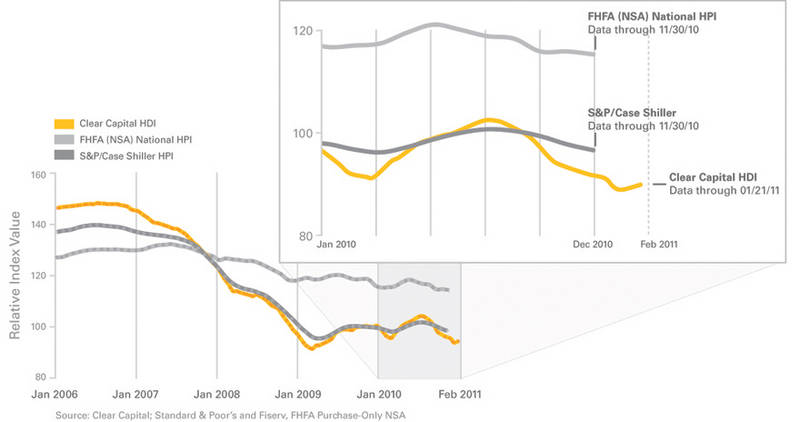
The HDI Market Report provides the most current (through January 2011), granular and relevant analysis of how local markets performed compared to the national trend in home prices. Clear Capital’s latest release of its Home Data Index shows that U.S. home prices stopped declining in early January and have posted their first uptick since mid-August 2010.
“This recent national change in price direction is encouraging for the overall housing sector, yet it is still too early to determine whether this current uptick in home prices is a temporary reprieve or the start of a sustained recovery,” said Dr. Alex Villacorta, senior statistician at Clear Capital. “This uptick is the first non-incentivized change in prices we’ve seen since the downturn began, and could provide great opportunity for buyers, sellers and investors alike. Although many markets still remain under significant downward pressure in light of increased distressed sale activities, it is clear that the severity of the downturns observed in October and November have subsided.”
Turning of the Tide: Signs of upturn in U.S. home prices
Using sale transactions up through January, the HDI shows national home prices have turned the corner on their most recent decline. This change toward the positive for home prices is the first since mid-August, and signals the end of the pronounced price declines first observed by Clear Capital back in October and reported on more recently by the S&P/Case-Shiller 20 index as well as FHFA’s non-seasonally adjusted national index. Furthermore, this observed change in prices is especially meaningful as the first months of the year are typically affected by the seasonal slowdown in sales activity, suggesting that buyer demand may be returning in anticipation of a potential start to a sustained recovery.
Prices Experience Positive Start to 2011
  • Since Jan. 1, 2011, national home prices have experienced the first positive gains since mid-August 2010 (0.9% in the first three weeks of 2011).
  • National quarterly decline of 1.6 percent is a significant improvement from November’s quarterly decline of 5.8 percent, further indicating a halting of price drops.
  • The year-over-year national decline continued downward, but only marginally, with the yearly price change reaching -4.3 percent through January, down from the -4.1 percent reported last month.

WHEN WILL THE BALANCE SHEET RECESSION END?

by Cullen Roche

Despite the seemingly strong activity in the economy in recent months there is trouble lurking beneath the surface.   Don’t get me wrong – we have a real recovery on our hands, however, it remains fragile and largely driven by government intervention.  Beneath the surface the balance sheet recession lurks.
As the housing bubble grew the US economy experienced an unprecedented growth in debt.  This generated an imbalance as debt levels far outstripped disposable income.  This environment was sustainable as long as asset prices continued to climb, however, once prices deteriorated debtors were left with an imbalance.  As a result, a balance sheet recession ensued as demand collapsed under the weight of households who preferred to pay down debts rather than spend.  The impact is magnified by corporations that cut costs (read, fire workers) as demand collapses and they attempt to protect margins.  Real sustainable recovery cannot ensue until the indebted sector of the economy returns their balance sheet to a state of normalcy.
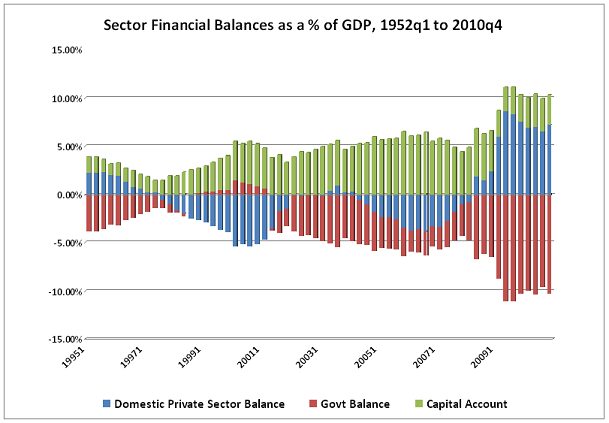
The government’s response to the crisis was massive and far more effective than most presumed.  But it was not a cure.  It was merely a temporary fix.  The following updated sectoral financial balances diagram shows what has occurred over the last 15 years.  It’s undeniable that the government response via huge deficits is having a positive impact on the private sector balance sheet:

(Figure 1)
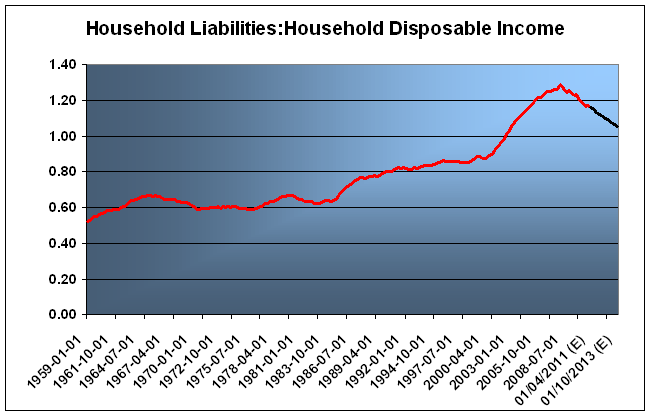
The bright side is that things could have been much worse.  Even better, we haven’t fallen for the fear mongering from the  hyperinflation/USA is bankrupt crowd who are helping to cause so much destruction in the nations of Austeria.  The problem is that this government intervention is not a cure.   Aggregate household debt levels are still too high as evidenced by the debt:disposable income levels (see figure 2).  This means we could still be several years from sustained private sector growth.  As I like to say, the public sector is not yet ready to pass the baton to the private sector.
(Figure 2)

At the current trajectory it’s not unreasonable to assume that the balance sheet recession will last well into 2012 and potentially  longer.  While a 1:1 ratio is “sustainable” by my estimates, it would be comforting to see levels closer to the historical levels in the 80% range.  If that is the case we could see the impact of the balance sheet recession persist far longer than anyone believes. The obvious upside risk is a dramatic improvement in the labor market.  On the other hand, our government is now explicitly encouraging fiscal imprudence in an attempt to “keep asset prices higher than they otherwise would be”.  This sort of policy has the very real potential to increase instability and turn recovery into bubble.  Other exogenous risks (Europe, China, housing prices, etc) also pose substantial risks to the downside.  For now, I think it’s safe to assume that the recovery will remain fairly fragile well into 2012, but given the size of the deficit and potential for labor market improvement we could see continued economic strength.
In sum, it’s clear that government intervention has been sufficient to defer the negative effects of the balance sheet recession.  In the near-term, that is a net positive, however, the risks are substantial.  If the balance sheet recession persists into 2013 or longer then the obvious risk is a substantial decline in the deficit.  Austerity would almost certainly expose an overly indebted household sector and send the economy back into a tailspin.  With the deficit projected to be $1.5T this year it’s comforting to know that we are not repeating the mistakes of Japan, however, it’s important that we not get too complacent as the balance sheet recession lurks underneath a seemingly rosy surface. [..]

WHERE CAN VIX FUTURES GO?

by Surly Trader

Since we have seen a very steady decline in VIX futures across the curve, I thought it was an opportune time to look at how VIX futures behaved in the last few years.  It is hard to say that we will decline back to pre-2007 levels considering the crisis we have been through, the huge government deficits, and the continued weak employment levels and housing market.  That being said, I think it is good to get a perspective of what I believe would be a floor to what we should expect.
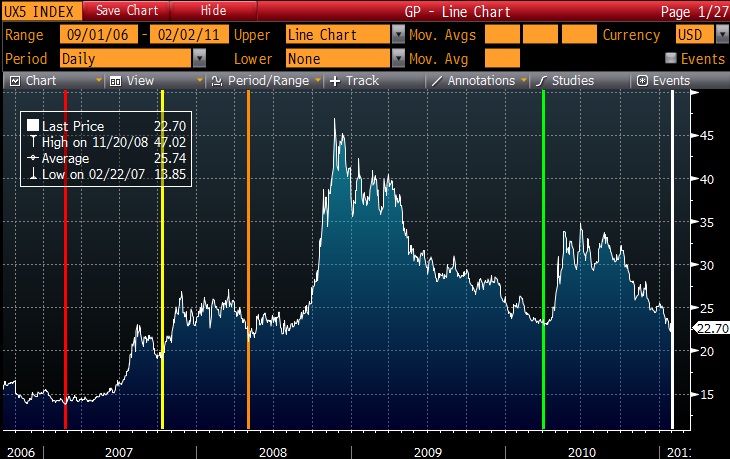
By looking at the 5th month VIX futures contract over time, I pinpointed a few different spots in the last couple of years that I thought would be interesting to look at relative to today.  Each point marked a low within its own slice of time:

What a wild ride vol took

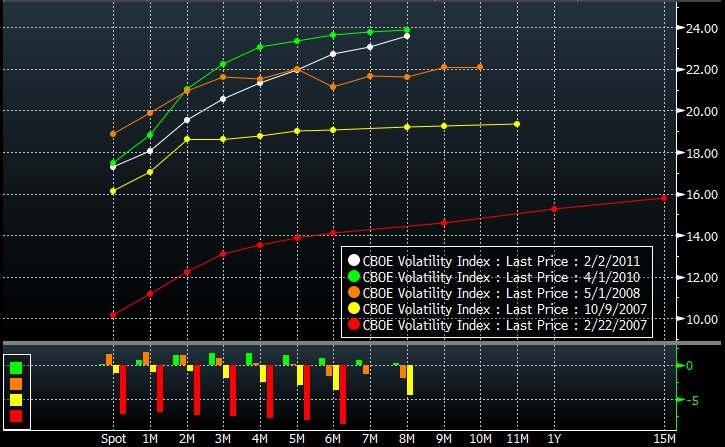
With these spots in time marked, now we need to dive into what the VIX futures curve looked like at the time:

An outlier and clustering

Some observations from the above data:
  • First: The most obvious observation is that early 2007 was leaps and bounds lower than the other observations.  That time period was marked by stable and calm markets with little relative price risk.
  • Second: The other4 curves are fairly clustered, possibly giving some credence to the idea that the October 2007 levels could act as a floor in the near term.
  • Third: The lows in ’07 and ’08 were marked by a much flatter curve.  Even though May 08 was elevated, there was little spread between maturities
  • Fourth: Current levels are lower than our 2010 lows pre-Eurozone crisis
  • Fifth: The most important observation in my mind is that the front part of the current curve almost looks cheap at these levels.
This information is rather subjective since I chose the points that I thought would be most indicative for comparison,but I think it does provide some perspective on our current VIX curve.  In my opinion, the 17-18 front vol looks fairly cheap compared to the past, especially if you believe that a reversion to 2006-2007 volatility levels will not happen in a straight line.   It would also seem to make sense that if we believe that the calm markets will persist for the next few months, then we should expect the current curve to flatten out significantly.  A curve flattener position in which you are long the front months and short the further out months would make most sense in that situation as long as you do not believe the VIX index is headed to 10%…. [..]
Continue reading this article >>
Survivor Trading System - Trades of 2 February

I trades di Survivor System del 2 February. I risultati real-time sono a disposizione al seguente link: http://www.box.net/shared/5vajnzc4cp  


Trades of Survivor System on 2 February. Real-time results are available at the following link: http://www.box.net/shared/5vajnzc4cp 

Follow Us