Wednesday, April 16, 2014

Soaring Food Inflation Full Frontal: Beef, Pork And Shrimp Prices Soar To Record Highs

by Tyler Durden

We previously noted that both beef and pork (courtesy of the affectionately named Porcine Epidemic Diarrhea virus) prices have been reaching new all time highs on an almost daily basis. It is time to update the chart. Below we show what a world in which the Fed is constantly lamenting the lack of inflation looks like for beef prices...

... pork

... and shrimp.

More from Bloomberg:

Prices for shrimp have jumped to a 14-year high in recent months, spurred by a disease that’s ravaging the crustacean’s population. At Noodles & Co., a chain with locations across the country, it costs 29 percent more to add the shellfish to pastas this year, and shrimp-heavy dishes at places like the Cheesecake Factory Inc. are going up as well.

Restaurant chains, already struggling with shaky U.S. consumer confidence, are taking a profit hit as prices climb. Even worse, the surge is happening during the season of Lent, when eateries rely on seafood to lure Christian diners who abstain from chicken, beef and pork on certain days.

“It’s coming at a tough time for the industry,” said Andrew Barish, a San Francisco-based analyst at Jefferies LLC. “With the Lenten season, what you’ll see out there is a lot of promotions with seafood, and usually shrimp is a big part of that.”

In March, shrimp prices jumped 61 percent from a year earlier, according to the U.S. Bureau of Labor Statistics. The climb is mainly due to a bacterial disease known as early mortality syndrome. While the ailment has no effect on humans, it’s wreaking havoc on young shrimp farmed in Southeast Asia, shrinking supplies.

***

James Johnson, a Jewel-Osco supermarket shopper in Chicago, has noticed the price increase. He’s been cutting back on one of his favorite dishes -- shrimp and potato soup -- because of the cost.

“I haven’t made it in a while,” the 29-year-old said. “Shrimp looks expensive.”

***

At Noodles, it now costs $3.34 to add the shellfish to a meal of pasta or pad thai, compared with $2.59 last year.

“We still want to at least offer it as choice,” Chief Executive Officer Kevin Reddy said in a phone interview. “As soon as the costs begin to normalize, we’ll return to the regular price.”

Ah yes, because retailers are always so willing to lower costs...

So for all those whose sustenance includes iPads and LCD TVs, or heaven forbid the pink slime known as fast food - you are in luck: the BLS' hedonic adjustments mean the rate of price increase in your daily consumption has rarely been lower. For everyone else: our condolences.

* * *

Update: Eggs too.

See the original article >>

Petroleum inventory numbers slightly above expectations

By Dominick Chirichella

The evolving geopolitical situation surrounding the Ukraine is continuing to keep oil prices well bid in spite of a bearish fundamental data point in last night’s API inventory report as well as mediocre data out of China. Although oil is not currently an issue in the Ukraine the escalation of this situation could result in new tighter sanctions against Russia which could in fact impact the flow of oil out of Russia… one of the largest exporters in the world. The market has been slowly building in a risk premium associated with this situation lasting considerably longer and possibly turning into round two of the cold war between Russia and the U.S.

On the other end of the world the latest data hitting the media airwaves out of China was mediocre but better than expected. China’s economy expanded at the weakest pace in the last year and a half as the main economic growth engine of the world seems to be on a path of missing their 2014 objective of 7.5 percent GDP growth target. GDP increased by 7.4 percent in Q1 compared to a year earlier. The headline GDP number was slightly above the market expectations of 7.3 percent growth.

The slowest growth rate in the last year and a half is starting to impact oil consumption in China as most of the indicators are currently suggesting that the number one oil demand growth engine of the world may not hit the growth targets recently forecast by the three main oil forecasting agencies … IEA, EIA and OPEC.

Overall the latest out of China is biased to the bearish side for oil adding to the bearish snapshot from the API data yesterday. The API data (see below for a more detailed discussion) reported a 7.6 million build in crude oil stocks with a 640,000 barrel draw out of Cushing. The more widely followed EIA data will be released at 10:30 AM this morning. There is ample crude oil available in the world with no indications of a shortage anywhere.

In addition the first cargo from Libya (since the deal last week) is ready for loading at the port of Hariga. The ship is scheduled to load today and then exported to Italy. The 1 million barrel cargo may be the beginning of a very slow return of Libyan oil returning to the marketplace.

The WTI (NYMEX:CLK14) contract is certainly getting a boost (especially relative to Brent) due the draw in crude oil stocks in Cushing. Cushing stocks have declined close to 15 million barrels since January but the total level is still about 5 million barrels above the pre-surplus five year average. Cushing is quickly becoming part of the US Gulf region and not simply a standalone location. Oil can now easily flow into and out of the region.

There is no reason for concern over the destocking of crude oil in Cushing as what has been removed from Cushing is simply part of the surplus that has accumulated and is un-needed to meet normal operating requirements of the region. The forward curve remains in a backwardation suggesting inventories should be reduced even further as the industry looks for a stable operating level for the region… which I estimate to be around 21 to 22 million barrels.

The June Brent/WTI spread is narrowing slightly in overnight trading on the API reported draw in Cushing stocks. The spread is currently trading in the middle of its technical trading range of $5/bbl on the support side and about $7/bbl on the resistance end. I continue to expect the spread to return to its pre-surplus normal trading level of WTI trading at a small premium to Brent. However the path to normalization is likely to be choppy during the spring refinery maintenance season in the US.

Global Equities were mostly higher around the world but the EMI Global Equity Index was dragged lower from a strong decline in the Brazilian market. The EMI Index declined by 0.29 percent widening the year to date loss to 2.4 percent. Japan staged a strong rally on a continuation of stimulus and on better than expected GDP data out of China. Japan still remains the worst performing bourse in the Index with Canada continuing to hold the top spot on strong oil prices. Global equities were a mixed price driver for the oil complex over the last twenty four hours.

Wednesday's API report was biased to bearish side as total crude oil stocks increased strongly while refined product inventories were lower. The data is reflective of normal operation of the Houston Ship Channel during the report week. Crude oil imports into the US increased by 182,000 barrels per day with refined product exports from the US likely increasing from the Gulf region. Total inventories of crude oil and refined products combined were higher on the week.

The oil complex is trading higher as of this writing and heading into the EIA oil inventory report to be released at 10:30 AM EST today. The market is usually cautious on trading on the API report and prefers to wait for the more widely watched EIA report due out this morning.

Crude oil stocks increased by 7.6 million barrels.  On the week gasoline stocks decreased by 0.5 million barrels while distillate fuel stocks decreased by 1.1 million barrels. Refinery utilization rates increased by 0.2 percent.

The API reported Cushing crude oil stocks decreased by 640,000 barrels for the week. The API and EIA have been very much in sync on Cushing crude oil stocks and as such we should see a similar draw in Cushing in the EIA report. Directionally it is slightly bearish for the Brent/WTI spread.

My projections for this week’s inventory report are summarized in the following table. I am expecting another modest build in crude oil stocks as the spring refinery maintenance season picks up momentum. I am also expecting a small draw in gasoline inventories and in distillate fuel last week with refinery run rates decreasing slightly last week.

I am expecting crude oil stocks to increase by about 1.7 million barrels. If the actual numbers are in sync with my projections the year over year comparison for crude oil will now show a deficit of 1.8 million barrels while the overhang versus the five year average for the same week will come in around 18.5 million barrels.

I am expecting crude oil inventories in Cushing, Ok to be about unchanged to increase slightly even as outflow from the region increased last week. The throttling back of refinery utilization rates in the PADD 2 region is likely to result in a reduction in crude oil demand and thus a backing up of crude oil inventories in both PADD 2 and Cushing which is bullish for the Brent/WTI spread.

The Keystone Gulf Coast line increased its pumping rate strongly after an unscheduled maintenance shut-down during the previous week. The line is once again back above the 300,000 bpd level for the week ending April 11. Genscape is reporting a flow of 354,666 bpd or an increase of 141,247 bpd compared to the previous week. Last week the Keystone line moved about 2.5 million barrels of crude oil out of Cushing or about 1 million barrels more than the previous week. TransCanada said it expected an average of 400,000-500,000 barrels of oil per day to flow through the pipeline in April. With large increase in the outflow pipeline rate around Cushing there will likely be a draw on crude oil stocks in this Cushing area in this week’s round of reports.

According to the latest data from Genscape (for more information on Genscape data products visit their website) the pipeline outflow from Cushing increased strongly as the Keystone Gulf Coast came back from unscheduled maintenance with a bang. For the week ending April 11th total net outflow from Cushing increased by an average of 172,232 bpd (mostly due an increase on Keystone). This was the first week out of the last six weeks that the outflow out of Cushing increased.  Seaway pipeline averaged 312,575 bpd for the week ending April 11th and is back above the 300,000 bpd level. The inflow into Cushing also increased strongly by 152,961 bpd with the largest increase on the Keystone to Cushing line. The Hawthorn pipeline was active last week as rail movements into this area were flowing once again.

I am expecting a modest build of crude oil stocks in PADD 3 (Gulf) of over 1.5 million barrels which will set another new record high inventory level.

With refinery runs expected to decrease by 0.1 percent and with the industry working down its stocks of winter grade gasoline I am expecting a modest draw in gasoline stocks. Gasoline stocks are expected to decrease by 0.7 million barrels which would result in the gasoline year over year deficit coming in around 7.5 million barrels while the deficit versus the five year average for the same week will come in around 4.4 million barrels.

Distillate inventories are projected to decrease by 1 million barrels as exports of distillate fuel out of the US Gulf continue while heating demand last week was slightly above normal on colder than normal weather along the east coast. If the actual EIA data is in sync with my distillate fuel projection inventories versus last year will likely now be about 3 million barrels below last year while the deficit versus the five year average will come in around 24.1 million barrels.

The above table compares my projections for this week's report with the change in inventories for the same period last year. As you can see from the table last year's inventories are not in directional sync with the projections. Thus, if the actual data is in line with the projections there will be modest changes in the year over year inventory comparisons for everything in the complex.

I am maintaining my oil view at neutral and my bias at neutral as the market digest the evolving situation in the Ukraine while awaiting news of Libyan oil possibly flowing once again. I continue to suggest that you remain cautious on Libya until oil is consistently flowing once again.

I am maintaining my Nat Gas view at neutral and my bias at neutral as the market moved back into a higher trading range ahead of the upcoming lower demand shoulder season. The Nat Gas spot Nymex contract remains in the $4.30/mmbtu to $4.70/mmbtu trading range.

Markets are mostly higher heading into the US trading session as shown in the following table.

See the original article >>

Crude Alert: Gartman Is Now Long Oil

by Tyler Durden

Having been stopped out of his "long punt" in copper futures (which are, we remind readers, levered via margin and not a simple cash percentage loss of capital), world-renowned (for something) Dennis Gartman has issued his latest missive - ultimate contrarian call - advice... "we are sellers this morning of copper and buyers of crude oil, one relative to the other, with the problems in China weighing upon the former while crude has held impressively as other commodity prices have fallen." Crude oil longs beware... prepare to be Gartman'd.

Via Dennis Gartman,

We were stopped out of our copper position yesterday, losing 1.2% on the position, which when compared to the 10-15% movements we’ve seen recently in NFLX or TSLA or others such as that seems rather inconsequential but is important nonetheless. Those not out should be out... now.

[deflecting the futures-contract - and thus 10-20x levered via margin - 1.2% loss in copper with a 10-15% gain in unlevered risk positions in NFLX and TSLA (a magical catch we suppose) seems a little disingenous to us - but we digress]

NEW RECOMMENDATION: Indeed, we are sellers this morning of copper and buyers of crude oil, one relative to the other, with the problems in China weighing upon the former while crude has held impressively as other commodity prices have fallen. As we write, June WTI crude is trading 103.79 and July copper is trading $3.0010. We’ll have stops in tomorrow’s TGL, but we’d not wish to risk more than 2% on this rather unusual spread position.

++++++

Of course, there is no discussion of beta differentials... relative tick sizes, or capital allocations to this 2-legged strategy that a real-world trader would have to undertake - but then at $29.99 you get what you pay for...

As a reminder this long oil, short copper trade is the most consensus trade that exists currently (as we noted here)...

Oil spec longs at record highs...

Copper spec shorts at record highs...

See the original article >>

Investors Warming Up To Equities Late As Usual

by Lance Roberts

An interesting article this morning via Investment News caught my attention:

"After watching the stock market climb from peak to peak last year, investors are finally starting to warm up to equities.

More than 85% of investors are feeling optimistic about the investment landscape, and 74% think stocks have the greatest potential of any major asset class, according to a survey of 500 affluent investors released Monday by Legg Mason Global Asset Management. The survey was conducted in December and January.

The survey also shows that investors still hold relatively conservative portfolios, but are increasingly willing to increase exposure to international assets."

This is not a surprising survey by any measure. In fact, it is typical of what you would expect from a group of individuals whose investment decisions are primarily driven emotional behavior rather than a disciplined investment process.

“At the time this survey was conducted, investors had experienced in the U.S. a pretty positive stock market,” said Matthew Schiffman, managing director and head of global marketing at Legg Mason Global Asset Management. “Markets are typically forward looking, while investors are typically backward looking.”

Investors are indeed backward looking as shown below. The Investment Company Institute (ICI) began tracking flows into equity funds in 2007 which I have overlaid with the investor psychology cycle. In this manner, you can witness investor behavior in "real time."

However, the idea that individual investors are still "out of the market" should be taken with a bit of caution. The chart below is data compiled by the American Association of Individual Investors (AAII) which surveys it membership on portfolio allocation.  The data is compiled and released monthly.

With cash hovering at the lowest levels since the "Tech Wreck," and equity exposure at the highest, investors are more than just "warming up" to equities. They are effectively "all in" with respect to the financial markets. An analysis of investor sentiment (both professional and individual) and rising leverage confirm the same.

What is clear in all of this analysis is that investor behavior tends to be exactly the opposite of what it should be. Of course, this is why over extended periods of time investors tend to vastly underperform their investment goals by:

  • Chasing last years performance
  • Buying high and selling low
  • Letting emotions drive investment decisions
  • Benchmarking performance
  • Not understand the amount of "risk" undertaken
  • Focusing on returns rather than preservation of capital
  • Failing to understand that Wall Street advice is biased against you.
  • Forgetting Warren Buffett's two investment rules "1. Never Lose Principal, and; 2. Refer to Rule #1"

As I have discussed previously, in golf there is a saying that you "drive for show and putt for dough" meaning that it is not necessary to be able to drive a golf ball 300 yards down range, it is the putting that wins the game.  In investing it is much the same - being invested in the market is one thing, however, understanding the "short game" of investing is critically important to winning the "long game."

The problem, as identified by investor behavior, is that they continually fail to focus on managing the "risk" of the portfolio if favor of chasing "returns." As markets rise success breeds confidence which eventually leads to complacency. The belief that blooms is "this time is different." Somehow, this time economic and investment cycles have been repealed as witnessed by the following statement from the article:

“America is already five years out of its recession,” Ms. Tims said. “Europe, meanwhile, has turned the corner more recently. This means that the continent's small and midcap stocks could do very well going forward.”

The problem with the statement is that it assumes that the current recovery will last indefinitely, they don't. With both the current economic recovery and "bull market" cycle are already "long in the tooth" by historical standards we are likely closer to the next downturn than not.

Investing is not a competition and, as history shows, there are horrid consequences for treating it as such. However, individuals treat it that way by continually clicking a website to see how a particular investment is performing. They are elated when it is rising, but despondent when it falls. It is a "gamblers" addiction to the core.

As I discussed recently:

Could we have another bullish year in 2014?  It is certainly possible as long as the Federal Reserve remains engaged in their ongoing balance sheet expansions.

But maybe the ongoing inflation of assets, without the underlying improvement in organic, sustainable, economic growth, will eventually lead to the next market bubble and bust. Of course, for anyone that has paid attention [over the last 13 years], such an outcome would be of little surprise.

The important point is that, as an investor, you need to pay attention to the ever decreasing reward/risk ratio of chasing the financial markets. The "low hanging fruit" has long been harvested and the risk currently far outweighs the potential reward of being aggressively invested.

I realize that it is not popular, or fun, to rain on the bullish parade.  However, while pundits will likely appear to be correct in the short term; the long term outcome will most likely be far less pleasant.

All I can do is analyze as many of the facts as possible so that you can make your own financial decisions. However, I can tell you this – Wall Street is a massive organization whose business is to sell you a product.  Telling you to get out of the markets is not profitable for them.  Therefore, when listening to mainstream analysts and economists make sure and weigh their comments with respect to their financial benefit.

One of my favorite quotes is by Howard Marks and is a principle that we live by in our little shop;

“Resisting – and thereby achieving success as a contrarian – isn’t easy. Things combine to make it difficult; including natural herd tendencies and the pain imposed by being out of step, since momentum invariably makes pro-cyclical actions look correct for a while. (That’s why it’s essential to remember that “being too far ahead of your time is indistinguishable from being wrong.”)

Given the uncertain nature of the future, and thus the difficulty of being confident your position is the right one – especially as price moves against you – it’s challenging to be a lonely contrarian."

It may be beneficial to be a little more cautious after such a large rise in the financial markets in 2013. Think about it this way – if you need to grow your assets by 5% per year from now until you reach retirement, then 2013 advanced you 6 years towards your goal.  Raising cash and protecting that cushion shouldn’t be a tough decision.

However, not doing it should make you question your own discipline. Is “greed” overriding your investment logic?

The problem is that when I make such a suggestion, the general comment that is returned is:

“But if the market keeps going up – I will miss out.”

This is where being a contrarian pays off – as long as you have patience.  It is okay to miss out on an opportunity – it is nearly impossible to make up losses.  The headlines are rampant at the moment that the "bull market" is set to continue, and maybe it is...for now. The problem, as I quoted in "No One Will Ring A Bell At The Top"

" Not surprisingly, lessons learned in 2008 were only learned temporarily. These are the inevitable cycles of greed and fear, of peaks and troughs.

Can we say when it will end? No. Can we say that it will end? Yes. And when it ends and the trend reverses, here is what we can say for sure. Few will be ready. Few will be prepared."

It is your money after all.  If you do not pay attention to it - it is unlikely that anyone else with either.

See the original article >>

Has inflation in the US bottomed out?

by SoberLook.com

Some analysts are beginning to suggest that inflation in the Unites States may have bottomed. As discussed earlier this years (see post), US inflation indicators were pointing to the lowest rate since 2009. Are the global disinflationary pressures going to push the rate of price increases in the US to new lows or have we hit the bottom?
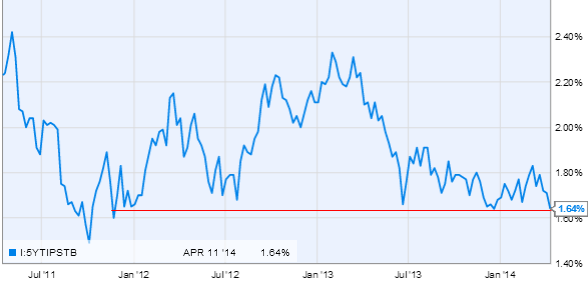
First of all, what is the market telling us? Market expectations of future inflation remain subdued, with the so-called breakeven (implied from TIPS) rates still near the 3-year low.

5-year breakeven rate (source: Ycharts)

The situation with consumers is similar - inflation expectations remain low relative to historical data.

With expectations at the lows, why are some analysts calling the bottom on inflation in the US? Here are a few reasons:
1. Looks like producer prices are showing signs of life, as the latest PPI figure came in above expectations.

Source: Investing.com

The index has recently been changed to include a larger swath of the economy and it was those newer components which showed increases.

GS: - Headline producer prices rose 0.5% in March (vs. consensus +0.1%), while core prices rose 0.6% (vs. consensus +0.2%). The largest contributor to the unexpectedly large gain was trade margins—an implicit profit measure—which rose 1.4%. Within this category, there were large gains in flooring (+8.1%), chemicals (+4.7%), cleaning supplies (+4.0%), and apparel (+3.3%). The stronger March figures in this category followed a 1.0% decline in February, which pulled the core PPI down to -0.2%. The PPI for finished goods ex-food and energy—the "old" core PPI—rose a more typical 0.1%, consistent with subdued pipeline inflation.
Nevertheless this increase got some people thinking.
2. Today's CPI increase was also firmer than expected (see story), a great deal of which was due to rising costs of shelter and food (not great for the US consumer).
3. In spite of the weakness in some commodity prices driven by China's slowdown (see post), commodity indices are generally off the lows.

DJ UBS Commodity Index

CRB BLS Spot Commodity Index (source: Barchart)

In particular, the energy sector rallied recently, with both gasoline and natural gas prices on the rise.
4. Some senior Fed officials are beginning to talk about inflation bottoming out (could of course be wishful thinking).

James Bullard: - "One thing you can say is that while inflation has drifted down ... it kind of bottomed out in the past nine months, and I think it's poised to go higher, back towards our target"
Given the data thus far, it's difficult to make a reasonable projection at this point. With low inflation priced in however, any turnaround will take the markets by surprise.

See the original article >>

What's the Difference Between Fascism, Communism and Crony-Capitalism? Nothing

by Charles Hugh Smith

The essence of crony-capitalism is the merger of state and corporate power--the definition of fascism.

When it comes to the real world, the difference between fascism, communism and crony-capitalism is semantic. Let's start with everyone's favorite hot-word, fascism, which Italian dictator Benito Mussolini defined as "the merger of state and corporate power." In other words, the state and corporate cartels are one system.
Real-world communism, for example as practiced in the People's Republic of China, boils down to protecting a thoroughly corrupt elite and state-owned enterprises (SOEs). The state prohibits anything that threatens the profits (and bribes) of SOEs--for example, taxi-apps that enable consumers to bypass the SOE cab companies.
What A Ban On Taxi Apps In Shanghai Says About China's Economy

The Chinese mega-city of Shanghai has been cracking down on popular taxi-booking apps, banning their use during rush hour. Until the apps came along, the taxi companies, which are government owned, set the real price for fares and collected about 33 cents each time someone called for a cab. That can add up in a city the size of Shanghai. Wang says the apps bypassed the old system and cut into company revenues.
Much has been made of China's embrace of capitalism, but — along with transportation — the government still dominates key sectors, including energy, telecommunications and banking. Wang says vested government interests won't give them up easily.
How else to describe this other than the merger of state and corporate power? Any company the state doesn't own operates at the whim of the state.
Now let's turn to the crony-capitalist model of the U.S., Japan, the European Union and various kleptocracies around the globe. For PR purposes, the economies of these nations claim to be capitalist, as in free-market capitalism.

Nothing could be further from the truth: these economies are crony-capitalist systems that protect and enrich elites, insiders and vested interests who the state shields from competition and the law.

The essence of crony-capitalism is of course the merger of state and corporate power. There are two sets of laws, one for the non-elites and one for cronies, and two kinds of capitalism: the free-market variety for small businesses that are unprotected by the state and the crony variety for corporations, cartels and state fiefdoms protected by the state.
Since crony-capitalism is set up to benefit parasitic politicos and their private-sector cartel benefactors, reform is impossible. Even the most obviously beneficial variety of reform--for example, simplifying the 4 million-word U.S. tax code--is politically impossible, regardless of who wins the electoral equivalent of a game show (i.e. Demopublicans vs. Republicrats).
The annual cost of navigating the tax code comes to about $170 billion:
Since 2001, Congress has enacted about one new change to the tax law per day. Pathetic, isn’t it? This tax code is a burden and a fiasco and deeply unpatriotic. As Olson’s Taxpayer Advocate Service notes, this code helps tax evaders; hurts ordinary, honest taxpayers; and corrodes trust in our system.
Here's why the tax code will never be simplified: tax breaks are what the parastic politicos auction off to their crony-capitalist benefactors. Simplify the tax code and you take away the the intrinsically corrupt politicos' primary source of revenue: accepting enormous bribes in exchange for tax breaks for the super-wealthy.
You would also eliminate the livelihood of an entire industry that feeds off the complexities of the tax code. Tax attorneys don't just vote--they constitute a powerful lobby for the Status Quo, even if that Status Quo is rigged, unjust, wasteful, absurd, etc.
It's not that hard to design a simple and fair tax code. Setting aside the thousands of quibbles that benefit one industry or another, it's clear that a consumption-based tax is easier to collect and it promotes production rather than consumption: two good things.
As for a consumption tax being regressive, i.e. punishing low-income households, the solution is very straightforward: exempt real-food groceries (but not snacks, packaged or prepared foods such as fast-food), rent, utilities and local public transportation--the major expenses of low-income households.
1. A 10% consumption tax on everything else would raise about $1.1 trillion, or almost 2/3 of total income tax revenues, not counting payroll taxes (15.3% of all payroll/earned income up to around $113,000 annually, paid half-half by employees and employers), which generate about one-third of all Federal tax revenues and fund the majority of Social Security and a chunk of Medicare.
As for the claim that a 10% consumption tax would kill business--the typical sales tax in California is 9+%, and that hasn't wiped out consumption.
2. The balance could be raised by a progressive tax on unearned income, collected at the source. Most of the income of the super-wealthy is unearned, i.e. dividends, investment income, interest, capital gains, stock options, etc. As a result, a tax on unearned income (above, say, $10,000 annually to enable non-wealthy households to accrue some tax-free investment income) will be a tax on the super-wealthy who collect the vast majority of dividends, interest, capital gains and investment income.
A rough estimate would be 20% of all unearned income.

This would "tax the rich" while leaving all earned income untaxed, other than the payroll tax, which is based on the idea that everyone should pay into a system that secures the income of all workers. This would incentivize productive labor and de-incentivize speculation, rentier skimming, etc.
The corporate tax would be eliminated for several reasons:
1. It is heavily gamed, rewarding the scammers and punishing the honest
2. All income from enterprises is eventually distributed to individuals, who would pay the tax on all unearned investment income.
But such common-sense reform is politically impossible. That's why the answer to the question, what's the the difference between fascism, communism and crony-capitalism is nothing.

See the original article >>

Gold Doomed or Resting? Gold vs. Major Currencies; Goldman Sachs and Morgan Stanley Reiterate Sell Signal

by Mike "Mish" Shedlock

Here are some interesting charts from my friend Nick at Sharelynx Gold. (Login Required)
Gold vs. US Dollars

Gold vs. Euros

Gold vs. Ukraine Hyyvnia

It took about 4,000 Hyyvnia to buy an ounce of gold at the end of 2008. It takes 17,444 now.
Gold vs. Russia Rubles

Gold vs. India Rupees


Gold vs. Argentina Pesos


Gold vs. Venezuelan Bolivars


Gold vs. Yen


By the way: Those in Argentina and Venezuela cannot buy gold at the quoted rates. The charts reflect "official" exchange rates. Black market rates are much much higher.
Goldman Sachs and Morgan Stanley Reiterate Sell Signal
Bloomberg reports Goldman Stands by $1,050 Gold Target on Outlook for Recovery
Bullion’s rally this year was spurred by poor U.S. data probably linked to the weather and rising tension in Ukraine, analysts led by Jeffrey Currie wrote in a report, describing the reasons as transient. With the tapering of the Federal Reserve’s bond-buying program, U.S. economic releases will return as the driving force behind lower prices, he wrote.
Gold’s 12-year bull run ended in 2013 as the Fed prepared to reduce monthly bond-buying that fueled gains in asset prices while failing to stoke inflation. Prices rose 10 percent this year even as the Fed cut purchases, with Russia’s annexation of Crimea and mixed U.S. economic data boosting haven demand. Last year, Currie described gold as a “slam-dunk sell” for 2014.
“It would require a significant sustained slowdown in U.S. growth for us to revisit our expectation for lower gold prices over the next two years,” Currie wrote in the report, dated yesterday. “While further escalation in tensions could support gold prices, we expect a sequential acceleration in both U.S. and Chinese activity, and hence for gold prices to decline.”
Gold for immediate delivery traded 0.3 percent higher at $1,322.01 an ounce at 7:43 p.m. in Singapore, according to Bloomberg generic pricing, after the United Nations Security Council met to address the Ukraine crisis. Bullion last traded below $1,050 an ounce in February 2010.
Morgan Stanley
Bullion is the least preferred commodity among metals as prices resume a decline this year on the outlook for rising U.S. interest rates and low inflation expectations, Morgan Stanley said in a report on April 8. Average prices are expected to drop for the next four quarters, it said.
Stronger U.S. growth this year and next will help the world economy withstand weaker recoveries in emerging markets, according to the International Monetary Fund. The world’s largest economy will expand 2.8 percent this year and 3 percent in 2015, unchanged from forecasts in January, the IMF said in its World Economic Outlook report last week.
Least Preferred Commodity?
Is gold really the least preferred commodity? Actually, I hope so, because if it is, sentiment will reverse.
Please consider Gold Prices 2014: Do What Goldman Does, Not What It Says
Jeffrey Currie, the investment bank's head of commodities research, has repeated his $1,050 target several times since last October, when he declared gold a "slam-dunk sell" along with other precious metals.
But investors need to be very skeptical when looking at Goldman's forecasts for gold prices. Not only are they often wrong, but the bank frequently does the opposite of what it recommends.
Goldman and Gold Prices: A Shady History
Let's first look at some of Goldman's gold price forecasts over the past few years and how they panned out.
For example, back in 2007, Goldman was bearish on gold, telling its clients to sell. In fact, Goldman declared selling gold in 2008 one of its Top 10 tips of the year.
Of course, gold prices rose 12.2% in 2008 and another 23.4% in 2009.
By November 2011, Goldman was actually bullish on gold prices - it raised its target to $1,930 an ounce about one month after gold prices had peaked.
By May 2012, with gold prices below $1,600, Goldman adjusted its bullish target to $1,840 an ounce. Gold prices did rise slightly after that, but never made it to $1,800, and thereafter started a precipitous decline.
By December 2012 - when gold prices were trading in the neighborhood of $1,700, Goldman revised its forecast to $1,800. Six months later gold prices were slipping toward $1,200.
Goldman finally reversed course in February 2013, beginning its string of bearish forecasts that have continued to the present.
That's actually good news for gold prices, as Goldman always seems to be late figuring out where gold is headed.
Gold Doomed or Resting?
Seldom is sentiment so bad for what is frequent slump in commodities and especially for something that still appears to be a long-term bull market.
When in doubt, it pays to take the opposite side of what Goldman Sachs publicly says. Goldman has a history of not only being wrong, but betting against its own recommendations.

See the original article >>

What the Heck is Going on With US Treasuries In Belgium?

by AuthorWolf Richter

The tiny country of Belgium – my beloved hunting grounds for three years a while back – with a GDP of $484 billion, a country which you can cross by bicycle in a single day if you're really fit, a country that became famous to the chagrin of some people because it did just fine for a couple of years without a national government – well, that tiny speck of land is starting to grow an enormous mountain of US Treasury Securities.

In February, according to data just released by the US Treasury Department, it added $30.9 billion, taking its mountain of Treasuries to the phenomenal level of $341.2 billion, or about 70% of its GDP.

It put that speck of land with 11 million people in third place, behind export powerhouse China ($1.27 trillion) and former export powerhouse and now money-printing powerhouse Japan ($1.21 trillion), the second and third largest economies in the world.

From August last year, when an already lofty $166.8 billion in Treasuries were held in Belgium, holdings have soared by 105%! Why this sudden jump?

What the heck is going on in Belgium?

It has a vibrant export sector – right away, I can think of superb chocolates, addictive beers, and many other products. But have dollar-denominated sales multiplied umpteen times overnight in a miraculous fashion? Nope. Nothing happens quickly in Belgium. Getting even something minor through the bureaucracy, as we found out, requires superhuman patience, finely honed finesse, and a surprising amount of money. Nope, it couldn’t be anything having to do with Belgium’s real economy.

Leaves the other option: that Belgium has become a financial center for Treasuries owned by other countries, or that it at least has become a transit point for them.

Over the same period since August, Luxembourg, a true financial center with legendary opaqueness, saw its Treasury holdings decline from $143.8 billion to $136.8 billion. Ireland, where Corporate America registers much of its money to avoid US taxes, has also seen Treasury holdings drop since August from $120 billion to 111.4 billion.

So why Belgium? Mystery swirls around it for now. But there are some clues....

One of them is called Euroclear. It’s a big outfit. It holds €24.2 trillion ($33 trillion) in assets. Its clients include, as it says, over 2,000 global and local custodians, broker dealers, central banks, commercial and investment banks, investment managers, and supranational organizations in more than 90 countries. The total value of securities transactions it settles for them exceed €570 trillion per year. It proudly points out: "Every 6 days we settle transactions equivalent to the GDP of the EU.”

And it’s headquartered in Belgium. It could very well be that a government has used this mega-outfit to move its Treasury holdings away from the long muscular arm of the US. Indeed, Euroclear told the Financial Times that the volume of Treasuries it holds had “gone up dramatically” in recent months.

There is a suspect, so to speak. The Treasury’s ledger of Major Foreign Holders of Treasuries shows that Russia’s holdings were $126.2 billion at the end of February, down 23.5% from a year earlier. That’s quite a drop. Clearly, President Vladimir Putin has had it. Gradually and ever so carefully, he is diversifying Russia’s foreign exchange holdings. And occasionally, the Central Bank is selling some of them in an effort to prop up the ruble. But these movements belie the sudden and massive volatility of another ledger, the Federal Reserve’s Securities Held in Custody for Foreign Official and International Accounts.

As the US national debt ballooned by over $1 trillion per year, foreign countries were among the largest buyers. So the Fed’s leger of Foreign Official Accounts peaked at $3.02 trillion on December 18, having soared over 150% in just six years. But then it dropped week after week, and finally plunged by a record $104.5 billion during the week of March 5 to a recent low of $2.855 trillion – only to see some of those Treasuries reappear over the next few weeks, leaving behind a record trail of volatility.

That mystery – a record pile of Treasuries suddenly disappearing and now reappearing – hasn't been solved. In May, when we get the March data from the Treasury International Capital (TIC) System, we might learn more. All we know for now is that someone in panic-mode yanked a pile of Treasuries away from the Fed and transferred it to some other entity.

The entity could be Euroclear, which would then as custodian, and thus under its name, transfer some of them back to the Fed. Now that they’re no longer in Russia’s name, the US government would presumably have trouble freezing them as part of the sanction spiral unfolding over the Ukraine – couldn’t even credibly threaten to freeze them.

And it opens a broader issue: if otherwise inconvenient foreign holders of Treasuries, like Russia, get harassed by the US Government, or by Congress, what lesson will the Chinese learn from it? And what will they do?

Ha, they're already doing it: the word dollar didn’t even come up when the Bundesbank signed the agreement with the People’s Bank of China. President Xi Jinping and Chancellor Angela Merkel looked on. It was serious business. Everyone knew what this was about. No one had to say it.

See the original article >>

Soybeans Climb Above $15 as Rising Crush Crimps Stocks

By: Bloomberg

April 16 (Bloomberg) -- Soybeans rose above $15 a bushel in Chicago, climbing for a third day, after higher-than-estimated U.S. processing of the oilseed in March eroded stockpiles.

U.S. processors crushed 153.84 million bushels of soybeans last month from 141.61 million bushels in February, the National Oilseed Processors Association reported yesterday. Analysts surveyed by Bloomberg had projected 145.11 million bushels.

Soybeans for delivery in July added 1.3 percent to $15.0625 a bushel by 7:19 a.m. on the Chicago Board of Trade. Prices gained 4.1 percent over the current streak of advances, the longest in three weeks.

"Demand for old-crop soybeans provides the support," Paul Georgy, the president of Allendale Inc., wrote in a market comment. "The NOPA crush number was a surprise for traders."

U.S. soybean stocks at the end of August will be 135 million bushels, the U.S. Department of Agriculture forecast on April 9, cutting its outlook from domestic inventories before the next harvest from 145 million tons in March.

"In soybeans, the sustained crushing activity is supporting the prices in a market where the balance sheet at the end of the campaign remains ever tighter," Paris-based farm adviser Agritel wrote in a market comment.

Palm oil for delivery in June rose 1.4 percent to 2,700 ringgit ($832) a metric ton, the highest level since March 25, in Kuala Lumpur trading on indications of rising exports. The vegetable oil competes with soybean oil.

Milling Wheat

Wheat for delivery in July rose 0.3 percent to $7.115 a bushel in Chicago after yesterday’s 3.3 percent climb, the biggest since March 19. Milling wheat for delivery in November traded on NYSE Liffe in Paris was unchanged at 209.75 euros ($290.34) a ton.

Chicago wheat rose 18 percent this year as U.S. crop conditions deteriorated and tensions between Russia and Ukraine intensified concern about potential disruption of supplies from the Black Sea region.

About 34 percent of the U.S. winter-wheat crop to be harvested starting in May was in good or excellent condition on April 13, from 35 percent a week earlier and 62 percent in November, the USDA said April 14.

"We had quite a bit of a rally overnight on the back of potential winter-kill issues in the U.S.," Graydon Chong, an analyst at Rabobank International in Sydney, said by telephone. "We may well see the market take a bit of a breather here after the sharp rally. The market continues to watch developments in the Black Sea region."

Hard, red winter wheat for delivery in July fell 0.1 percent to $7.71 a bushel in Chicago after climbing 6.3 percent in the prior two days, the most since July 5, 2012. The variety is used to make bread. Corn for the same delivery month slid 0.2 percent to $5.0875 a bushel.

--With assistance from Jeff Wilson in Chicago and Ranjeetha Pakiam in Kuala Lumpur.

To contact the reporters on this story: Rudy Ruitenberg in Paris at rruitenberg@bloomberg.net; Phoebe Sedgman in Melbourne at psedgman2@bloomberg.net To contact the editors responsible for this story: James Poole at jpoole4@bloomberg.net John Deane

See the original article >>

Equity Rallies Are Corrective, Downside Risks Remain, BofAML Says

by Tyler Durden

As the second algo-crazy spike in stocks in 2 days draws to a close, it is perhaps worth considering BofAML's Macneil Curry's perspective on the S&P 500 - despite the potential for further near-term strength, equity gains are corrective and downside risk remain... or put a different way "sell the f##king rips." Just as growthless-ly, Curry advises 5s30s flatteners in Treasuries as the slowing trend is set to continue.

US5s30s resumes its flattening trend.

US5s30s is resuming its flattening trend. The test and reversal from old channel support, now resistance at 196bps and coincident momentum unwind from oversold extremes says the flattening trend is resuming and that it has room to run.

REMEMBER, WE ARE IN A CYCLICAL (multi-year) flattening trend. Steepening is temporary and corrective. Our initial downside targets are seen to retracement support at 146bps, but eventually we look for a move to long term channel support at 57bps and eventually below.

Initiate UST 5s30s Flatteners at mkt (185.3bps) risk 197bps, target 143bps

ESM4 gains remain corrective.


Turning to equities, despite the potential for further near term strength, against a break above 1867.50/1872.53 (ESM4 and CASH) downside risks remain for the confluence of CASH SUPPORT between 1794/1763 (10m trendline and 200d avg).

See the original article >>

China economic growth slows to 18-month low in first-quarter

By Adam Rose and Xiaoyi Shao

BEIJING (Reuters) - China's economy grew at its slowest pace in 18 months at the start of 2014, but did a touch better than expected and showed some improvement in March, suggesting Beijing will not rush to follow up recent steps to support activity.

Authorities have ruled out major stimulus to fight short-term dips in growth, signaling the slowdown was an expected consequence of their reform drive, even as some analysts think the economy will lose further momentum.

The economy grew 7.4 percent in the January-March quarter from a year earlier, the National Bureau of Statistics said on Wednesday. That was slightly stronger than the median forecast of 7.3 percent in a Reuters poll but still slower than 7.7 percent in the final quarter of 2013.

It was China's slowest annual growth since the third quarter of 2012, when the world's second-largest economy also grew 7.4 percent.

"The slowdown of China's economy is a reflection of a transformation of the economic mode," said Sheng Laiyun, of the National Bureau of Statistics.

"There is no fundamental change in the improving trend of China's economy. The economy is still moving steadily towards the expected direction."

For the quarter, the economy grew 1.4 percent, the slowest rate in two years, which Credit Agricole strategist Dariusz Kowalczyk said equated to annualized growth of 5.8 percent.

"This highlights the depth of deceleration at the start of the year," he said.

Beijing has announced some modest measures, such as tax cuts for small firms and speeding up investment in railways, to try to steady growth near its target of 7.5 percent without disrupting plans to restructure the economy or worsening problems of overcapacity and debt.

"Policymakers seem pretty comfortable with the current pace of growth," said Julian Evans-Pritchard, an economist at Capital Economics in Singapore. "I don't think they're going to announce any further significant measures to support growth."

Activity data for March, released with the GDP figures, showed that China may be making some headway in its attempt to enhance the role of consumption and cut its reliance on traditional growth engines of exports and investment.

Retail sales were a shade ahead of forecasts with an annual increase of 12.2 percent, while factory output came in just below expectations with a rise of 8.8 percent.

"That sector is continuing to moderate and now there is an even bigger gap between industrial production and retail sales. So the rotation from relying on heavy industries towards consumption is certainly coming to fruition," Annette Beacher, head of Asia-Pacific research at TDSecurities in Singapore said.

Cumulative fixed-asset investment in the first three months of the year was 17.6 percent higher than a year earlier, again on the low side of forecasts.

SERVICES IMPORTANT

The services sector, which includes retail, made up 49 percent of gross domestic product in the first quarter, 4.1 percentage points more than the industrial sector.

Growth in retail bodes well for employment, a top government priority, as services are now the biggest employer in China.

"The resilience of the relatively labor-intensive services sector has helped the labor market hold up reasonably well in the first quarter, even though it cooled," Louis Kuijs, RBS economist in Hong Kong, said in a note.

Previously released figures for March had raised concerns that economy was losing more momentum than expected, and even though first-quarter GDP was slightly better than forecast, those worries remained.

Exports fell for the second month in a row and imports dropped sharply in March, while money supply grew at its slowest annual pace in more than a decade. Official and private surveys also show the manufacturing sector continuing to struggle.

Stephen Green, an economist with Standard Chartered in Hong Kong, expects a 50 basis point cut on the reserve requirement ratio banks in coming months, a move that would free up more funds in the economy.

"It's not bad enough to change monetary policy, but forward indicators suggest that in the next few months we will see more aggressive easing," Green said

See the original article >>

Industrial Production Growth Slows As Manufacturing Misses, Capacity Utilization Highest Since 2008

by Tyler Durden

Last month's industrial production beat was revised up dramatically to its biggest beat since 1998 - courtesy of the annual revision of the data series as noted below - which left this month showing fading growth. Perhaps more disappointingly was the 4th miss of the last 5 months for manufacturiung production. Capacity Utlization rose to an impressive 79.2% as "slack" in the un-job-producing economy is rapidly disappearing. This was also the highest capicty utilization print (once again courtesy of the annual data revision) since June 2008.

Manufacturing missed 4th of last 5 months... and dropped

From the Fed:

Industrial production increased 0.7 percent in March after having advanced 1.2 percent in February. The rise in February was higher than previously reported primarily because of stronger gains for durable goods manufacturing and for mining. For the first quarter as a whole, industrial production moved up at an annual rate of 4.4 percent, just slightly slower than in the fourth quarter of 2013. In March, the output of manufacturing rose 0.5 percent, the output of utilities increased 1.0 percent, and the output of mines gained 1.5 percent. At 103.2 percent of its 2007 average, total industrial production in March was 3.8 percent above its level of a year earlier. Capacity utilization for total industry increased in March to 79.2 percent, a rate that is 0.9 percentage point below its long-run (1972–2013) average but 1.2 percentage points higher than a year prior

And by group:

In March, manufacturing production recorded an increase of 0.5 percent; factory output rose 1.4 percent in February, 0.5 percentage point faster than previously reported. For the first quarter, the index for manufacturing increased at an annual rate of 1.7 percent, with similarly sized gains for durables and nondurables. The factory operating rate moved up 0.2 percentage point in March to 76.7 percent, a rate 2.0 percentage points below its long-run average.

* * *

In March, mining output climbed 1.5 percent, its fifth consecutive monthly increase; over the past year, the index has risen 7.9 percent. The output of utilities rose 1.0 percent; unseasonably cold temperatures since the start of the year led to a jump in the index of 17.9 percent at an annual rate for the first quarter. The utilization rate for mining, 89.1 percent, was nearly 2 percentage points above its long-run average, while the operating rate for utilities, 85.0 percent, was about 1 percentage point below its long-run average.

Capacity utilization rates in March for industries grouped by stage of process were as follows: At the crude stage, utilization increased 0.6 percentage point to 87.0 percent, a rate 0.7 percentage point above its long-run average; at the primary and semifinished stages, utilization moved up 0.5 percentage point to 78.1 percent, a rate 2.7 percentage points below its long-run average; at the finished stage, utilization rose 0.1 percentage point to 76.7 percent, a rate 0.4 percentage point below its long-run average

Finally, as noted earlier, on March 28 the Fed concluded its annual IP and Cap Utilization data revision, which incidentally led to the surge in the February data (but... but... harsh weather). Those curious can find the full breakdown at this link, but the main visual breakdown of the pre- and post-revision data is below.

See the original article >>

A Financial Miscalculation On A Global Scale

By Astrology Traders

We are fast approaching the peak on April 22nd of a very rare, once in a lifetime, grand cardinal square in the heavens between Pluto, Uranus, Jupiter, and Mars.  The aspect is extremely afflicted with Uranus and Jupiter as the lesser malefic’s, holding the promise of unconventional financial engineering amidst an otherwise brutal and inexorably difficult warlike pattern between Pluto and Mars.  The grand square aspect in the heavens is a punctuation and dramatic warning to consequences of a miscalculation (political gamble), that at this point has likely already happened and cannot be turned back.  No nation, including the United States, will get through this cycle unscathed.  The emerging markets will likely take a serious downturn and ‘depression’ will become a common theme.

Whoops, They Did It Again

What happened?  Well, we all know what happened in 2008 with the collapse of Lehman Brothers, the resulting TARP programs, designed supposedly to fix everything and make the economy whole again.  But, whoops they did it again!, MF Global collapsed unexpectedly in October 2011 throwing a curve ball to the Federal Reserve.  Suddenly Bernanke embarked on extraordinary QE to prop the markets and keep the gig going a bit longer.  Perhaps the only salvation for the Federal Reserve at this point is the destruction of the dollar as reserve currency, and the reorganization under a new form of digital money, or so they think.

Something unexpected happened between January 31st and February 5th 2014, the algorithm’s got broken in the midst of currency volatility in the Forex markets.  I am suspicious of a very secret move in January to unplug the dollar as reserve currency.  In an interview with India’s central banker on Bloomberg TV February 5th, Raghuram Rajan stated “international monetary cooperation has broken down”.  At the same time, the financial news media showed signs of being thrown off balance,  commentary became unorganized while comparisons to 1929 were floated.  This, after the Fed announced in December the leading economic index increased 0.8 percent in November, underscoring the Fed’s view of an improving U.S. economy?

The Karma of Unplugging The Dollar

A perhaps foreseeable fate for America is the position of the natal Sun at 13 degrees Cancer, caught now in the crosshairs of this very debilitating grand square.  The Sun represents the currency in a nations chart, and while receiving an opposition from transiting Pluto, the outcome will have very long term consequences.  Pluto oppositions are like playing high stakes tug of war with a rubber band.  Pull too hard and the rubber band snaps, both sides get smacked and there is no winner.  In my view the rubber band snapped the first week of February. Emerging markets became unstable along with stocks and currencies.  By mid March a major US financial institution was likely also caught in the mix with the unraveling of tangled derivatives (transiting Mars square the US Pluto and Federal Reserve Neptune in the US 8th house of counter party risk).  A lot of roads lead back to JP Morgan and the bizarre interactions between MF Global’s Jon Corzine and Jamie Dimon, CEO at JP Morgan.  The mysterious death of Corzine’s son in March is all very Shakespearean.

usd

To add to the drama, a series of ‘blood red’ lunar eclipses beginning April 15th, The first day of Passover and the first day of Sukkot.  The implication here is a dire warning, with biblical references– The sun shall be turned into darkness, and the moon into blood, before the great and notable day of the Lord come.

A Caveat And Dispensation For America

There is a bright spot on the horizon that holds the promise of opportunity to avoid the worst.  A bit of Star candy in the midst of inexorable pressure form all sides of the cardinal grand square.  Following the eclipse on April 15th,  the next day April 16th and then again on October 13th,  is a Saturn return to the point of a dispensation from July 7, 1985 that will block an injustice, explosion, or warlike attack.  Historically the date of April 19th has brought significant acts of war and catastrophe’s:

  • April 19, 1775 – British troops march; American Revolution starts in Lexington
  • April 19, 1917 – USS Mongolia fires first U.S. shots in WWI, sinking a German sub.
  • April 19, 1933 – FDR announces confiscation of Americans’ gold.
  • April 19, 1947 – Texas City, TX oil refinery explosion kills 377
  • April 19, 1961 – Failed CIA Bay of Pigs invasion in Cuba; massacre on 19th
  • April 19, 1989 – USS Iowa turret room explosion kills 47 Navy seamen.
  • April 19, 1993 – Waco, TX Branch Davidian compound massacre. 76 dead.
  • April 19, 1995 – Oklahoma City Murrah Federal bldg massacre. 168 victims

In 2013 there was a similar cycle that was initiated on July 4, 1984 while Saturn was transiting in Scorpio.  I wrote on April 7, 2013 to watch for an obvious event on September 18, 2013 that would block an injustice and cause a power shift between the government and the military in Washington.  Looking back it was on September 18th when Obama’s red line on Syria turned to beige following a public debate between former Defense Secretaries Robert Gates and Leon Panetta.  The war agenda on Syria was swiftly shoved under the rug.

These are the dates to watch: April 16th and October 12, 2014. The theme is our freedom’s– freedom to assemble, freedom of speech, freedom of the press, freedom of religion on a global scale.  The purveyor’s of drugs will also likely get a setback.  This includes the industry and stocks of those companies catering to the cannibus industry.

There are certainly dire warnings in the heavens, however, the final outcome is not written and much depends upon each one of us and the choices we make.  Much has been set in motion and it is true we will have to go through a difficult cycle.  But, miracles can and do happen.

It is not in the stars to hold our destiny, but in ourselves.”  Shakespeare

This is an excerpt from this weeks premium update concerning this pullback we are experiencing and when it will likely end. Within our service we provide trade setups complete with real time buy/sell trade alerts. We offer a complete 30 day refund policy, no questions asked refund on our service.  Below is our trade performance on closed trades since joining Marketfy.

  • 29 winners with an average gain of 10.10%
  • 7 losers with an average loss of 6.70%

See the original article >>

A “Red Soxx” has been a leading indicator to S&P 500!

by Chris Kimble

CLICK ON CHART TO ENLARGE

The Semi Conductor index is known at the Soxx Index. The above chart highlights that when the Soxx indexed peaked and turned lower at (1) in 2000 & 2007, the S&P 500 soon followed this leader!

Currently the SOXX index is staring at its 38% Fibonacci retracement level and a couple of potential resistance lines at (2) above.

Bottom line....When the Soxx turns Red, it often sends a cautionary signal to risk assets. Keep an eye on the Soxx in the next few weeks to see if it breaks out or if positive momentum happens to change here!

See the original article >>

US to Foreign Officials: Stop buying Treasuries

by Marc To Market

Cassandras warn that the foreign appetite for US debt is satiated and wonder who is going to buy US Treasuries when the Federal Reserve stops. Not only are US officials not concerned about this, but the Department of Treasury continues its campaign to discourage foreign central banks from buying so many Treasuries.

Foreign official purchases of Treasuries are usually the result of intervention in the foreign exchange market. The rules of engagement as they have evolved from the G7, the G20 and IMF over past decade are to let market forces drive foreign exchange prices. Of course, the orthodoxy prior to this, and the rules under which the high income economies boomed, was the exact opposite.

In any event, the US Congress requires US Treasury Department to make semi-annual reports on the international economic policies and exchange rate practices of the major US trading partners. It did so yesterday, April 15. As part of the report, it must look at whether these trading partners are manipulating their currencies to prevent an adjustment on the balance of payments or to seek an unfair trade advantage. The fact that the US has not cited any country for two decades has, in some sense, makes the threshold more significant.

On the other hand, the currency policy of many countries is more nuanced. It is not just intervention, but a certain purpose of the intervention that is required to conclude manipulation. Let's concede for the sake of the argument that China did not just tolerate, but actually played an active role in the yuan's recent weakness. It may not meet the threshold of manipulation of the law if it did so to wash out what it regarded as speculative positioning.

The Treasury report warns that it would "raise particularly serious concerns" if the recent yuan weakness was an indication that Chinese officials would resist further currency appreciation. However, the report still assumes the if left to market forces, the yuan would strengthen. This assumption is not as obvious as it once was, especially given the sharp decline in its external surplus and the compounded effect of persistent inflation than the US, Europe and Japan.

Though stopping shy of labeling a country a manipulator, which would require bilateral negotiations, the US Treasury still uses the report to express its desires. It calls on China to let markets play a bigger role and take advantage of the opportunity created by widening the band (to 2% from 1% from daily fix). The US does not force China to intervene and buy US Treasuries and it wishes it did not. 

The February TIC data show that China's Treasury holdings fell by $2.7 bln, bringing the three month decline to almost $34 bln. Still at $1.27 trillion, China's Treasury holdings remain the largest in the world. Japan comes in a close second with $1.21 trillion. Japan's holdings increased by $9 bln and over the past three months; they have risen by about $25 bln. Japan has not intervened in the foreign exchange market for a few years (2011), but over the past year, its Treasury holdings have risen by about $100 bln. The US Treasury urges Japan to focus on structural reforms that boost the growth potential and not rely on monetary to offset the fiscal adjustment.

Over the past three months, South Korea's Treasury holdings have increased by about $10 bln. The US Treasury report notes that South Korea's current account surplus in 2013 was 6.1% of GDP, the largest in 14 years. It cautions the country that intervention (resulting in US Treasury purchases) should only take place under "exceptional circumstances of disorderly markets" and increase the transparency of the interventions.

Germany did not go unscathed. It says Germany's reluctance to boost domestic demand retards the adjustment process. The US Treasury notes that German domestic demand has only grown faster than GDP in three times in the past ten years. Germany's current account surplus remains well above 7% of GDP. The adjustment that has taken place is largely in the periphery through higher savings, which compresses demand.

The G20 have agreed on working toward readdressing global imbalances. The Treasury's report argues that there are two reasons why a larger adjustment has not taken place. First, surplus countries have not increased domestic demand sufficient. Second, more progress is needed to more fully embrace market-determined exchange rates, refrain from currency intervention and stop excessive reserve accumulation.

Over the course of February, non-residents Treasury holdings rose by about $45 bln. Only about $1 bln was due to central banks. Their note and bond purchases appeared to have been large funded by shifting funds from the bill sector. Of the private sector increase, the lion's share (almost $31 bln) can be accounted for by Belgium. The US Treasury data suggests that Belgium owns Treasuries equivalent to roughly 3/4 of its GDP.

No doubt this overstates the case. Instead, Belgium's holdings, third overall behind China and Japan, are most likely a function of the role of Brussels as a financial center. The bank-owned clearer and custodian, Euroclear has around 22 trillion euro of assets and reports a large increase in Treasury holdings in recent months. Treasuries are ubiquitous collateral.

In January and February, the Federal Reserve reduced the amount of Treasuries it bought by $10 bln (and it reduced its purchases of Agencies by $10 bln as well). Foreign investors more than covered the difference, buying about $92 bln worth over the same period. Of this, foreign central banks accounted for about $15 bln.

US officials have long argued that the self-insurance strategy of building massive reserves is inefficient, expensive, and contributes to financial instability. Remember the Greenspan "conundrum": why US long-term rates were low even though the Fed had been raising short-term interest rates (circa 2004-2005). Bernanke responded by attributing it to Asia, which coming out of the 1997-98 financial crisis, began running significant current account surpluses and building reserve war chests. US officials have been consistent in recent years arguing that the self-insurance strategy is an obstacle to the agreed upon goal of reducing imbalances. They want private investors to buy US assets, including Treasuries, but are not so keen on foreign official purchases.

See the original article >>

The High-Tech, High-Touch Economy

by Adair Turner

LONDON – A recent report revealed that the five richest families in Britain are worth more than the country’s poorest 20% combined. Some of the wealth comes from new business ventures; but two of the five are a duke and an earl whose ancestors owned the fields across which London expanded in the nineteenth century.

Urban land wealth is not just a London phenomenon. As Thomas Piketty’s recent book Capital in the Twenty-First Century shows, accumulated wealth has grown rapidly relative to income across the advanced economies over the last 40 years. In many countries, the majority of that wealth – and the lion’s share of the increase – is accounted for by housing and commercial real estate, and most of that wealth resides not in the value of the buildings, but in the value of the urban land on which it sits.

That might seem odd. Though we live in the hi-tech virtual world of the Internet, the value of the most physical thing – land – is rising relentlessly. But there is no contradiction: The price of land is rising because of rapid technological progress. In an age of information and communication technology (ICT), it is inevitable that we value what an ICT-intensive economy cannot create.

ICT has already delivered remarkable new products and services; but, as MIT’s Erik Brynjolfsson and Andrew McAfee argue persuasively in their recent book The Second Machine Age, the really dramatic changes are yet to come, with robots and software bound to automate out of existence a huge number of jobs.

One consequence is the striking phenomenon of huge wealth creation with very little labor input. Facebook has an equity valuation of $170 billion but employs only around 6,000 people. The investment that went into building the software that runs it entailed no more than around 5,000 software engineer man-years.

This remarkable technology has helped to deliver increasing average incomes and will continue to do so. But the distribution of that bounty has been very unequal. The lion’s share of the growth has gone to the top half, the top 10%, or even the top 1% of the population.

As the better off become richer, however, much of their rising income will not be spent on ICT-intensive goods and services. There is a limit to how many iPads and smart phones one can need, and their price continues to plummet.

Instead, an increasing share of consumer expenditure is devoted to buying goods and services that are rich in fashion, design, and subjective brand values, and to competing for ownership of location-specific real estate. But if the land on which the desired houses and apartments sit is in limited supply, the inevitable consequence is rising prices.

Urban land is therefore rising in value – in London, New York, Shanghai, and many other cities – partly because of consumer demand. But its rising value also makes it an attractive asset class for investors, because further price increases are expected. Moreover, returns on real estate have been swollen by the dramatic fall in interest rates over the last 25 years, a decline that was far advanced even before the 2008 financial crisis.

The cause of those low interest rates is debated; but one probable factor is the reduced cost of business investment in hardware and software-based “machines.” If you can build a $170 billion company with just 5,000 software engineer man-years, you don’t need to borrow much money.

The fact that technology is so powerful not only makes physical land more valuable; it also means that future employment growth will be concentrated among the jobs that cannot be automated, particularly in services, which have to be delivered physically. The US Bureau of Labor Statistics estimates that among the most rapidly growing occupational categories over the next ten years will be “healthcare support occupations” (nursing aides, orderlies, and attendants) and “food preparation and serving workers” – that is, overwhelmingly low-wage jobs.

In short, ICT creates an economy that is both “hi-tech” and “hi-touch” – a world of robots and apps, but also of fashion, design, land, and face-to-face services. This economy is the result of our remarkable ability to solve the problem of production and automate away the need for continual labor.

But it is an economy that is likely to suffer two adverse side effects. First, it may be inherently unstable, because the more that wealth resides in real estate, the more the financial system will provide leverage to support real-estate speculation, which has been at the heart of all of the world’s worst financial crises. Major changes in financial and monetary policy, going far beyond those introduced in response to the 2008 crisis, are required to contain this danger.

Second, unless we deliberately design policies that encourage and sustain inclusive growth, a highly unequal society is virtually inevitable, with rising land values and wealth magnifying the effects of the unequal income distribution that ICT produces directly. Indeed, the modern economy may resemble that of the eighteenth century, when the land owned by the Duke of Westminster and the Earl of Cadogan was still just fields to the west of London, more than the middle-class societies in which most developed countries’ citizens’ grew up.

See the original article >>

Follow Us