Monday, March 24, 2014

7 Commodities in Contango and Backwardation

by Attain Capital

One of the more unique aspects of futures contracts compared to other investment styles, is that there are fixed term contracts which expire at specific dates, and many different ‘contract months’ for each commodity futures market. So, you can trade July 2014 Corn, or the December 2014 contract, or the July December 2016 contract, and so on – depending on how you are looking to approach the market and what term you are looking to hedge. A quick look at the CME’s website shows how there are different prices and trading volume in several various ‘months’:

Corn Futures Market

(Disclaimer: Past performance is not necessarily indicative of future results)
Table Courtesy: CME Group

Charting these different prices for the different contract months gives you what they call the price “curve”, with a downward sloping curve defined as a market in ‘backwardation’, with the further out prices lower than the nearer month prices. And an upward sloping curve defined as that uniquely futures term: Contango.  We’ve pointed out how Commodity ETF’s typically underperform the commodities they track due to the markets they track being in Contango, forcing the ETF to have to pay the roll yield (get out of the cheaper one, into the more expensive one) several times per year, and thought it would be worthwhile to check in on several markets to see whether they are currently in backwardation or contango.

Here are the Contango/Backwardation curves of 7 Commodity Markets extending into 2015.

Markets showing Contango:

Coffee Contango

(Disclaimer: Past performance is not necessarily indicative of future results)

Wheat Contango

Markets showing Backwardation:

Crude Backwardation

(Disclaimer: Past performance is not necessarily indicative of future results)

10 Yr Note Backwardation

(Disclaimer: Past performance is not necessarily indicative of future results)

Mixed Markets:

Corn Mix

(Disclaimer: Past performance is not necessarily indicative of future results)

Lean Hogs Mix

(Disclaimer: Past performance is not necessarily indicative of future results)

Cocoa Mix_1

See the original article >>

Higher Wheat Prices More Complex Than Ukraine Turmoil

By: Ben Potter

A month-long rally has seen wheat prices trading north of $7 per bu. for the first time since last November. All fingers point to the unrest in the Ukraine – but that may not actually be the main driving force behind the market gains, according to U.S. Wheat Associates market analyst Casey Chumrau.

"There is little doubt that the market was factoring in some concern over the political situation in a country that captured 6% of the world wheat market in 2013/14," she says. "But, the primary fuel for a 15% increase in the Kansas City Board of Trade May hard red winter wheat contract in just 13 trading days include real fears about droughts around the globe, potential freeze damage in the southern U.S. plains and position changes by the big index funds."

For now, all signs still point to normal export operation in Ukraine, Chumrau says. The country has already shipped more than 76% of its 2013/14 crop, according to Global Trade Atlas. Plus, Ukrainian ports are located relatively far away from the current political situation. Also, a large percentage of Ukraine’s wheat exports are destined for feed use, Chumrau adds.

Even so, some reports indicate traders and customers will be hesitant to enter into new contracts for Ukrainian wheat, given current political and financial uncertainties, Chumrau says.

"If it persists, a perception of higher risk could affect eth global supply and demand balance, particularly into the 2014/15 marketing year," she says. "Global supplies are already tight due to record-breaking consumption four of the past six years. As it is in the United States, the real concern for the new wheat crop in Ukraine and southern Russia is drought."

In the end, precipitation usually trumps politics, Chumrau says. And whatever happens overseas, the "U.S. wheat store is always open," she adds.

"U.S. wheat farmers have always produced enough wheat to supply the domestic market and still make half their crop available to the world," she says. "The U.S. wheat supply chain is always ready to help customers with both planned and unforeseen demands."

See the original article >>

Another China Crack: Ultra-Luxury Hong Kong Real Estate Being Dumped For Cash

by David Stockman

The Fed’s policy of keeping money market rates at 0% (ZIRP) for what will be seven years running has unleashed distortions, deformations and rampant speculations throughout the global financial system. The reason is straight-forward: ZIRP is a massive central bank subsidy to the carry trades. When the speculator’s cost of goods is set at zero and pegged at that level for the indefinite future, central banks set off a massive scramble for any and all financial assets that have a yield or appreciation rate north of zero. In due course, therefore, the financial system becomes completely ensnared in the business of extracting rents from the spreads between the false debt and asset prices pegged by the monetary central planners, rather than performing its essential capitalist function of price discovery and capital allocation.

Worse still, this destruction of honest market signals contaminates the entire world financial system due to the dollar’s dominate role. In fact, other central banks replicate the Fed’s money printing excesses in order to defend their own pegged exchanged rates and the export-based mercantilism that prevails in most of the EM and Asian economies.

Nowhere is this more evident than in Hong Kong’s ultra-luxury housing market. First, since the Hong Kong dollar has long been pegged to the USD, the monetary authority has had to massively expand its liabilities in response to the Fed’s money printing spree since late 2008. Accordingly, the Hong Kong dollar interest rate has been pinned to the floorboard for five straight years, fueling a massive speculation in real estate that has taken the price of luxury properties to manic levels.

At the same time, the People Printing Press of China has essentially outdone the Fed, generating an internal RMB-based credit bubble of monumental size. Total credit market debt rose from $9 trillion in 2008 to nearly $25 trillion today, thereby providing the financial wherewithal for the greatest boom in construction, infrastructure and industrial investment in recorded history. Accordingly, over the last five years the red capitalists of China have minted more paper millionaires and billionaires than the gilded ages of Western capitalism ever did.

Not surprisingly, newly minted mainland tycoons transferred some of their winnings from coal mines and real estate projects to Hong Kong’s soaring real estate market, believing that prices of luxury condos do, in fact, grow to the sky. But, alas, it turns out they don’t. Hong Kong authorities have had to impose drastic administrative controls and taxes to cool down the rampaging real estate sector, and the comrades in Beijing are now also desperately scrambling to dampen the volcanic credit bubble on the mainland.

Suddenly, the tycoons need cash and the bid has disappeared from the nosebleed section of the Hong Kong real estate market. As Zero Hedge documents below, China’s ultra-wealthy are now dumping their ultra-luxury pads. But the cracks in the China story are merely the vanguard: there is no place on the planet exempt from the global financial bubble created by the world’s rogue central banks during the last decades.

By Tyler Durden at Zero Hedge

http://www.zerohedge.com/news/2014-03-19/music-just-ended-wealthy-chinese-are-liquidating-offshore-luxury-homes-scramble-cash

One of the primary drivers of the real estate bubble in the past several years, particularly in the ultra-luxury segment, were megawealthy Chinese buyers, seeking to park their cash into the safety of offshore real estate where it was deemed inaccessible to mainland regulators and overseers, tracking just where the Chinese record credit bubble would end up. Some, such as us, called it “hot money laundering”, and together with foreclosure stuffing and institutional flipping (of rental units and otherwise), we said this was the third leg of the recent US housing bubble. However, while the impact of Chinese buying in the US has been tangible, it has paled in comparison with the epic Chinese buying frenzy in other offshore metropolitan centers like London and Hong Kong. This is understandable: after all as Chuck Prince famously said in 2007, just before the first US mega-bubble burst, “as long as the music is playing, you’ve got to get up and dance.” In China, the music just ended.

But more so than mere analyses which speculate on the true state of the Chinese record credit-fueled economy, such as the one we posted earlier today in which Morgan Stanley noted that China’s “Minsky Moment” has finally arrived, we now can judge them by their actions.

And sure enough, it didn’t take long before the debris from China’s sharp, sudden attempt to “realign” its runaway credit bubble, including the first ever corporate bond default earlier this month, floated right back to the surface.

Presenting Exhibit A:

Cash-strapped Chinese are scrambling to sell their luxury homes in Hong Kong, and some are knocking up to a fifth off the price for a quick sale, as a liquidity crunch looms on the mainland.

Said otherwise, what goes up is now rapidly coming down.

Wealthy Chinese were blamed for pushing up property prices in the former British territory, where they accounted for 43 percent of new luxury home sales in the third quarter of 2012, before a tax hike on foreign buyers was announced.

The rush to sell coincides with a forecast 10 percent drop in property prices this year as the tax increase and rising borrowing costs cool demand. At the same time, credit conditions in China have tightened. Earlier this week, the looming bankruptcy of a Chinese property developer owing 3.5 billion yuan ($565.25 million) heightened concerns that financial risk was spreading.

Some of the mainland sellers have liquidity issues – say, their companies in China have some difficulties – so they sold the houses to get cash,” said Norton Ng, account manager at a Centaline Property real estate office close to the China border, where luxury houses costing up to HK$30 million ($3.9 million) have been popular with mainland buyers.

Alas, as the recent events in China, chronicled in minute detail here have revealed, the “liquidity issues” of the mainland sellers are about to go from bad to much worse. As for Hong Kong, it may have been last said so long ago nobody even remembers the origins of the word but, suddenly, it is now a seller’s market:

Property agents said mainland Chinese own close to a third of the existing homes that are now for sale in Hong Kong – up 20 percent from a year ago. Many are offering discounts of 5-10 percent below the market average – and in some cases as much as 20 percent - to make a quick sale, property agents and analysts said.

Also known as a liquidation. And like every game theoretical outcome, he who defects first, or in this case sells, first, sells best. In fact, since panicked selling will only beget more selling, watch as prices suddenly plunge in what was until recently one of the most overvalued property markets in the world. And with prices still at nosebleed levels, not even BlackRock would be able to be a large enough bid to absorb all the slamming offers as suddenly everyone rushes to cash out.

The biggest irony: after creating ghost towns at home, the Chinese “uber wealthy” army is doing so abroad.

In a Hong Kong housing development called Valais, about 10 minutes drive from the Chinese border, real estate agents said that between a quarter and a half of the 330 houses are now on sale. At the development’s frenzied debut in 2010, a third of the HK$30-HK$66 million units were sold on the first day, with nearly half going to mainland China buyers.

Dubbed a “ghost town” by local media, the development built by the city’s largest developer, Sun Hung Kai Properties Ltd (0016.HK), is one of many estates in Hong Kong where agents are seeing an increasing number of Chinese eager to sell.

“Many mainland buyers bought lots of properties in Hong Kong when the market was red-hot three years ago,” said Joseph Tsang, managing director at Jones Lang LaSalle. “But now they want to cash in as liquidity is quite tight in the mainland.”

Perhaps our post from yesterday chronicling the crash of the Chinese property developer market was on to something. And of course, as also described in detail, should China’s Zhejiang Xingrun not be bailed out, as the PBOC sternly refuted it would do on Weibo, watch as the intermediary firms themselves shutter all credit, and bring the Chinese property market, both domestic and foreign, to a grinding halt (something he highlighted in our chart of the day).

Meanwhile, the selling rush is on.

In a nearby development called The Green – developed by China Overseas Land & Investment (0688.HK) – about one-fifth of the houses delivered at the start of this year are up for sale. More than half of the units, bought for between HK$18 million and HK$60 million, were snapped up by mainland Chinese in 2012.

Because so much changes in just over a year.

“Some banks were chasing them (Chinese landlords) for money, so they need to move some cash back to the mainland,” said Ricky Poon, executive director of residential sales at Colliers International. “They’re under greater pressure from banks, so they’re cutting prices.”

In West Kowloon district, an area where mainland Chinese bought up close to a quarter of the apartments in many newly-developed estates, some Chinese landlords are offering discounts on the higher-end, three- to four-bedroom apartments they bought just a few years ago.

This month, a Chinese landlord sold a 1,300 square foot (121 square meter) apartment at the Imperial Cullinan – a high-end estate developed by Sun Hung Kai in 2012 – for HK$19.3 million, 17 percent less than the original price. The landlord told agents to sell the flat “as soon as possible,” said Richard Chan, branch manager at Centaline Property in West Kowloon.

In the same area, a 645 square foot, 2-bedroom flat in the Central Park development was sold in just two days after the Chinese owner put it on the market at HK$6.5 million in what agents called the year’s best bargain – the cheapest price for a unit of its kind over the past year.

Don’t worry there will be many more bargains. Why? Because what was once a buying panic – as recently as months ago – has finally shifted to its logical conclusion. Selling.

“The most important thing for them is to sell as soon as possible,” Centaline’s Chan said. “In the past two weeks, those who were willing to cut prices were mainland Chinese. It is going to have some impact on the local property market, that’s for sure.”

Indeed. And once the Hong Kong liquidation frenzy is over, and leaves the city in a state of shock, watch as the great Chinese selling horde stampedes from Los Angeles, to New York, to London, Zurich and Geneva, and leave not a single 50% off sign in its wake.

The good news? All those inaccessibly priced houses that were solely the stratospheric domain of the ultra-high net worth oligarch and criminal jet set, will soon be available to the general public. Especially once the global housing bubble pops, which may have just happened.

See the original article >>

Stocks Bull Market Continues

By: Tony_Caldaro

The market started the week gapping up after last Friday’s decline to SPX 1840. The rally carried it into FOMC Wednesday to SPX 1874. Then right after the FOMC statement was released the market dropped to SPX 1850. Another rally carried the market to match the all time high at SPX 1884 on Friday. Then right after the open Techs sold off and the market pulled back again. Another choppy week, only this time to the upside. For the week the SPX/DOW were +1.45%, the NDX/NAZ were +0.7%, and the DJ World index rose 0.7%. Economic reports for the week were positive. On the uptick: NY/Philly FED, capacity utilization, industrial production, NAHB, housing starts, building permits, CPI, leading indicators and the monetary base. On the downtick: existing home sales, and weekly jobless claims edged higher. Next week: Q4 GDP, Durable goods orders, and more Housing reports.

LONG TERM: bull market

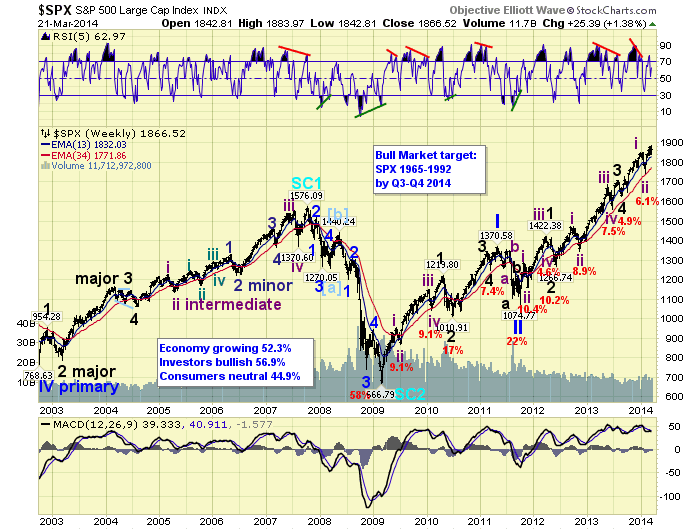
We continue to count this bull market as a five Primary wave Cycle wave [1]. Primary waves I and II completed in 2011 and Primary wave II has been underway since then. Primary I divided into five Major waves with a subdividing Major wave 1. Primary III has also divided into five Major waves. However, Major waves 1 and 3 subdivided and likely Major 5 is subdividing as well.

From the Major wave 4 low in August 2013, we have labeled Intermediate wave one at SPX 1851, Int. two at SPX 1738, and Int. three underway now. Int. wave three has already made a new bull market high at SPX 1884, and the NDX/NAZ have made new highs too. However, the DOW continues to lag as noted with the three chart illustration in last weekend’s report. The DOW has still not exceeded its December 2013 high. Nevertheless, we see Primary wave III continuing in at least the SPX/NDX/NAZ in the coming months.

MEDIUM TERM: uptrend

The bull market in the SPX matched its all time high this week, but the DOW/NDX/NAZ did not. As a result the market remained choppy for the fifth week in a row. This may make sense to some as the first wave of this uptrend, Minor 1, was quite strong and unfolded in less than three weeks. Some choppiness was then expected, as we have been anticipating this uptrend to last for a few months with only an upside target of SPX 1962+.

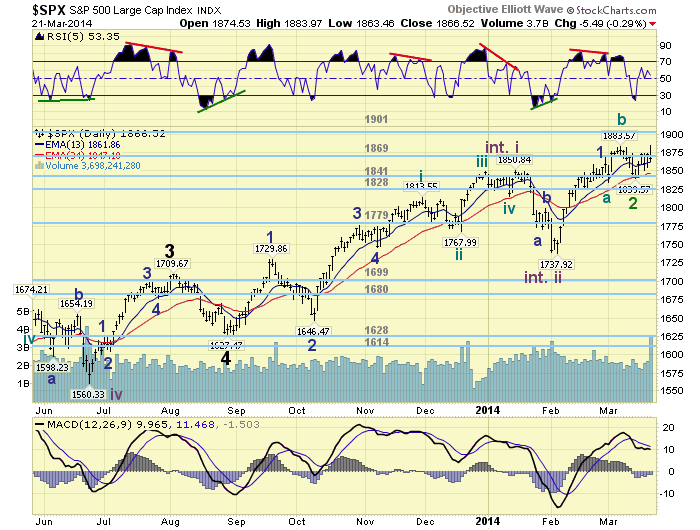
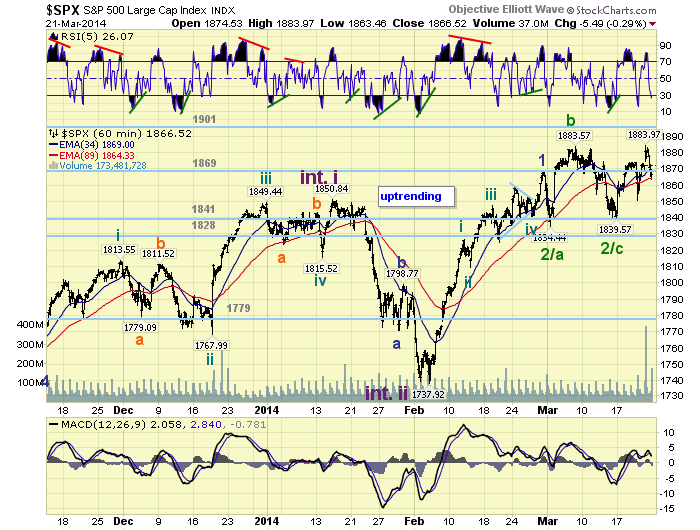
We are counting this Int. wave three uptrend as five Minor waves. Minor 1 completed at SPX 1868. Minor wave 2, however, appears to have formed an irregular failed flat SPX: 1834-1884-1840. The rise above SPX 1868 makes it irregular, and the failure to reach the wave A low at 1834 makes it a failed flat. At the recent SPX 1840 low we had an oversold condition in all four major indices, and a positive divergence on the hourly chart. The market responded by rallying this week. Once SPX 1884 is cleared we will feel more confident about labeling Minor wave 3 underway. Thus far we have maintained tentative green labels for all of the activity since the Minor 1 high at SPX 1868. Medium term support is at the 1841 and 1828 pivots, with resistance at the 1869 and 1901 pivots.

SHORT TERM

Short term support is at the 1841 and 1828 pivots, with resistance at the 1869 pivot and SPX 1884. Short term momentum declined to oversold after hitting quite overbought on Friday. The short term OEW charts have been vacillating of late, ending the week positive with the reversal level still at SPX 1869.

As noted above the market activity from the Minor wave 1 high at SPX 1868, and even before, has been quite choppy. It does look like Minor wave 2 bottomed recently at SPX 1840. The rally from that low, however, is also a bit choppy: 1874-1850-1884-1863. Either the market is setting up, with subdividing waves, for a surge higher. Or this week’s rally is corrective as well, and a retest of SPX 1834-1840 is next. With the SPX hitting its high right after the open on Friday, and then pulling back during options expiration. We lean towards the former rather than the latter. Once SPX 1884 is cleared we will likely label the two recent highs as Minute i at SPX 1874, and Micro 1 at 1884. Best to your trading!

FOREIGN MARKETS

The Asian markets were quite mixed on the week losing 0.4%.

The European markets were all higher on the week gaining 2.3%.

The Commodity equity group also rose gaining 4.3%.

The DJ World index is still uptrending and gained 0.7%.

COMMODITIES

Bonds continues to downtrend losing 1.0% on the week.

Crude appears to be downtrending but gained 0.6% on the week.

Gold appears to entering a downtrend and lost 3.5% on the week.

The USD set up a positive divergence for a potential uptrend, it gained 1.0% on the week.

NEXT WEEK

Tuesday: Case-Shiller, FHFA housing, Consumer confidence and New home sales. Wednesday: Durable goods orders. Thursday: Q4 GDP, weekly Jobless claims and Pending home sales. Friday: Personal income/spending, PCE and Consumer sentiment. On Monday, FED governor Stein gives a speech at 9am. Best to your weekend and week!

See the original article >>

Yellen influence continues on the markets

By Debarati Roy and Megan Durisin

Goldman Sachs Group Inc. and Societe General SA can thank Janet Yellen for helping to get their bearish forecasts for gold back on track.

After hedge funds piled into the precious metal this year with the most bullish bets in 16 months, defying the predictions of lower prices by Goldman and SocGen, gold tumbled last week by the most since November as Federal Reserve Chair Yellen said economic stimulus could end this year, with interest rates starting to rise in early 2015.

Bullion, which slid last year by the most since 1981 as some investors lost faith in the metal as a store of value, rebounded 9.1 percent in 2014 as the global expansion faltered and tensions escalated in Ukraine. Those bullish influences are “transient,” and the U.S. economy will recover from a weather- driven slowdown, pushing gold lower, Goldman’s Jeffrey Currie reiterated in a March 20 report.

“The sentiment probably had gotten a little ahead of itself,” said Ted Harper, who helps manage more than $9 billion at Frost Investment Advisors LLC in Houston. “Gold is going to be somewhat problematic from an investment standpoint over the next six to 12 months. We’re probably looking to a relatively higher and quicker increase on rates, which is a headwind for precious metals.”

Weekly Decline

Gold (COMEX:GCJ14) futures in New York declined 3.1 percent last week to $1,336 an ounce, while the Standard & Poor’s GSCI Spot Index of 24 raw materials fell 0.5 percent. The MSCI All-Country World index of equities rose 0.7 percent, while the Bloomberg Dollar Index, a gauge against 10 major trading partners, rose 0.6 percent. The Bloomberg Treasury Bond Index fell 0.5 percent.

The net-bullish position in gold rose 13 percent to 138,429 futures and options in the week ended March 18, the most since November 2012, U.S. Commodity Futures Trading Commission data show. Short holdings fell for a fifth week, the longest streak in three years.

Investor holdings in exchange-traded products backed by bullion posted the first weekly decline in four last week. On March 19, the Fed cut its monthly bond purchases by $10 billion to $55 billion. Yellen said the asset buying could end this fall and benchmark interest rates could rise about six months later. Gold jumped 70 percent from December 2008 to June 2011 as the Fed pumped more than $2 trillion into the financial system and held borrowing costs near zero percent to boost the economy.

“We continue to believe that the economic momentum in the U.S. shows further improvement,” said Michael Haigh, the New York-based head of commodities research at SocGen who correctly predicted the 2013 bullion rout. “We reiterate our very bearish outlook for this year. Prices could drop below $1,000. I would not rule that out.”

SocGen, Goldman

Haigh’s outlook for a decline echoes Goldman’s Currie, who on April 10 issued a sell recommendation, before gold plunged 13 percent in a two-session drop that ended April 15 and left prices in a bear market. Currie said this month that the chances are increasing the metal will drop below $1,000.

“The only thing that would make us rethink our thesis would be a significant reassessment of U.S. economic-growth prospects for the second half of this year,” Currie said in an e-mailed response to questions from Bloomberg News.

Prices reached a six-month high of $1,392.60 on March 17 as President Vladimir Putin’s bid to annex the Crimea region of Ukraine spurred the biggest standoff between the West and Russia since the Cold War. While the tension has calmed, “any kind of flare up will definitely bring back some people to gold,” said James Paulsen, chief investment strategist at Wells Capital Management, which manages about $360 billion.

Inflation Expectations

For the first time in 19 months, investors are stepping up their buying of exchange-traded funds that hold Treasuries tied to cost-of-living increases, data compiled by Bloomberg show. On March 7, inflation expectations over the next five years reached the highest level since May on signs of wage growth. The price- outlook measure is still down almost 20 percent from a year ago.

“We have gold as an inflation hedge,” said Adam Strauss, Chicago-based co-manager of the $300 million Appleseed Fund at Pekin Singer Strauss Asset Management Inc. “Some of the inflation forces have dissipated significantly over the last 12 months. That has not changed at all our long-term outlook.”

Bullion jumped more than 500 percent in the 12 straight years of gains through 2012, reaching a record $1,923.70 in September 2011. Prices fell into a bear market in April partly as a rally in U.S. equities cut demand for haven assets. The Standard & Poor’s 500 Index reached a record last week.

Record Wagers

Combined net-wagers across 18 U.S.-traded commodities climbed 1.2 percent to 1.71 million contracts, the most since the data begins in June 2006, the CFTC data show. Holdings climbed for a 10th week, the longest streak on record.

Investors added $562.7 million into U.S.-based ETFs tracking commodities in the five days through March 20, data compiled by Bloomberg show. Precious metals saw an inflow of $555.3 million, while $24 million was pulled from energy funds.

Bullish bets on crude oil fell 7.9 percent to 302,320 contracts, dropping for a second straight week. West Texas Intermediate gained 0.6 percent in New York last week, the first gain this month, as the U.S. announced more sanctions on Russia, the world’s biggest energy exporter.

Speculators increased net-short bets in copper to 21,965 from last week’s 10,473 contracts. Futures in New York fell to a 44-month low on March 19. Stockpiles tracked by the Shanghai Futures Exchange jumped 67 percent this year.

Agriculture Holdings

A measure of speculative positions across 11 agricultural products rose 6.7 percent to 1.06 million contracts, the highest since February 2011. Investors more than doubled their wheat net-long holding to 24,036, the most bullish since October.

Wheat in Chicago is heading for the biggest monthly gain since July 2012 and prices reached a 10-month high last week. Cold, dry weather has reduced the outlook for winter crops in the U.S., the world’s biggest exporter, just as a rail backlog delays supplies from Canada. Farmers in Ukraine, on pace to be the sixth-largest shipper, have cut grain sales to “very minimum” levels amid currency declines, according to UkrAgroConsult, a research company in Kiev.

“There are opportunities in some specific commodities, rather than in the entire asset class,” said Sameer Samana, the St. Louis-based international strategist at Wells Fargo Advisors LLC. His firm oversees about $1.3 trillion. “In agriculture, weather conditions have a big role to play. For gold, prices will move lower with talk about the rate hike.”

See the original article >>

Message to the Fed: Here Are a Few Things That You Can’t Do

by ffwiley

[A]sset purchases are not on a preset course, and the Committee’s decisions about their pace will remain contingent on the Committee’s outlook for the labor market and inflation as well as its assessment of the likely efficacy and costs of such purchases.
-March 19 FOMC statement

The excerpt above or some variation has appeared in every one of the Fed’s post-FOMC meeting statements since the beginning of QE3 in September 2012.

Unfortunately, it doesn’t give us much comfort. We don’t see evidence of the Fed’s economists accurately gauging QE’s “efficacy and costs,” notwithstanding its oh-so-slow wind down. On the contrary, history shows that these economists have an inflated view of what they can achieve with monetary policy.

Take the link between QE and jobs, for example. We were struck by the following question, asked recently by commenter “liongterm investor”:

How does a dollar (or trillion dollars) added to the Fed balance sheet create a job? This is a serious question; I am not trying to bait someone into an argument …  What I do understand about QE is how money the ends up [in] excess reserves earning interest from the Fed larger than what my deposits or short term treasuries earn. I also understand how the money can end up driving up equity prices. But job creation??

We don’t doubt that “liongterm investor” is aware of “wealth effects” – the idea that a booming stock market encourages happy investors to buy an extra luxury item or two, and this might eventually create a few positions at, say, Tiffany. But it’s not a very powerful effect, is it? Nor can we be sure that it won’t come back to bite us, for reasons we’ve written about in the past (see here, here, here or here).

What’s more, questions of what the Fed can and can’t achieve go beyond QE. We touched on the limitations of monetary intervention in recent research on where the economy stands today:

We’ll build on that research below with a handful of charts showing that there are many things the Fed can’t do when it comes to manipulating the economy.

Household borrowing and spending: What the Fed can’t do

In a debt-saturated economy, the Fed can’t prevent mortgage demand from stagnating:

things fed cant do 1

Based on 40 years of history (and the fact that banks need to cover their costs), the Fed can’t shrink the spread between mortgage and deposit rates much further than it did in 2012:

things fed cant do 2

Consequently, the Fed can’t push debt service costs much below current levels:

things fed cant do 3

Nor can lower debt payments provide much of a subsidy in the first place, since falling debt service is matched by declining interest income:

things fed cant do 4

More broadly, there’s a downwards trend in income after tax and financial obligations, and the Fed can do little about this:

things fed cant do 5

Business borrowing and spending: What the Fed can’t do

The Fed can’t convince businesses to revert right away to the borrowing habits of recent bubbles:

things fed cant do 6

Especially as net business debt is already at an all-time high:

things fed cant do 7

And while the Fed can affect the amount of cash deposits, it can’t force businesses to make spending decisions based on those cash balances:

things fed cant do 8

Consequently, business spending growth has slowed alongside consumer spending, and the Fed can do little about either of these developments:

things fed cant do 9

Housing: What the Fed can’t do

The Fed can’t undo past overbuilding, and therefore, it can’t conjure up another residential construction boom (for awhile, at least):

things fed cant do 10

What the Fed can do

On the other hand, here are a few developments that our central bank can accurately claim to have achieved:

  1. Lifting prices on stocks, houses and other risky assets, which creates a wealth effect and boost for high-end consumption.
  2. Creating windfall profits for financial firms aiming to exploit the bubble, then bust and then bubble again pattern in the housing market.
  3. Creating windfall profits for primary dealers through the Fed’s Treasury and mortgage purchases (even as central bankers may occasionally discipline traders who aren’t careful).
  4. Preserving the “heads I win, tails you (the taxpayer) lose” mentality in the financial sector that leads to reckless risk-taking.

What the Fed shouldn’t do

Another way to look at the data and observations above is to ask why the Fed’s achievements have been so limited (and of dubious value). It’s evident that the economy isn’t growing strongly because of conditions that central bankers themselves created, by encouraging excessive borrowing and disregarding moral hazard.

In other words, the problem isn’t so much that the Fed can’t deliver another debt-fueled boom, but that it shouldn’t be trying to cure a credit bust with more borrowing in the first place.

Sadly, though, this idea falls in the same category as the notion that the Fed’s balance sheet isn’t the right tool for job creation. It’s too damning a thought to be accepted by central bankers who’ve shackled themselves to a philosophy of ceaseless intervention. It’s also too basic for economists who prefer abstract theories and mathematical models over reality-based thinking.

Such straightforward concepts as not fighting a debt hangover with more debt just don’t enter into the Fed’s calculus about “efficacy and costs,” even as they make perfect sense to so many of the rest of us.

See the original article >>

Stock Market Dispenses Another Warning Shot

by Pater Tenebrarum

Friday's Odd Action

The stock market has spent much of this year trying to exceed its year end 2013 high, and finally succeeded in terms of several indexes in late February/early March. However, it has also dispensed a number of warning shots along the way. On Friday, another such warning shot arrived. A number of momentum stocks were whacked quite badly on Friday, but interestingly, many have actually begun to decline about two weeks ago already.

Friday left the market with a not very pretty daily candle, but what is probably most noteworthy about the action is that it happened on tremendous trading volume. Partly this can probably be ascribed to the expiration, but it is still a bit of an exclamation point considering the many divergences we have been able to observe recently.

Below are a few charts that illustrate the situation. First a look at the Nasdaq and various momentum issues that have been favorites of speculators for some time and have begun to founder a bit.

Nasdaq, 5 minute

Nasdaq, 5 minute chart. It gapped up at the open on Friday and immediately started selling off – click to enlarge.

Next a look at a few daily charts of several momentum stocks that show that the weakness actually started already in early March. Underneath continued strength in the overall market, many leading stocks have begun to deteriorate. Mind, this is not a comment on whether these particular stocks are overvalued (they most probably are) or on their business (which is probably good). We are merely interested in technical conditions here, and have picked the individual stocks almost at random. We could have made this a much longer list.

PCLN daily

PCLN, daily – one of the strongest momentum stocks until early March, but it has been declining since then, even though the NDX almost recaptured its early March high last week – click to enlarge.

NFLX daily

NFLX daily, another momentum favorite. Its price action was quite similar, also peaking in early March. Friday's accelerated sell-off looks a bit worrisome to our eye – click to enlarge.

BBH, daily

BBH, the biotech ETF. Up until recently, the Rydex biotech sector fund held the by far biggest share of bullish Rydex assets (more than 35% at the peak). BBH mainly represents biotech big caps such as Gilead, Biogen, Amgen, Celgene, etc. – it peaked in late February already and had a very bad hair day on Friday – click to enlarge.

AMZN, daily

AMZN daily – this stock peaked shortly before its late January earnings report and has diverged from the NDX as well as other momentum stocks since then – click to enlarge.

Russian Sanctions Are Bad for Business

Although the Nasdaq was weakening right from the gap-up opening tick, the broader market attempted an intraday recovery on Friday, which appeared to be cut short when news came over the wires that president Obama had imposed sanctions on Bank Rossiya, a small Russian bank thought to be used by people 'close to Putin'. This is bad for business, no matter what one thinks of Mr. Putin and his policies. It is also a legally quite dubious move, as Mish correctly points out. It is as though a court were punishing Bob for what John has done, since obviously, Bank Rossiya neither 'invaded' the Crimea, nor did it organize the referendum there (we are putting 'invaded' into quote marks, because Russia didn't really invade either. Its soldiers were already stationed on the Crimea, quite officially. They did of course spread out from their base, so it's obviously not a clear-cut case).

In the Western media there is a tendency to report on the sanctions hitting various Russian oligarchs as if they were solely bad news for said oligarchs. Apparently no-one has really thought through yet that if they withdraw their capital, it will also be bad news for all those places where that capital is now invested.

This is one reason why we are saying this move is bad for business, no matter what one's views on the political backdrop are. To the extent that sanctions are hitting average Russians (and reports indicate that quite a number of average Russians found that their credit cards would suddenly no longer work in the West), they only help to strengthen Mr. Putin politically at home, while punishing even more people who had nothing to do with the events.  Alas, 'we' must not 'lose face', so we are eagerly shooting ourselves in the foot.

Moreover, anyone au fait with history should be aware that these tensions vastly increase long term political risk. Most Russians see things in a completely different light from the picture presented in the Western media. Don't be misled by the fact that our media like to quote Putin's political opponents a lot – they enjoy no broad political support, in fact they are a small minority. The media in Russia also report on events in a lopsided manner of course, and partly the views of the average Russian are influenced by that fact (don't forget though that the Russians are people who were for many decades quite cynical about their press).

We are pretty sure that Mr. Putin isn't itching for a fight with NATO (actually, Russia remains in the 'NATO partnership for peace'), but who knows how a future leader might think about this possibility in 20 years time? There is also a tendency to underestimate the country's military prowess, but it no longer has an army relying on shoddy Soviet equipment (funny enough, that rag-tag army was consistently overestimated by the West way back when), not to mention that it continues to be the world's second-largest nuclear power. Why did the West think it necessary to blunder into Kiev and take a hand in events there? Russians see it as the West dabbling in things that are none of its business. Sanctions only confirm to many the picture of the West as an enemy rather than a partner, and we can be pretty sure that the average Russian also believes that Russia has the right to pursue an independent foreign policy.

Let us get back though to the business aspect. Let's assume that it is true that Russia will fall into recession, as is argued here. How is that going to be good for the global economy? It seems more likely it will affect all of Russia's major trading partners as well (hello EU!). The US economy is one of the least directly affected economic regions, but it will be affected indirectly. Global economic interdependence is after all higher than ever, and aside from Russia we also have a marked weakening of China's economy to consider. The times when it didn't matter what happened in these economies are long past.

Here is a look at the SPX:

SPX-5 minute

SPX, 5 minute candles. On Friday it attempted to regain its opening high, but then deteriorated rather quickly. Perhaps it was only a coincidence that the sanctions-related news broke around that time, but it may not be – click to enlarge.

SPX, daily

The daily chart shows a reversal candle on extremely high volume. Volume often surges on expiration, but this is still quite an outlier – click to enlarge.

It is also remarkable that the DJIA has not confirmed the other indexes this year. Per experience, this is actually more important than one would think. The DJIA is not cap weighted (instead it is price weighted) and only harbors 30 stocks. Why should it matter what it does? We don't know, we only know that it has mattered on a number of previous occasions. Especially memorable in this context were the divergences between DJIA and SPX/Nasdaq that occurred  in the year 2000. We also remember that the signal was widely dismissed as 'meaningless' at the time. A memorable positive divergence occurred at the 2002/2003 lows.

DJIA daily

The DJIA has not confirmed the other indexes this year – click to enlarge.

And lastly, a chart that was recently published by sentimentrader.  It shows the Citi 'Economic Surprise' index compared to the SPX. Interestingly, the economic surprise index seems to lead the stock market instead of the other way around. Readers may recall that we have frequently mentioned on previous occasions that the stock market has essentially lost its 'discounting function' since around 1998. Since then, it has more often been a coincident or lagging rather than a leading economic indicator.

A further note on this: in a 'normal' interest rate environment, the yield curve tends to invert prior to market peaks and economic downturns. This phenomenon can however no longer be observed in a structurally sufficiently damaged economy in which the central bank is holding short term rates close to zero. Japan has experienced several cyclical downturns since 1989 that were not preceded by yield curve inversions.

Citi surprise index

The Citi economic surprise index and stocks – a lead-lag function different from what one would normally expect – click to enlarge.

See the original article >>

Are Nation States Beginning to Splinter?

by Pater Tenebrarum

The Counterrevolution to the EU's Centralization

Venice just held a 'non-binding' referendum on whether the city should once again become an independent city-state and secede from Italy. An astonishing 89% voted 'yes' (which makes the outcome of the Crimea referendum no longer look 'strangely one-sided'). This happens just as Scotland's vote whether to remain part of the UK is approaching and Catalonia is preparing to vote whether to remain with Spain.

“Venetians have voted overwhelmingly for their own sovereign state in a ‘referendum’ on independence from Italy.

Inspired by Scotland’s separatist ambitions, 89 per cent of the residents of the lagoon city and its surrounding area, opted to break away from Italy in an unofficial ballot.

The proposed ‘Repubblica Veneta’ would include the five million inhabitants of the Veneto region and could later expand to include parts of Lombardy, Trentino and Friuli-Venezia Giulia. The floating city has only been part of Italy for 150 years. The 1000 year–old democratic Serenissima Repubblica di Venezia, was quashed by Napoleon and was subsumed into Italy in 1866.

Wealthy Venetians, under mounting financial pressure in the economic crisis, have rallied in their thousands, after growing tired of supporting Italy’s poor and crime ridden Mezzogiorno south, through high taxation.

Activists have been working closely with the SNP on their joint agendas, even travelling to Scotland alongside Catalonians and Basque separatists to take part in pro independence rallies. Campaigners say that the Rome government receives around 71 billion euros  each year in tax from Venice – some 21 billion euros less than it gets back in investment and services.

Organisers said that 2.36million, 73 per cent, of those eligible to take part voted in the poll, which is not recognised by the Rome government. The ballot also appointed a committee of ten who immediately declared independence from Italy. Venice may now start withholding taxes from Rome.”

(emphasis added)

And while the Scottish and Catalan pro-independence forces are toying with the idea of joining the EU, there is another part of Italy that wants to secede as well and wants to definitely get out of the EU – in fact, this goal appears to be one of its motives. The island of Sardinia – which contrary to Venice is actually quite a poor place – wants to leave Italy and join Switzerland instead (this would of course be a brilliant move for the Sardinians):

“As familiar as it is, however, the secessionist spirit has never manifested itself in quite the way a small group of activists is advocating in Sardinia. Angered by a system they say has squandered economic potential and disenfranchised the ordinary citizen, they have had enough. They want Rome to sell their island to the Swiss.

"People laugh when we say we should go to become part of Switzerland. That's to be expected," said Andrea Caruso, co-founder of the Canton Marittimo (Maritime Canton) movement. While many have dismissed the proposal as a joke, its supporters insist they are serious. "The madness does not lie in putting forward this kind of suggestion," said Caruso. "The madness lies in how things are now."

A ruggedly beautiful gem in the middle of the Mediterranean, Sardinia – one of Italy's five autonomous regions – has always had a strong identity of its own. DH Lawrence, visiting in 1921, described it as "belonging to nowhere, never having belonged to anywhere". For a minority of Sardinians, independence remains the island's best chance for success. Caruso and Enrico Napoleone, the two 50-year-old school friends behind Canton Marittimo, disagree with them. After decades of keeping faith in Rome, they now believe that staying in Italy can do no good- but fear that going it alone could end badly, too.

The answer, they say, lies more than 1,000km to the north. "Having good teachers is something which in life everyone considers positive. We don't educate our children at home; we try to find the best teacher in the school," said Caruso, a dentist from Cagliari. "Why, when we have this mentality with our children, do we have to renounce it when talking of our people? "We think of Switzerland as a good teacher who could lead us on a path of excellence."

As the 27th canton, Sardinia, so goes the argument, would bring the Swiss its miles of stunning coastline and untapped economic potential. Sardinia could retain considerable autonomy, while also reaping the benefits of direct democracy, administrative efficiency and economic wealth.

The fact that Switzerland is not in the EU is "definitely" a plus, say the activists. Like many Italians, they no longer believe in Brussels's ability to deliver the dream – both economic and cultural – they once thought it could.

(emphasis added)

One of these days, one of the secessionist movements in Europe is likely to succeed and then a domino effect may be let loose. The Crimea's recent change of allegiance has probably energized these movements further.

Italian-states-before-unification

Italian States prior to Italy's unification – click to enlarge.

Anachronism Nation State

And it is about time, too. The concept of the centralized, large-scale nation state is anachronistic and should be abandoned. The increasing centralization of the EU is going in the wrong direction. Once again it must be stressed that for the individual citizen, it matters not one whit whether self-important EU politicians and bureaucrats can 'throw around their weight on the international stage'.

What matters far more is that they would likely be treated a lot better and become more prosperous if everything fell apart into tiny independent territories. That would definitely not mean that there could be no free trade zone, or that every region would necessarily use a different currency. The main goals of the founders of the EU, namely free trade and free movement of capital and people need not be abandoned – on the contrary, they would likely be adopted without hesitation (see below why). When a great many small territories compete with each other for citizens, then they are all going to be forced to make a good offer that makes people want to stay. Large declines in taxes would be an immediate effect, but not the only effect that could be expected.

As Hans-Hermann Hoppe points out in this interview, the unification of the German states (Germany consisted of over 360 independent territories before 1794, and 39 were still left prior to the 1871 unification) was in many ways a big mistake in hindsight:

Q: “You want a return to “Kleinstaaterei”, the system of mini-countries of the 19th Century?

A:Take a look at the economic and cultural development. In the 19th century the area of what Germany is today was then the leading region in Europe. The major cultural achievements came at a time when there was no great central state. The small territories were in intense competition with each other. Everyone wanted to have the best libraries, theaters and universities. This region was significantly more advanced culturally and intellectually than France, which by then was already centralized. All culture in France is focused on Paris, the rest of the country fell into cultural obscurity.”

Q: ‘But free trade would be threatened by secession and a return to fragmented nations

A:  On the contrary. Small states have to trade. Their market is not big enough and they are not diversified enough to live independently. If they are not running free trade, they are finished after a week. However, a large country like America can be largely self-sufficient and is therefore less dependent on free exchange with other states. In addition, small and sovereign states cannot permanently dump the blame on others when something goes wrong with them. In the EU, Brussels is often blamed for all sorts of ills. In independent small states governments would, however, have to take responsibility for abuses in their own country. This has a pacifying effect on the relations among nations.”

Q: “If small states have their own currencies, that would be the end of the integration of capital markets.” 

A: Small states could not afford their own currencies because of the transaction costs. They would therefore strive for a common currency that is independent of and uninfluenced by the individual governments. There is a high probability that they would agree on a commodity money such as gold or silver, whose value is determined in the market. Kleinstaaterei leads to more market and less state intervention in the monetary system.”

Q: “If Europe were a collection of small states then on the international stage it would have no economic clout next to the large states.”

A:How then do Switzerland, Liechtenstein, Monaco and Singapore manage to be economically at the top? My impression is that these countries are wealthier than Germany and that the Germans were wealthy before they embarked on the adventure of the euro. We should free ourselves from the idea that business takes place between states. Business takes place between people and companies that produce here and there. Economies don’t consist of states competing against states but companies against companies. It is not the size of a country that determines its prosperity, but the ability of its citizens.”

(emphasis added)

Indeed, the facts support every one of Hoppe's contentions.

Secession Brought to its Ultimate Conclusion

In 'Power and Market', Murray Rothbard discusses among other things whether the free market could provide judiciary, police and defense services. In this section of the book there is also an interesting remark on secession. Rothbard not unreasonably asks why it is e.g. not held that Canada and the US are in a 'state of anarchy' relative to each other. After all, they don't have a single, centralized government. Why is it fine for Canada to be independent, but not, say for Texas? However, he follows this thought further to its ultimate conclusion:

“[...] once one concedes that a single world government is not necessary, then where does one logically stop at the permissibility of separate states? If Canada and the United States can be separate nations without being denounced as being in a state of impermissible “anarchy,” why may not the South secede from the United States? New York State from the Union? New York City from the state? Why may not Manhattan secede? Each neighborhood? Each block? Each house? Each person? But, of course, if each person may secede from government, we have virtually arrived at the purely free society, where defense is supplied along with all other services by the free market and where the invasive State has ceased to exist.”

(emphasis in original)

Indeed, there is no reason why one could not arrive at a stateless society at some point. Small territories such as those Germany consisted of prior to 1794 could probably no longer really be called 'states' anyway.

Ger1871

Germany prior to the 1871 unification – 39 independent states (and they all used precious metals as money, so it didn't matter whose face was on the money – it was a unified currency anyway).

See the original article >>

The S&P 500 bullish ride could be over

By Gregor Horvat

S&P 500 Daily: Wave five reversing from resistance zone

The S&P 500 has been in bullish mode since February but it looks like that the direction of a trend could be changing now after a rally up to 1880/1920 Fibonacci and channel resistance area, where we see zone for a completed fifth wave in wave 5) of (3). So far, market is reversing nicely down with a weekly close price at 1839 so we suspect that market will continue to the downside now for a three wave pullback down in blue wave (4). We are also looking at the RSI that is reversing from 60/70 area that can be signaling for a bearish pullback, similar like in the past few months.

GOLD Daily: Triangle; now wave C down

On gold, we presented you a triangle idea few weeks back, with wave C rally up to 1380/1400 resistance area. Market sold of sharply from that levels last week and it seems that price is ready to continue lower in the next few days and weeks as current decline looks impulsive on the intraday basis. With that said, we suspect that wave D is now underway that may reach revels even around 1240/1270.

OIL Daily: Wave B at the support zone

Crude oil turned bearish as expected in March after hitting 105.00 level where we see a completed wave A, so current leg down is most likely wave B that may form a new based for this market around 61.8% retracement level. A bounce from that zone, in impulsive fashion, will put wave C in play for rally up to 106.00 area to completed wave 2).

Further weakness from current levels and down to 94.00 in impulsive fashion will suggest an early reversal in trend of crude oil. In that case we would put alternate count in play; completed wave 2) 105.10.

See the original article >>

Ukraine crisis may cause grain export 'bottleneck'

by Agrimoney.com

Ukraine grain exports could face a "bottleneck" next season if Moscow imposes strongarm tactics on a three-mile-wide stretch of water next to Crimea, SovEcon warned, as it forecast further rises in Russian wheat prices.

Russia's annexation of Crimea risks costing Ukraine not only the grain export capacity in the region itself but in its two eastern ports of Mariupol and Berdyansk.

These ports open not directly onto the Black Sea, but onto the Azov Sea, requiring vessels to negotiate the narrow Kerch Strait between Russia and Crimea to reach Ukraine's grain export buyers, largely in the Middle East and North Africa.

'Ukraine bottleneck'

"I hope it does not happen, but now that Russia controls both side of the Kerch Strait, it if wanted to introduce, perhaps, a levy on exports passing through, it could do that," Andrey Sizov Jr, managing director at Moscow-based SovEcon, said.

"That might cause Ukraine some issues.

"Looking longer-term, Ukraine might become a bottleneck for new crop shipments," which would be forced to pass through the western ports, such as Odessa.

Ukraine, with capacity for some 40m-45m tonnes in grain exports, has had more than adequate capacity for its shipments, which the government has pegged at 33m tonnes for 2013-14.

However, it has lost some 4m-4.5m tonnes with the annexation of Crimea, and the loss of Mariupol, with capacity for 12m tonnes of cargos of all varieties, and Berdyansk would curtail further any excess.

Prices to rise

The comments came as Mr Sizov forecast further rise in the price of Russian grain prices, which for benchmark 11.5% protein supplies ended last week at $295 a tonne, up some $10 a tonne week on week and above an early-February low of $270 a tonne.

Prices have been buoyed by, besides stronger international values, a switch by traders to "fulfilling their obligations" for grain deliveries from Russia, rather than Ukraine, for fear of disruption.

With a weakening of the rouble also paying farmers to hold crops, which are denominated in dollar, rather than sell, growers have moved to "suspend" their sales in expectation of better prices ahead.

"Prices will keep rising for the next couple of weeks, at least."

'Hard to maintain positive margins'

Indeed, farmers' reluctance to sell looks likely to keep Russian prices rising for now, even if international values retreat, "whatever happens over Russia and Ukraine, and whether any new sanctions are imposed against Russia", Mr Sizov told Agrimoney.com.

"The market has its own dynamics, momentum."

This could mean traders swallowing losses on Russian exports, which are likely to maintain decent volumes next month because of orders already booked.

"It will be hard for traders to maintain positive margins when exporting grain," he said.

However, prices are approaching the $300-a-tonne level which has represented something of a ceiling to cash values in recent months.

See the original article >>

Gold falls to 4-week low

By Debarati Roy and Nicholas Larkin

Gold (COMEX:GCJ14) futures fell to a four-week low after the outlook for higher U.S. interest rates damped demand for the precious metal as a store of value. Palladium (NYMEX:PAM14) rose to a 31-month high on supply concerns.

Federal Reserve Chair Janet Yellen said on March 19 that that the central bank’s benchmark rate may rise about six months after monetary stimulus ends, expected later this year. Policy makers announced the third $10 billion cut in monthly bond purchases, and gold last week dropped 3.1 percent, the most since November.

“People don’t want gold in a rising interest-rate environment,” David Meger, the director of metal trading at Vision Financial Markets in Chicago, said in a telephone interview. “While concerns about Crimea remain, there has been no escalation in violence for people to jump back into the safe- haven asset.”

Gold futures for June delivery fell 1.4 percent to $1,317.80 an ounce at 10:29 a.m. on the Comex in New York. Earlier, the price touched $1,314.60, the lowest for a most- active contract since Feb. 20. Trading was 42 percent above the average for the past 100 days for this time, data compiled by Bloomberg showed.

Through March 21, gold climbed 11 percent this year on signs of a faltering global economy, while Russian President Vladimir Putin completed the annexation of Crimea.

Fed Stimulus

Gold rose 70 percent from December 2008 to June 2011 as the Fed pumped more than $2 trillion into the financial system and cut interest rates to boost the economy. Jeffrey Currie, head of commodities research at Goldman Sachs Group Inc., said this month that the chances are increasing the metal will drop below $1,000.

“Gold began to move south again as macro funds liquidated what has proven to be a fairly profitable trade in recent weeks,” Morgan Stanley analysts led by Adam Longson said today in a report. “The change in tone from the Fed on the timing of the tightening cycle prompted another leg down.”

Last year, gold fell 28 percent, the most since 1981, as U.S. equities rallied to a record and inflation remained muted.

Palladium rose on concern that the prospect of more sanctions by the U.S. and the European Union against Russia, the world’s top source of the metal, will reduce supplies.

U.S. Sanctions

World leaders gathered in The Hague to discuss Ukraine amid growing concern over a Russian buildup on its neighbor’s border. President Barack Obama authorized potential future penalties on Russian industries, including financial services, energy, metals and mining, defense and engineering.

Palladium futures for June delivery rose 0.3 percent to $791.75 an ounce on the New York Mercantile Exchange. Earlier, the price reached $802.45, the highest since Aug. 3, 2011.

Absa Bank Ltd., a unit of Barclays Plc, plans to list NewPalladium, an exchange-traded fund, in Johannesburg on March 27.

“A perfect storm has been brewing for palladium this month,” UBS AG said today in a report, citing the ETP, a strike by miners in South Africa and Russian concerns.

“If no resolution is found in South Africa in the next few weeks, we think metal tightness will only intensify if producers are forced to source metal in the market,” the bank said.

Silver futures for May delivery fell 0.8 percent to $20.155 an ounce on the Comex. The price dropped for the sixth straight session, the longest slump in almost a year.

Earlier, silver touched $20.01, the lowest since Feb. 11. Last week, the metal dropped 5.2 percent, the most since mid- Sept.

Platinum (NYMEX:PLJ14) futures for April fell 0.1 percent to $1,435 an ounce on the Nymex.

See the original article >>

Cocaine-Filled Condoms Intercepted On Way To Vatican

by Tyler Durden

Despite Pope Francis' recent attempts - mostly for media and public consumption, if not so much in actuality - to clear out decades of corruption at the Vatican including shady financial backroom dealings, involving countless global banks, some very odd things continue floating up to the surface. Like condoms filled with cocaine.

From AP:

German customs officials intercepted a shipment of cocaine destined for the Vatican in January, weekly Bild am Sonntag reported Sunday.

Officers at Leipzig airport found 340 grams (12 ounces) of the drug packed into 14 condoms inside a shipment of cushions coming from South America, the paper, reported citing a German customs report. It said the package was simply addressed to the Vatican postal office, meaning any of the Catholic mini-state's 800 residents could have picked it up.

Not surprisingly, nobody at the Vatican stepped up to laim the 14 condoms. Especially since they appear to have been tipped off.

The paper reported that a subsequent sting operation arranged with Vatican police failed to nab the intended recipient. No one claimed the package, indicating that he or she was tipped off about the plan. The drugs would have a street value of several tens of thousands of euros.

A spokesman for the German Finance Ministry, which oversees the customs office, confirmed the report. Prosecutors in Leipzig planned to issue a statement Monday providing further details, Martin Chaudhuri told The Associated Press.

Vatican spokesman the Rev. Federico Lombardi confirmed that the Vatican police had cooperated with German police in an attempt to identify the traffickers. He said the investigation remained open.

The open question: was the cocaine sent for cardinal consumption, or even worse, for reselling purposes. Sure, the Vatican's finances are hardly as strong as they were when the Vatican Bank was humming along but who knew things were so bad to essentially make the Vatican a Breaking Bad spin off?

See the original article >>

US PMI Tumbles From Record High, Biggest Miss In 13 Months

by Tyler Durden

Last month's exuberance-filled, and instantly extrapolated, Markit US PMI print at the lofty levels of 57.1 (proving that the weather-delayed pent-up-demand was truly back) has been dashed on the shores of ugly reality. March's print dropped to 55.5, missing expectations by the most since Feb 2013 as jobs grew at a slower pace and factory orders declined. This slowing in the US economy's growth adds to last night's weakness in Chinese growth. Given weather was not a majr issue in March, what excuse can we find for this?

In the detailed report breakdown of components, also notable is the decline in New Orders from 59.6 to 58.0, as well as the Employment index declining from 54.1, to 53.9

What about the weather: after all Markit was so vocal to blame snow in the winter in the last few months, even though the index magically soared to record? Well, apparently, the weather got better in March.

Reports from survey respondents cited improving economic fundamentals and, to a lesser degree, an on-going catch-up effect following weather disruptions earlier in the year.

Wait, the PMI index declined even as the weather got better? Huh? Yup. Commenting on the flash PMI data, Chris Williamson, Chief Economist at Markit said:

The manufacturing PMI adds to evidence that the sector has shrugged off the weather-related weakness seen earlier the year, with strong demand encouraging firms to expand and hire new staff at a robust pace.

“The buoyant growth in March rounds off the best quarter for three years, indicating that the sector should provide a robust contribution to GDP in the first quarter. Growth was not as strong as February, but that’s in many respects only to be expected after last month’s numbers had been boosted by the rebound from January’s severe weather. The fact that the output and new orders indices remained so strong in March is very encouraging news that the sector has come through the weather-related soft patch and continues to play an increasingly important role in the economic upturn.

“Particularly welcome was the sustained upturn in hiring, adding to evidence to suggest that firms’ retain an upbeat outlook.

“One area of concern is the sluggish growth of exports, but this weakness is being more than offset by strong domestic demand.

”The survey is broadly consistent with manufacturing output rising at an annualised rate of approximately 4% in the first quarter and job creation in the sector running at around 10-15,000 per month. These are encouraging numbers that will no doubt add to the case for the Fed to continue reducing its asset purchases.”

Mmmk then.

Finally, what does this data tell us about the upcoming April NFP:

A solid rate of job creation was sustained across the manufacturing sector in March. Staffing levels have increased in each month July 2013 and the rate of employment growth was stronger than seen on average over this period. Survey respondents widely linked staff recruitment to improving confidence about the business outlook and greater optimism about the prospects for the U.S. economy as a whole.

In other words, it could be better... Or it could be worse than expected.

See the original article >>

Inflection Points for Gold, Silver and the U.S. Dollar

By: Rambus_Chartology

As we all know last week was a tough week in the PM sector. The real question we have to ask is whether this was just a short term correction in the uptrend that started at the December low or is this the end of the three month rally? We’ll look at some charts to see if we can answer this question.
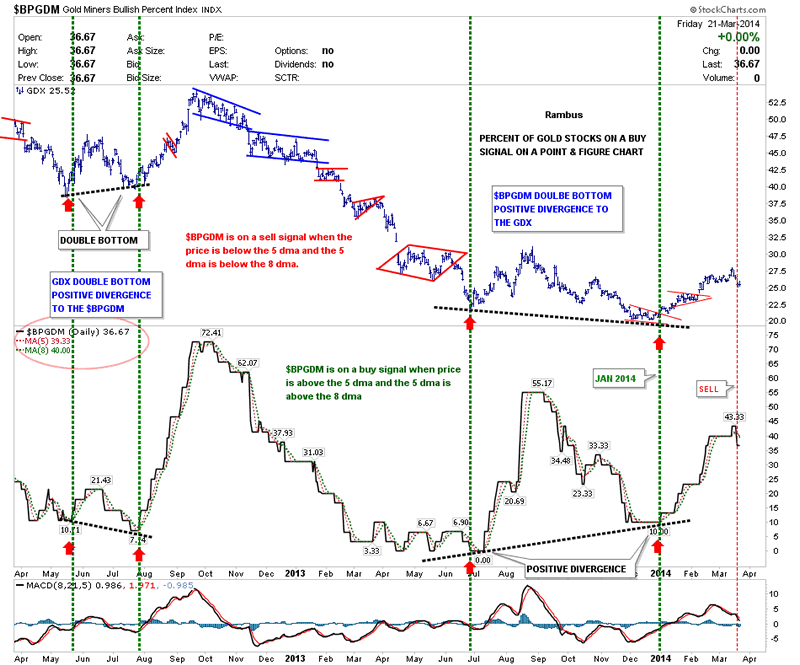
Lets start with the BPGDM chart that I showed you last week which was real close to giving a sell signal. We were just waiting for the 5 dma to cross below the 8 dma to confirm the sell signal. We got that last Friday so it’s officially on a sell signal now. The red circle shows the BPGDM is down to 36.67 with the 5 dma at 39.33 and the 8 dma now the highest at 40. This is the alignment we want to see for a sell signal.


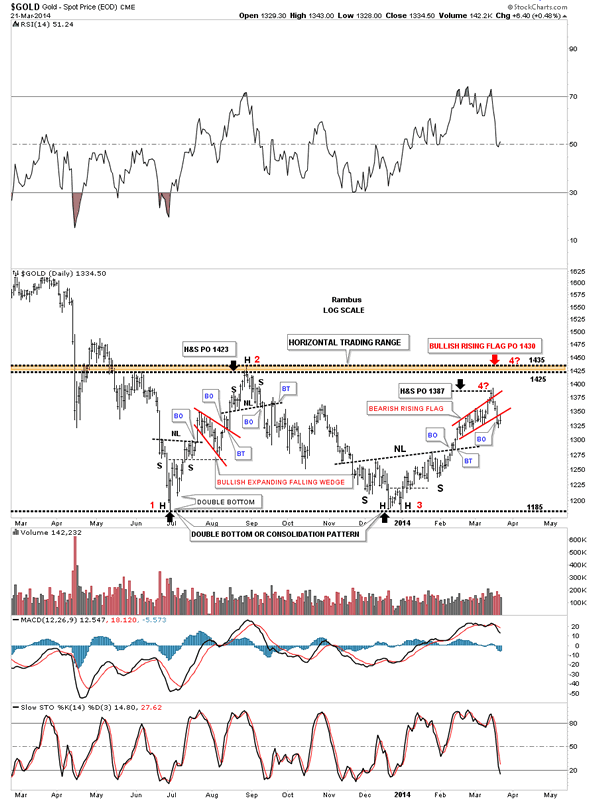
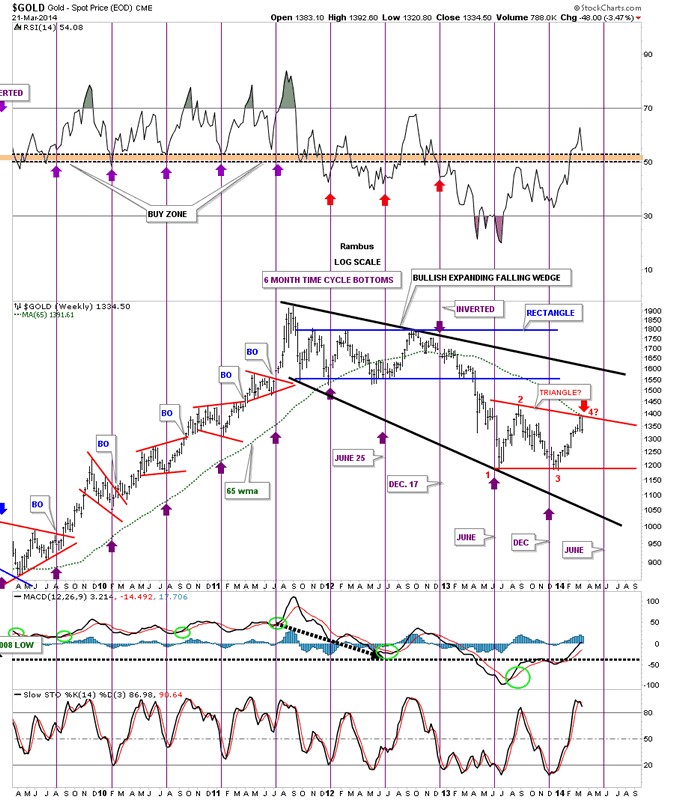
The precious metals complex has been in a trading range since the June low made last year. There is still no confirmation yet if this sideways trading range is a double bottom reversal pattern or just a consolidation pattern. The trading range on gold has had three reversal points so far as you can see on the chart below. I’ve been looking for the price action to reach the August high made last year at the 1430 area where we would then sell regardless if gold was going to move higher. Everybody and their brother knows the 1430 is a hot zone and will be selling. I had originally labeled the red rising flag as a bullish rising flag as it was forming as a halfway pattern with a price objective up to 1430 which fit in perfectly. You can see the red rising flag had a false breakout through the top rail and turned down hard breaking below the bottom red rail. I’ve renamed the red rising flag to a bearish rising flag and moved the 4 with a question mark down to the top of the red rising flag. In these big consolidation patterns you will always see some type of reversal pattern form at the reversal points. As you can see reversal point #1 started out with a little unbalanced double bottom that worked into an inverse H&S bottom. Reversal point #2 built out a H&S top. Our last bottom,#3 started out with another small double bottom that ended up being the head of the inverse H&S bottom. Now here we are back up toward the top of the trading range where the price action has fallen short of reaching the price target of 1430, and has just built a 5 point bearish rising red flag. Is this going to be the reversal pattern that puts in the 4th reversal point in this nearly 9 month trading range?


This next chart shows where the green 65 wma and the most recent high touched, red arrow. That 65 week moving average always worked as support during the bull market years. Is it now going to reverse its role and act as resistance during the bear market? Sometimes it can be too painfully easy not to pay attention to something, as simple as a moving average, that worked miracles during the bull market years. Sometimes it can be that easy. Also if this is the 4th reversal point in the red triangle we are catching it at the optimal time to take advantage of a move down to at least the bottom red rail. If gold can takeout the top red rail and the 65 wma to the topside then we’ll know right away that gold is much stronger than what it appears right now.


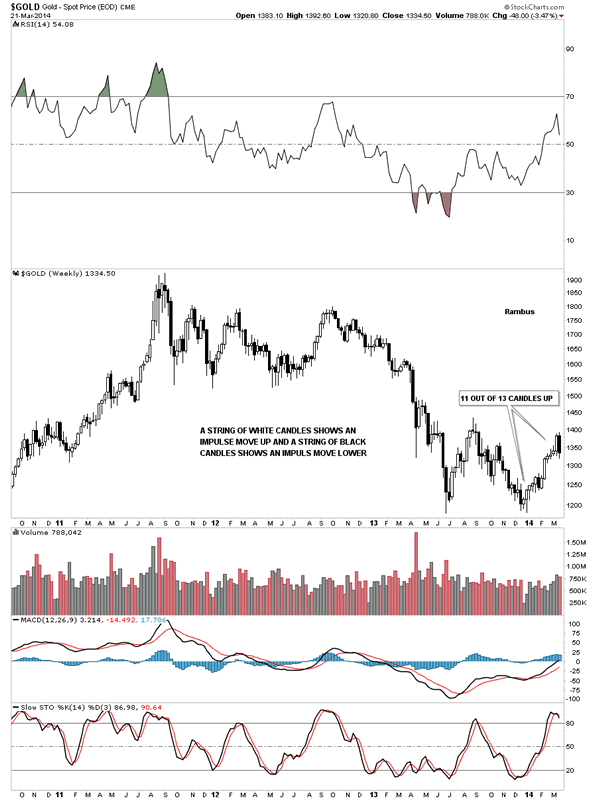
If gold is topping out right here we should see another black candlestick show up this week. There could be some volatility during the week but I would like to see a black candlestick form by the end of this weeks trading to add a little more weight to a downside move beginning.


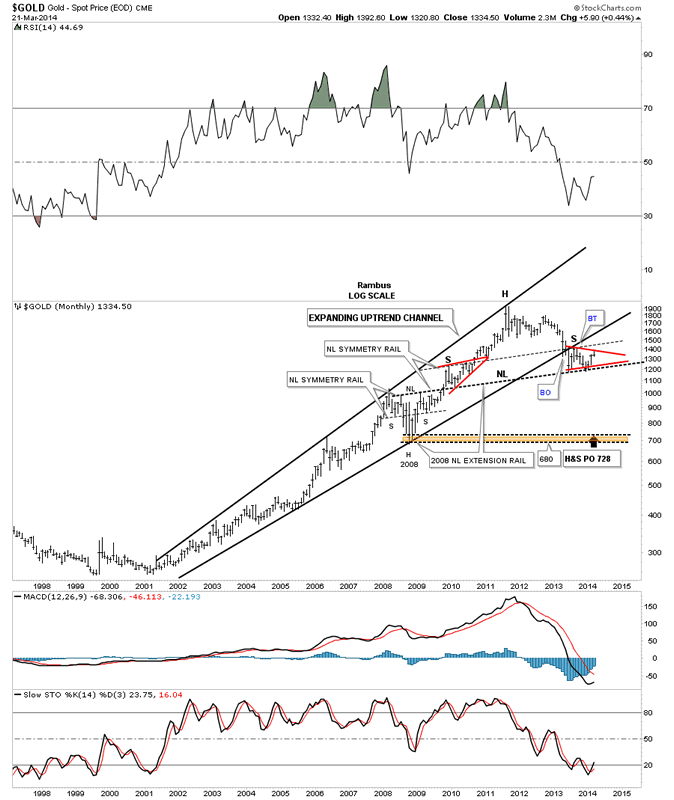
If gold is actually building out a triangle consolidation pattern then that means the neckline of the very large H&S top will be broken to the downside. The neckline is still quite a ways down around the 1200 area so there is plenty of time to watch how things unfold over the coming weeks and months.


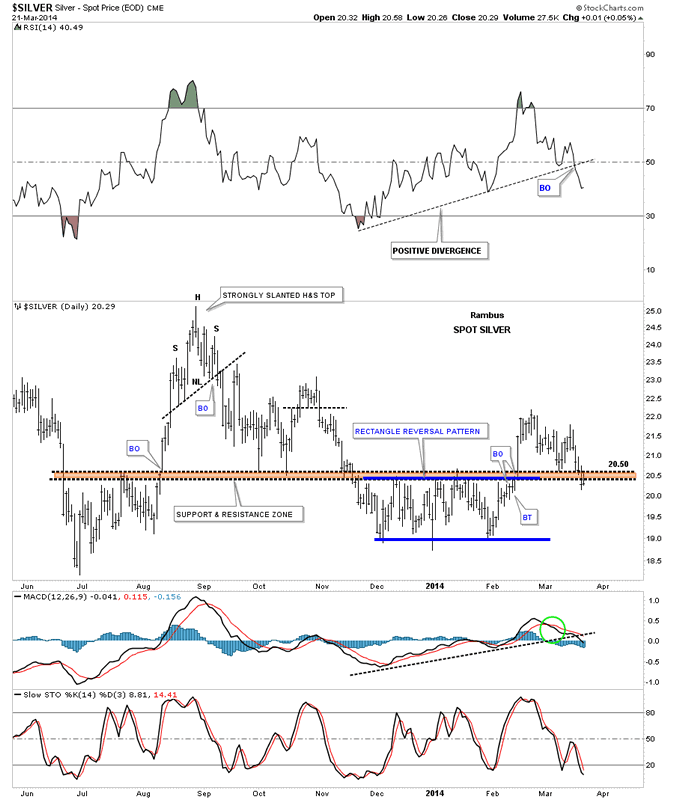
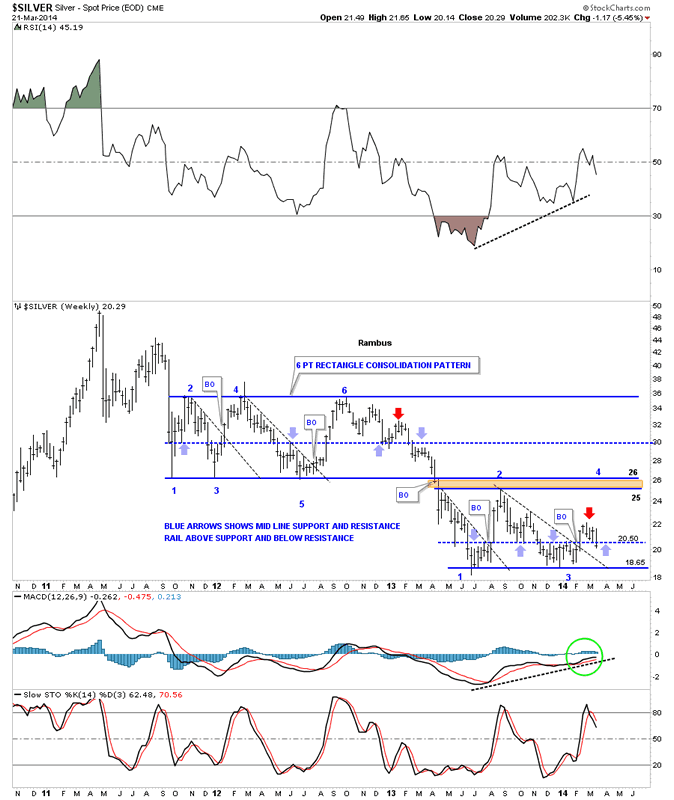
Lets take a look at silver that is starting to crack the strong area of support we’ve been watching at the 20.50 area which is the top of the blue 5 point rectangle reversal pattern. You can see the price action came down to the top of the support and resistance zone and had a good bounce but ran out of steam and now silver is starting to penetrate that brown shaded support and resistance zone which it shouldn’t be doing. The situation can still be saved if silver can start to rally strongly from here but support is starting to crack.


Below is another weekly chart I’ve been showing you that has the lite blue arrows that shows the mid rail support and resistance areas. As you know I’ve been watching that 20.50 area like a hawk hoping it would hold support. As you can see it closed the week below that critical mid line of support. I’ve added a red arrow that shows what happened the last time the center rail failed to hold support on the 6 point rectangle consolidation pattern above. That red arrow, on the blue 6 point rectangle, is the actual spot that began the big impulse leg down to eighteen. Is our current failure to hold support at the center dashed line the actual beginning of the next impulse leg down similar to what we seen on the blue rectangle?


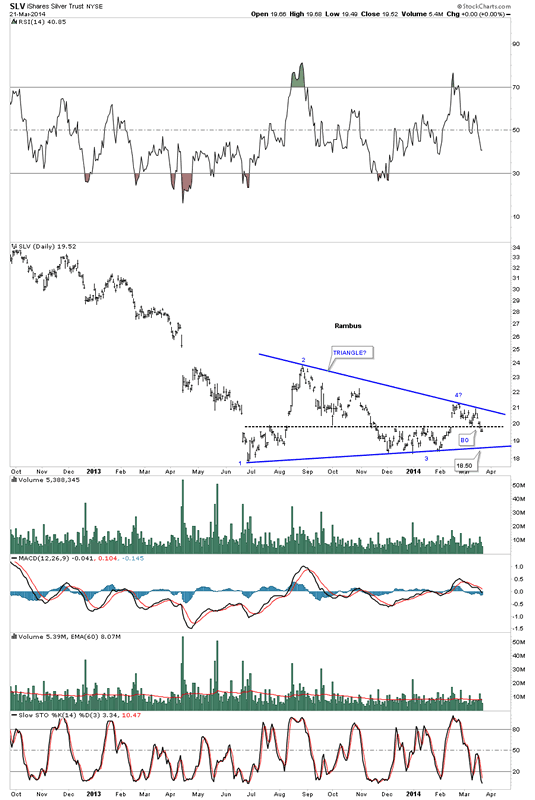
With the potential support rail being violated this sets up the possibility that a triangle pattern is now forming. I can guarantee you that this possible triangle is not on anyone’s radar screen yet. The fourth reversal point is now just beginning to show itself.


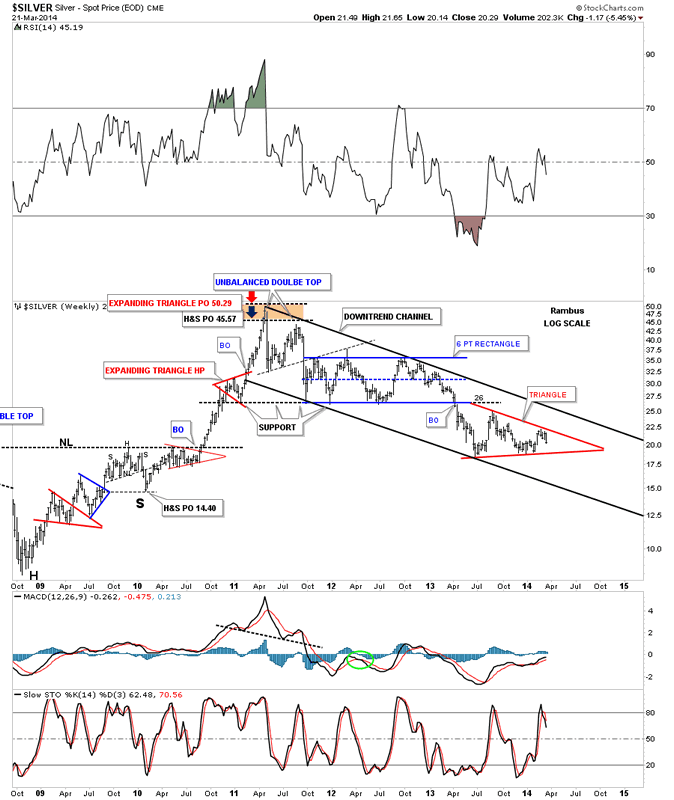
If silver is building out a triangle consolidation pattern lets see how it fits into the big downtrend channel that has been in place since silver topped out in April of 2011 almost three years ago already. As you can see it fits perfectly.


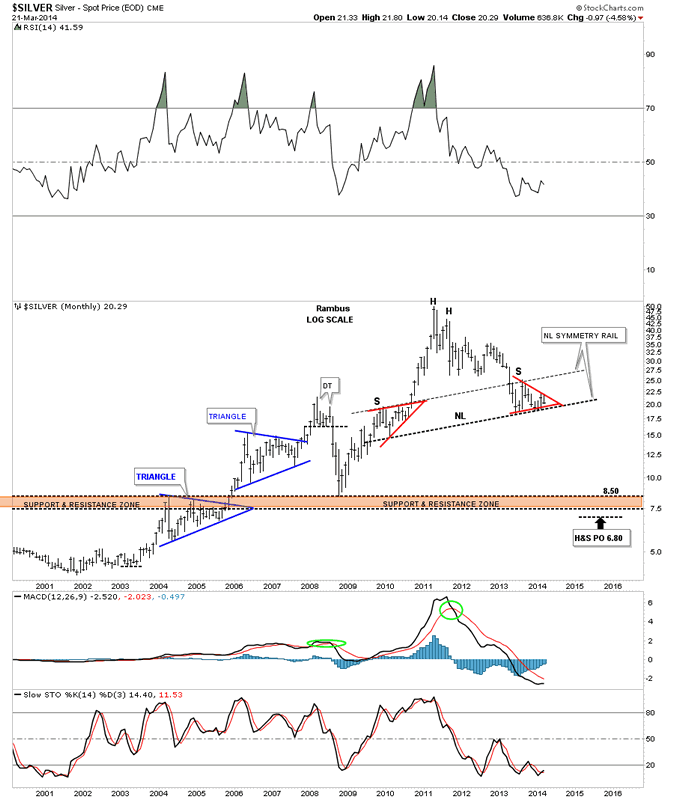
Lets take one last look at silver that shows how our potential triangle, that is now forming, may play out in the very long term look. As I’ve stated several times there is some beautiful symmetry is taking place on the long term monthly chart for silver. As you can see on the chart below the potential triangle is the right shoulder of a very large H&S top. I know it maybe hard to wrap your head around what this means for silver and the precious metals complex in general. If silver along with gold break below their respective necklines, I’ve been showing you, there is going to be one more hard down phase that will virtually wipe out most of the bull market gains off the books. This would then be a round trip from start to finish. How many investors do you think sold all their gold and gold shares in 1980 when gold and silver topped out? I would bet very few actually sold anywhere near the top as the same hype we have heard in this bull market was the same back then. Maybe this time will be different but silver and gold will need to show us some strength by making a new higher high at some point to reverse this downtrend that has been in place for close to three years now.


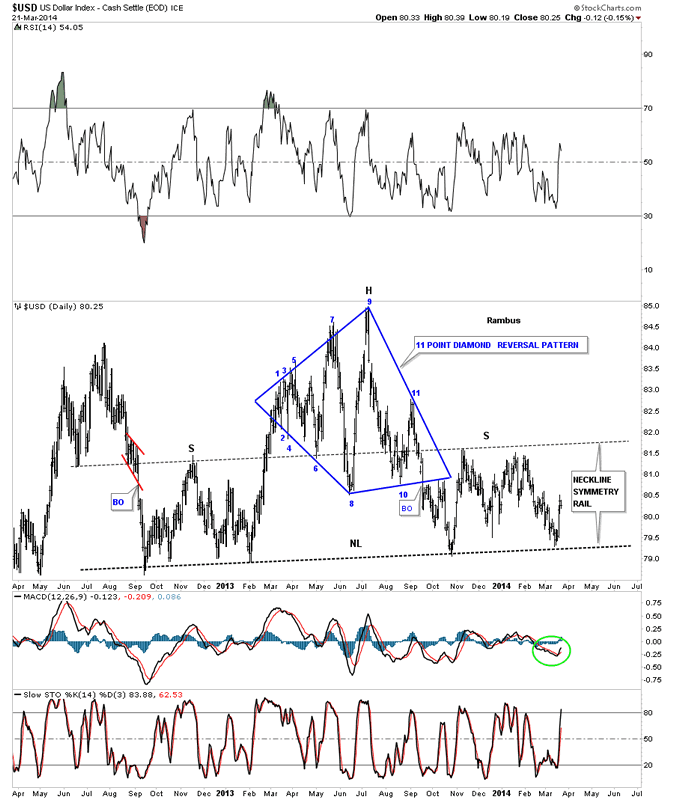
If gold and and silver are going to make new lows we need to look at the US dollar for any clues it can give us. The first chart I would like to show you is the possible H&S top with the Diamond head. As you can see the price action reached the neckline again just recently and has bounced up. We know that is one hot neckline. Still no confirmation that the potential H&S top is valid.


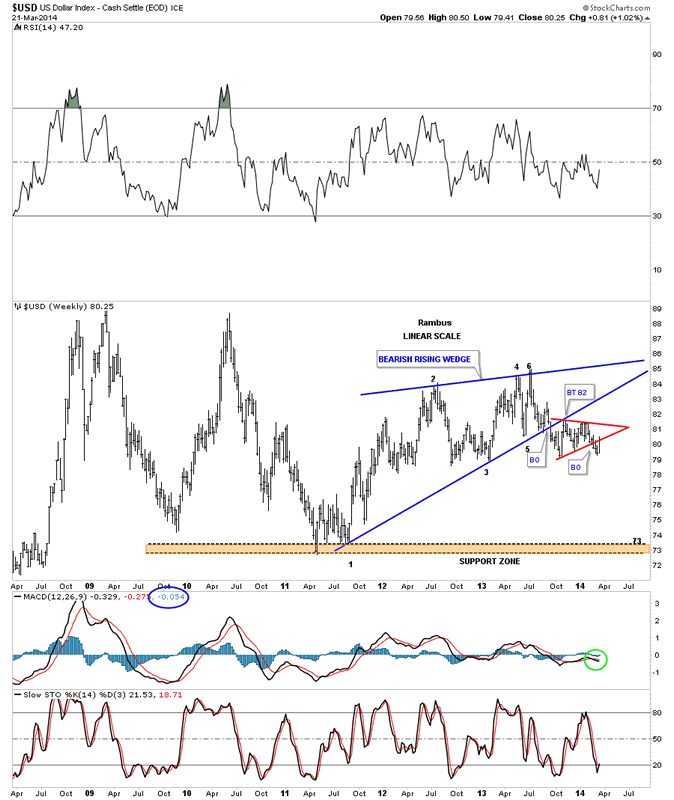
I have many charts for the US dollar that can show either a bullish or bearish outcome. Lets look at one more chart that shows a bearish setup. The US dollar broke down out of a blue bearish rising wedge and then built a red triangle as the backtest. You can see the dollar backtested the bottom rail of the red triangle this week. So far it’s still holding resistance.


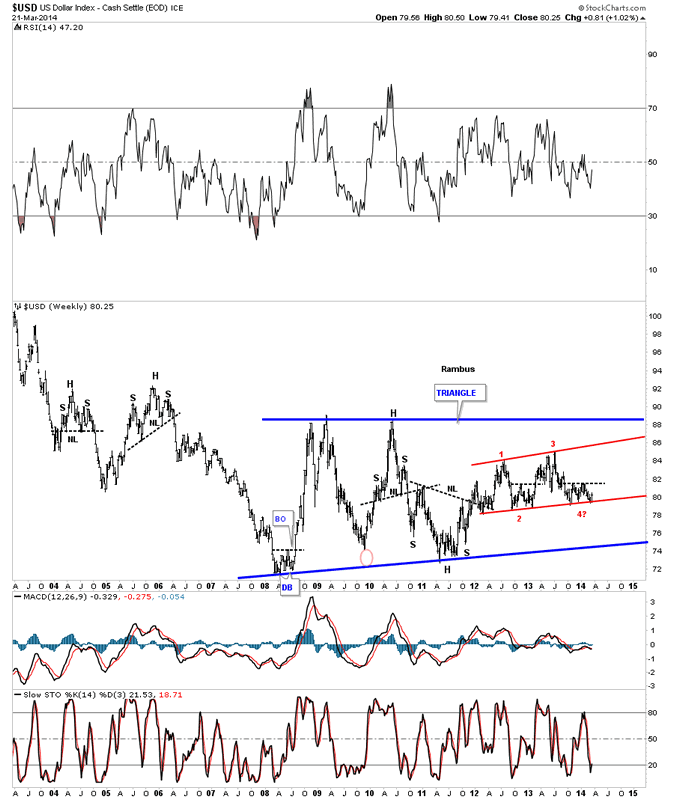
Now lets look at several charts that may show a positive outcome if support can hold. Below is a very long term chart for the US dollar that is showing a possible very large blue triangle forming. If the bottom rail of the red consolidation pattern can hold support, right here, then the US dollar should be able to rally at least back up to the top red rail at a minimum. This is a critical time for the US dollar.


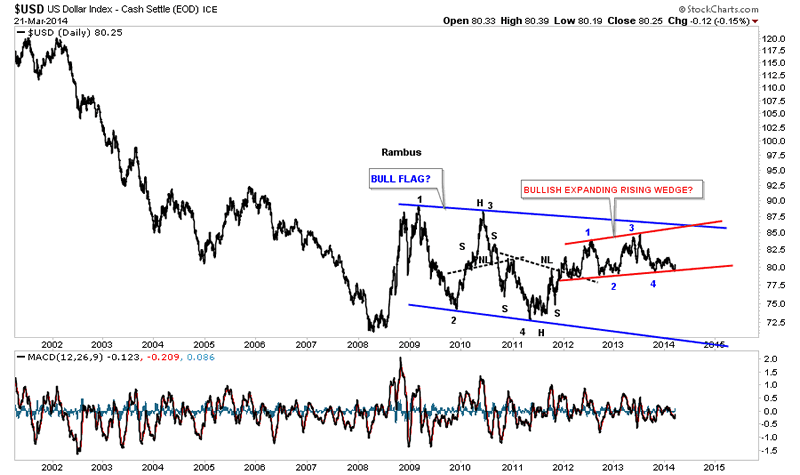
Below is basically the same chart but this time I moved the first reversal point up to the 87 area which gives us more of a bull flag type pattern. The red trading range is still the key as to which way the US dollar is eventually going to break. So far the bottom red rail has been holding strong support.


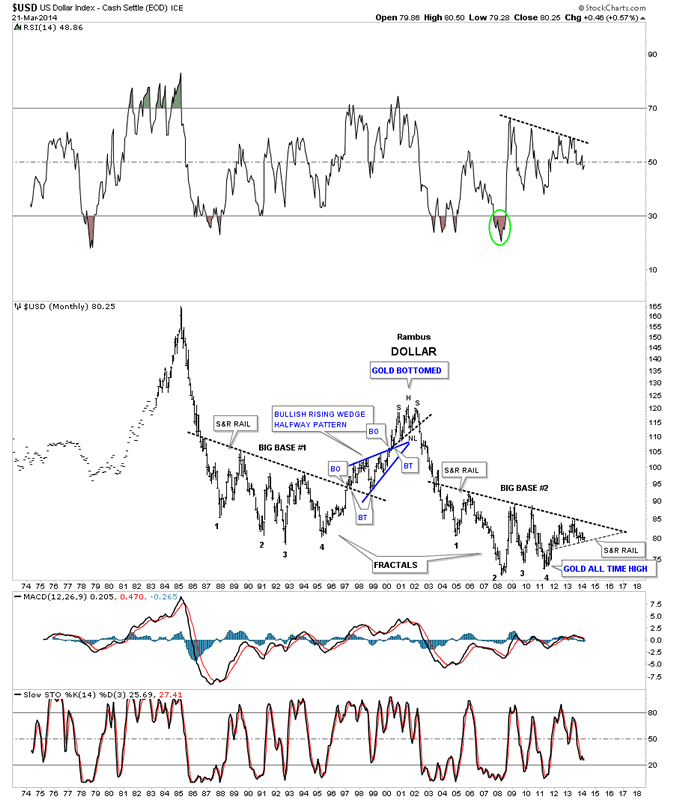
This last chart I would like to show you is one I built quite awhile ago that shows the two fractals or big base #1 and big base #2. The dollar has been moving at a snails pace between the top down sloping rail and the support and resistance rail on the bottom. Eventually it’s going to have to break one way or the other and whichever way it breaks out a good trend should develop.


It looks like the precious metals complex maybe at another inflection point right here and now. Last weeks price action may have ended the three month rally that began at the December low. I think we’ll know shortly if this is indeed the case. Stay tuned as it can get pretty wild at these turning points sometimes. All the best...Rambus

See the original article >>
Follow Us