Thursday, July 14, 2011

Google 2Q earnings soar past analyst estimates

By MICHAEL LIEDTKE

Google Inc. ushered in new CEO Larry Page with second-quarter earnings that were far better than analysts expected.

The results released Thursday reassured investors who had been fretting whether Google would still thrive under Page's leadership. The Google co-founder replaced Eric Schmidt, the CEO of the previous decade, at the start of the quarter.

Wall Street wasted little time signaling its exuberance with Page's performance. Google shares increased $52.69, or 10 percent, to $581.63 in extended trading after finishing the regular session at $528.94.

Google Inc. earned $2.5 billion, or $7.68 per share, in the April-June period. That's a 36 percent increase from $1.84 billion, or $5.71 per share, a year ago.

If not for costs covering employee stock, Google says it would have earned $8.74 per share. That figured easily topped the average estimate of $7.84 per share among analysts surveyed by FactSet.

Revenue increased 32 percent to $9 billion, the first time in Google's 13-year history that it has brought in that much money in a quarter.

After subtracting Google's advertising commissions, revenue stood at $6.9 billion — nearly $400 million above analyst projections.

Google fared so well because advertisers were willing to pay higher prices to promote their products on the Internet's largest marketing network. The average price paid per advertising click on Google's network rose 12 percent from last year. Web surfers also found the ads more enticing, clicking on them 18 percent more than they did at the same time last year.

Page delivered the impressive results even while standing by his vow to bring in more engineering talent and investing heavily in more data centers so that Google can keep expanding into new fields to make even more money in the future. Google's newest venture, a Facebook-like social network called Plus, debuted two weeks ago and has grown quickly amid positive reviews.

Google added 2,452 employees in the second quarter, including 450 workers inherited as part of the company's $700 million purchase of airline fare tracker ITA Software.

Andrew, Elliott and Leonardo Suggest that Silver is Shining Again


And it is about time! Why it was way back in May of, uh, let me think, umm, ahhh…..yes 2011 that we reached a peak. Over two months ago! Back in the beginning of May, Silver ($SI_F) was all anyone could talk about. After peaking and falling dramatically I wrote a piece about why it looked to have more downside (link below). Now after all this time it is starting to look bullish again. Here is my case in three charts.

Silver, Andrew’s Pitchfork
si pf e1310600772289 stocks
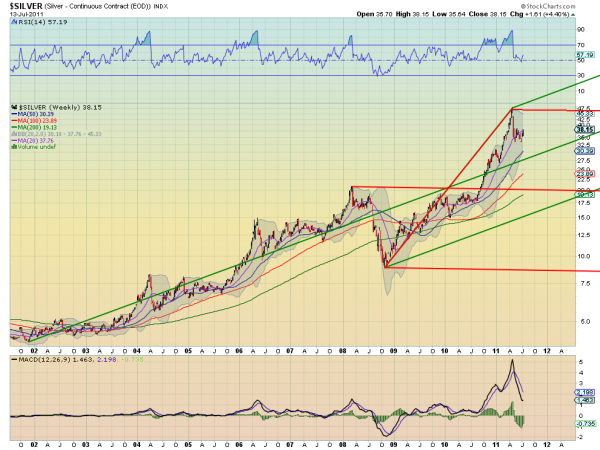
The weekly chart for Silver using the Andrew’s Pitchfork tool shows that after setting the Upper Median Line of the bullish Green Pitchfork it moved back toward the Median Line but has been captured by the pull of the Upper Median Line and stalled. It has also reversed course higher towards the Upper Median Line of the bearish Red Pitchfork. This view shows Silver heading higher.

Silver, Fibonacci’s
si fib e1310601106296 stocks
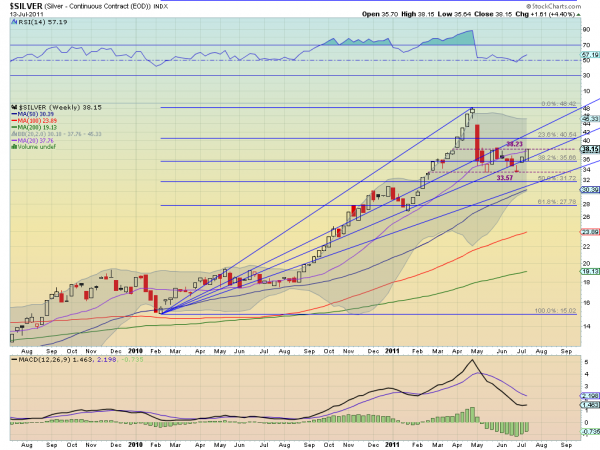
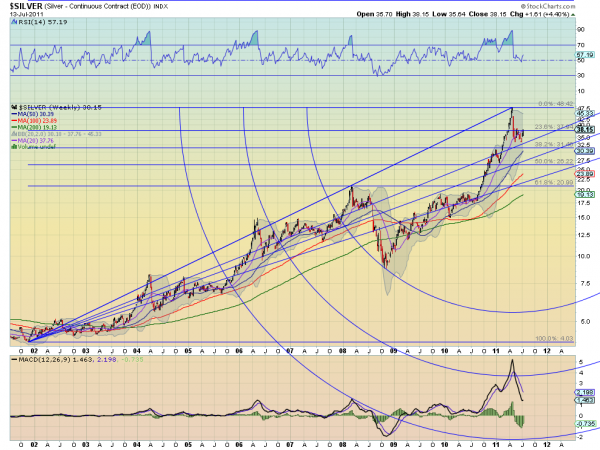
The Fibonacci’s applied to the weekly chart also point higher. After making a top the pullback found support at the first Fibonacci Fan line and is now breaking above the 23.6% Fibonacci retracement level. a solid hold above 37.84 would suggest a move higher to retest the 48.42 high. 

Silver, Elliott Wave
si ew e1310601815544 stocks
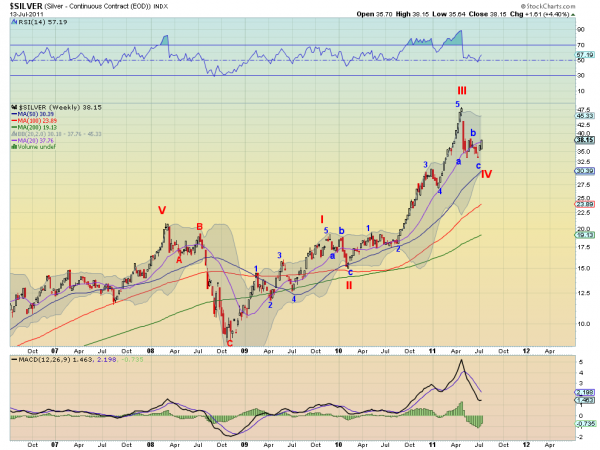
The Elliott Wave chart shows that Silver is beginning Wave V of the motive wave higher. Wave V could extend to 67 without any real issues. So what is there in the way in terms of resistance along the way? One more chart.

Silver Short Term
si tr e1310602538398 stocks
After peaking the pullback to the Fan line gives clues. There is support at the previous lows near 33.57 and now also at the Fibonacci level of 35.66. Resistance comes at 38.23, just above the current level and the 40.54 level above that. if it can get through 40.54 then the fan line is at 42 above followed by the gap at 43.75 before retesting the high and getting into free air. If you cannot play the futures then the iShares Silver Trust (ticker: $SLV) is a good proxy.

Red Hot Farmland Market

by DTN

Few investments can match farmland's returns in the past five years -- it has increased as much as 50% depending on location.

The strongest growth has been in regions with intensive field crops or livestock production, especially the Midwest. The Chicago Federal Reserve reported farmland in its district was 16% higher in the first quarter of 2011 than a year earlier, the largest year-over-year increase since 2007.

The Kansas City Federal Reserve also reported first-quarter values up strongly. The areas with slower growth include those with varied agriculture, environmental restrictions or limited water.

"I think we will continue to see prices gradually move up," Jeff Waddell of Martin, Goodrich & Waddell (MGW), a major agricultural real estate firm in Illinois and several other states, told DTN. He doesn't expect to see the 20% to 30% growth some predict for the next several years. "I don't think the market is firmly established at the $11,000 to $13,000 prices that are grabbing headlines on some sales, but I think we will see more $10,000 and above sales in the next year or two."

Waddell said there have not been many properties for sale -- although he has seen rising numbers in the past month or so -- at higher prices.

Current agricultural land values appear to be consistent with economic conditions and commodity prices, according to Rabobank economist Vernon Crowder. "There is little sign of a land price bubble at present," he said.

THREE MAJOR DRIVERS FOR LAND VALUE

The three major drivers of recent agricultural land value increases are high prices for commodities, low interest rates and a limited amount of land for sale, Crowder said.

"The outlook for commodity prices is positive," he said. "While volatility is expected, substantial price drops are not anticipated until global stocks can be rebuilt."

However, producer profits are likely to be squeezed by rising input costs, he noted. "The result should be a slowing in U.S. ag land value growth, accompanied by occasional sharp decreases from year to year," according to Crowder.

Risks related to commodity prices include the possibility of the U.S. government relaxing renewable fuel mandates and discontinuing tax credits for ethanol, long-term disruption of fertilizer supplies, an aggressive inflation control program that includes higher interest rates, or disruptions to global trade.

Waddell doesn't expect any crash in the foreseeable future either. "The land is in very strong hands," he said. He believes the loss of ethanol credits is already priced into the market.

"As long at oil is in the $90 to $100/barrel range, ethanol is profitable without them," he explained. "However, if we lost the mandate, then we would see corn prices and therefore land, make a downward adjustment."

Higher interest rates are the risk most likely to be realized over the next three to seven years, he believes. "Rates will need to increase from historic lows as the economy strengthens," he said.

FARMERS DOMINATE

Iowa State University reported that farmers were the buyers in 70% of farmland sales in the state last year, versus 56% in 2004.

Citing the annual "Land Scan" report from the Realtor's Land Institute, Crowder said the economic downturn and tight credit conditions had driven speculative buyers out of the market at the end of last year. "Agricultural land markets became very localized, with a buyer pool more familiar with local conditions and values."

Outside funds remain a small proportion of farmland asset value, estimated in the range of $5 billion to $15 billion out of $1.7 trillion, Crowder said. Pension funds are the leading source of investment money, followed by endowments, hedge funds and wealthy individuals, according to the American Society of Farm Managers and Rural Appraisers. They are looking for reliable income even more than asset appreciation, he added.

The fact that farmers are the major buyers indicates farming is profitable. Farmers' financial health is excellent right now, and although record prices have been logged on some sales, it does not appear producers are plunging into debt to make purchases. USDA reports that in the past five years, real estate debt has averaged slightly above 7% of the value of farm real estate assets, down from 10% in the 1990s and 13% in the 1980s.

FARMERS IN FOR LONG HAUL

Crowder said when producers purchase land, it is less likely to come back on the market, because farmers are in it for the long haul and not as influenced by other investment returns.

This will keep the supply of land available for purchase relatively tight, even though competition for non-agricultural uses has slowed since the financial crisis. "We have seen interest for commercial and residential building drop precipitously," Waddell said.

Farmer domination of the land market does not of itself preclude a bubble, however, Terry Kastens, Kansas State University emeritus ag economist, told DTN. "After all, farmers were heavy buyers just ahead of the 1980s' crash. The problem then was that farmers had become highly leveraged by the time of the crash and interest rates had jumped precipitously just prior to the crash, a double-whammy for landowning farmers at the time," Kastens said.

"If we see a scenario similar to the 1970s, when high farming profit, low leverage, and low interest rates eventually gave way to low profits, high leverage, and high interest rates, then a bubble could indeed occur even without outside speculative monies involved," said Kastens.

"It all depends upon how potential landowners, especially farmers, react over the next few years," said Kastens. "If they allow their leverage ratios to increase at the same time that land values increase, we could still see a farmer-driven crash, especially if interest rates start jumping dramatically. After all, even modest declines in land values in the face of high leverage ratios can quickly turn those ratios into unsustainable leverage ratios as lenders restrict credit and induce land sales. So, the real question is: 'Are farmers and lenders 'smarter' this time around, or will they again induce a bubble by their actions as farm profitability wanes and interest rates rise?' Time will tell."

DOWNWARD PRESSURE AHEAD

"Speculative bubbles are formed when asset values dramatically diverge from their fundamental economic value," Crowder said. "Drivers of bubbles tend to be panic buying and selling, substantial short-term speculative interest and high levels of liquidity. This is not the case in farmland right now."

However, although Crowder expects land values to increase again this year, he believes some downward pressure could be seen in the next three to seven years as the probability of negative factors builds. Possible threats to continued higher prices include a correction in field crop values in the Midwest, rising interest rates, a stronger dollar, and a moderation in global demand.

Corn Market Waiting on August Production Report

by Darrel Good

Corn prices have made a modest recovery following the sharp declines stemming from the USDA reports released on June 30. The recovery has reflected a combination of continued strong corn demand and a few concerns about yield potential.
 
July 2011 corn futures reached a high just below $8.00 on June 10 and declined to a low of $6.15 on June 30. The price of that contract moved about $.55 higher in the first week of July.
Similarly, December 2011 futures reached a high near $7.23 on June 9, declined to $5.75 on July 1, and then moved about $.60 higher by the close on July 8.
 
Corn prices continue to react to a number of factors, including general economic and financial developments. Much of the price strength in July, however, has been associated with indications of continued strong demand and some ongoing concerns about potential yield and production.
 
Based on weekly estimates of ethanol production, it appears that ethanol production in June 2011 was 4.7 percent larger than in June 2010. To reach the level of production for the 2010-11 marketing year implied by the USDA’s projection of 5 billion bushels of corn used for ethanol and by-product production, ethanol production in July and August needs to be only 0.3 percent larger than production of a year ago. While there is some threat that the tax credit for blending ethanol could be eliminated at the end of July, current blending economics suggests that ethanol production would not be immediately reduced in the absence of the tax credit.
 
There is some ongoing disagreement above the amount of corn used for ethanol production. For the 2009-10 marketing year, USDA estimates of corn use imply a conversion rate of 2.74 gallons of ethanol per bushel of corn. Trade associations indicate that the correct conversion rate is 2.8 gallons per bushel and suggest that less corn has been used for ethanol production than implied by the USDA. The USDA’s Feed Outlook report to be released on July 14 will contain an estimate of corn used for ethanol production during the third quarter of the 2010-11 marketing year. That estimate will indicate if any change has been made in the estimate of the conversion rate.
 
Corn export prospects, particularly for the 2011-12 marketing year, have improved with recent purchases by China. For the current year, the USDA reported that China had imported about 22 million bushels of U.S. corn as of June 30. No outstanding sales to China were reported as of that date. However, unshipped sales of 103.5 million bushels to unknown destinations may have included some sales to China. On July 7, the USDA announced sales of 21 million bushels of corn to China for delivery during the 2011-12 marketing year. In addition, announcements on July 1 and July 7 reported sales to unknown destinations totaling 14 million bushels for the current marketing year and 42.5 million bushels for the 2011-12 marketing year. Some of those sales may be to China.
 
Corn production prospects were boosted by the USDA’s June Acreage report that projected area harvested for grain at 84.888 million acres, 3.44 million more than harvested in 2010. Using the calculation of expected yield of 158.7 bushels in the USDA’s June 9 WASDE report, the acreage forecast points to a record 2011 U.S. corn crop of 13.472 billion bushels, 1.025 billion larger than the 2010 crop. There is some uncertainty about the harvested acreage forecast due to late planting and extreme weather conditions (flooding and drought) in some areas.
 
That forecast may be revised in the August Crop Production report. In addition to late planting and extreme weather in some areas, corn yield concerns increased with dryness that developed in late June and early July in parts of Illinois, Indiana, Iowa, Ohio, and Wisconsin. However, some precipitation was being received in parts of those dry areas today (July 11).
 
Widespread high temperatures in the first half of July remain an issue. Crop condition ratings remain generally high. As of July 3, 69 percent of the crop in the 18 largest corn producing states was rated in good or excellent condition in the USDA’s weekly Crop Progress report. A year ago, 71 percent of the crop was rated in good or excellent condition. Without considering the potential impact of late planting, current crop condition ratings point to a 2011 U.S. average corn yield well above the current USDA calculation of 158.7. As learned the past two years, however, condition ratings in early July are not always a good indicator of actual yield.

The USDA’s July WASDE report to be released tomorrow (July 12) will provide additional information about the likely level of stocks at the end of the 2010 and 2011 marketing years. As usual, the USDA’s August 11 Crop Production report will be highly anticipated. Expect pre-report expectations about the size of the 2011 crop to be in a wide range. Until then, corn prices may remain in a relatively tight range compared to that of the past 5 weeks.

The 2012 Election and the Truth Behind the Debt Ceiling Debate

By Martin Hutchinson

At this point, there can't be anyone left who truly believes that the debt ceiling debate taking place in Washington is really about what's good for America.

The truth is it's about the 2012 election - and the party that wins the debt ceiling debate will be the party that comes out on top next year.

It's politics - pure and simple.

Republicans and Democrats have their own respective agendas heading into the 2012 election. And with 16 months to go, there's just enough time for actions taken now to work their way through the system and swing the economy in one direction or the other.

Now, I'm not a believer in conspiracy theories, but I am a firm believer in Public Choice Theory. That means I believe we can make clear statements about what economic conditions each party would like to see 16 months from now - considering their own selfish political points of view.

The Democrats would like to see rapid growth, with unemployment coming down sharply. They don't care so much about whether inflation is ticking up a bit, or whether an over-large budget deficit may cause trouble in the future. If they get elected in November 2012 they figure they will sort out any problems after the fact - particularly if they can recapture the House.

Conversely, the Republicans would like growth to be sluggish, with unemployment stubbornly high. They also would like to make the painful decisions that bring long-term growth now, so that they can benefit from the growth and not suffer the political cost of the pain if they capture the Presidency and ideally both Houses of Congress in November 2012.

Both parties, of course, have strong beliefs about what policies work better, about what policies are better for the interest groups that support them, and about what policies are best suited to their ideology. But at this stage of the electoral cycle, they're pragmatists.

Here's how the election cycle breaks down:

  • The time for politicians to put their favorite ideas into effect is in the first year or two of the election cycle, after they've won a big majority. That's why President Obama and the Democratic Congress spent so much political capital on the "stimulus" and the healthcare bill in 2009-10, and tried to get a "cap-and-trade" carbon emissions program passed.
  • In the run-up to the election from next January onwards, the main effort will go into rewarding powerful interest groups that provide money and votes, and to electorally popular gimmicks.
  • After the election, there's a short period in which the winning party can do any unpopular, "root canal" stuff that appears necessary.
  • However, with the election still more than a year away, the natural impulse of both parties is to ensure that the economic picture faced by the electorate the following year will be as they wish. That's why President Nixon abandoned the Bretton Woods exchange rate system in August 1971, it's why President Kennedy advocated his supply-side tax cut in 1963 (it was passed early the following year) and it's why President George W. Bush pushed through capital gains and dividend tax cuts in 2003.

What Republicans Want to Get Out of the Debt Ceiling Debate

The Republicans currently have less power than the Democrats, but their objectives in the current negotiations are fairly clear. They want as big a spending cut as possible and as much progress towards reducing the deficit as possible.

That's not just because they like spending cuts and deficit reduction. They also believe that spending cuts will result in public employee layoffs and may cause a short-term impediment to the economic recovery - even though they will improve long-term growth.

Short-term pain for long-term gain suits the Republicans fine, as any economic slowdown and increase in unemployment will happen before November 2012.

Conversely, the Republicans don't want marginal rate tax increases, which would affect long-term growth prospects, and for which they would be blamed by the electorate.
However, they don't mind tax code rationalization through the elimination of tax subsidies. Such reform would have mostly short-term effects, resulting in the closure of subsidized activities with accompanying job losses.

Capping the home mortgage deduction for high earners, which would probably cause a further lurch downward in the housing market, is also fine. The Republicans also probably don't mind capping the charitable tax deduction for high earners. The vast majority of charities are natural Democrat constituencies, except for churches, whose donors are predominantly middle-income people rather than the wealthy.

The Republicans also have a clear self-interest on monetary policy, though they are less able to affect that directly other than by harassing Federal Reserve Chairman Ben S. Bernanke at Congressional hearings.

A "QE3" program of bond purchases would make the federal deficit easier to finance in the short term and boost the stock market while increasing inflation in the longer term. It would thus be bad news for Republicans, and for older people living on savings, a natural Republican constituency. Conversely, higher interest rates would help savers and slow the economy, both natural Republican wishes going into an election year.

Again, there are no conspiracies involved here - just the politicians' self-interest.

So when scoring the debt ceiling debate and other economic policy moves this year, you can put a tick in the GOP column from all the policies on the above list. Needless to say, some of the wins will be accidental from Democrats failing to figure out where their true interests lie - and likewise GOP ineptitude may hand the Democrats a few freebies.

Tomorrow (Friday) I will look at the motivations behind Democratic policy-making, and we'll see what's really behind that party's side of the debt ceiling debate.

Dollar testing breakout ...

by Kimble Charting Solutions


JPMorgan Chase's income rises 13 percent in 2Q

By PALLAVI GOGOI

JPMorgan Chase & Co.'s second-quarter income rose 13 percent as the bank collected higher fees from equity and debt underwriting in its investment banking business. The bank also cut losses in its credit card portfolio.

The New York bank reported Thursday that it earned $5.4 billion, or $1.27 per share in the three months ending in June. That was above the $1.22 per share that analysts surveyed by FactSet had forecast. JPMorgan earned $4.8 billion, or $1.09 per share, in the same period a year ago.

Investment banking income jumped 49 percent, to $2.1 billion, as the bank collected higher fees. The bank set aside $2.6 billion for compensation to its investment bankers, down from $2.9 billion in the same period last year.

JPMorgan's lending business faltered in the second quarter. Despite low interest rates, the bank lost $454 million in its auto and mortgage loan operations, compared with income of $364 million in the prior year.

Even in credit cards, a bright spot in recent quarters, JPMorgan's customers weren't spending as much, reflecting a lack of confidence in the economy. The total amount of credit card debt held by JPMorgan fell 12 percent compared with a year ago as its customers spent less. JPMorgan reduced its loan loss reserves by $1 billion as more people paid their bills on time.

JPMorgan's stock rose 2 percent to $40.57 in pre-market trading Thursday.

Avoid Financials: Bank Earnings Are Set to Slide

By David Zeiler

Flat or falling revenue will plague major bank earnings as second-quarter results are reported this week - delivering yet another blow to battered financial stocks.

Most of the big banks are expected to report a profit, but a falloff in equity trading volume, weak demand for loans, and costly legal headaches all ate into revenue, which will be a prime concern for already-skeptical investors.

All of the big bank stocks are down since the beginning of the year, several more than 20%.

"To say the least, it has been a challenging quarter for the universal banks, as concerns over a disappointing spring housing market, slowdown in the global economy and concerns over counterparty risk to European banks have all worked in concert to cause underperformance," Keefe, Bruyette & Woods analysts wrote in a note to clients.

JPMorgan Chase & Co. (NYSE: JPM) kicks off two weeks of big bank earnings later today (Thursday) followed by Citigroup Inc. (NYSE: C) tomorrow (Friday). Wells Fargo & Co. (NYSE: WFC), Bank of America Corp. (NYSE: BAC) and Goldman Sachs Group Inc. (NYSE: GS) are all slated to report Tuesday, with Morgan Stanley (NYSE: MS) expected next Thursday.

Analysts are expecting an average drop in big bank revenue of between 6% and 8%.

Trading Falls Off

The biggest culprit may be the decline in equity trading revenue, which dropped 4.4% from last year and 17% from the previous quarter. Although those percentages aren't huge, trading accounts for about a quarter of most major banks' revenue - and almost 79% of Goldman Sachs' business.

Average daily trading volume on the U.S. exchanges fell 31% from the previous quarter to its lowest level since the end of 2007. Investors pulled back over concern about the sputtering U.S. economy, the inconclusive battles over the debt ceiling and budget deficit, and the escalating European debt crisis.

Worse still, major investors were even more reluctant to indulge in riskier - and for the banks, more lucrative - products like complex options and derivatives.

"Client risk appetite has declined, risky asset prices are lower and client activity levels are considerably weaker," Howard Chen, an analyst at Credit Suisse Group AG (NYSE ADR: CS), told The Telegraph.

Implementation of the Dodd-Frank regulations, which has reduced income from customer fees, also took a bite out of revenue. And the banks stand to lose even more fee revenue when the amount they can charge retailers for credit card transactions gets cut by more than 40% later this year.

Bank earnings

The banks' loan business also continues to struggle. According to Federal Reserve data, residential loans were down 2% in the quarter from a year ago, while commercial loans were down 8%.

And prices for mortgage-backed securities plunged when the Federal Reserve Bank of New York started to unload some of the bad mortgage bonds it acquired from American International Group Inc. (NYSE: AIG).

Legal Troubles

In addition to haunting the banks' loan portfolios, the legacy of the subprime mortgage crisis resulted in a several costly lawsuits this past quarter.

In the largest bank settlement ever, Bank of America agreed to pay $8.5 billion to investors who lost money on sour mortgage-backed securities. The bank has already warned that the one-time charge of $14 billion will result in a quarterly loss of between $8.6 billion and $9.1 billion.

Wells Fargo agreed to pay a group of pension funds and other investors $125 million to settle a suit that alleged the banks failed to warn them of the risks related to mortgage-backed securities.

JPMorgan Chase agreed to pay the Securities & Exchange Commission (SEC) $154 million over similar allegations that it had failed to properly disclose the risks of mortgage-backed securities; the bank also settled for $211 million in a case in which it was charged with rigging bids to win government business.

With so many problems weighing down bank earnings, some analysts suspect some may release a portion of their loan-loss reserves to make the numbers appear a bit less dreary.

Last quarter the release of loan-loss reserves accounted for half of JPMorgan Chase's $5.56 billion profit. Citigroup used $3.37 billion in reserves to avoid reporting a loss.

About the only bright spot in the big bank earnings reports will be in mergers and acquisitions.

JPMorgan Chase should see a 28% gain from its investment banking unit; both Goldman Sachs and Morgan Stanley are expected to see some benefit from bringing such social media companies as Linkedin Corp. (NYSE: LNKD) and Pandora Media Inc. (Nasdaq: P) to market.

But the gloomy bank earnings already have several firms looking to cut costs. Goldman Sachs already has announced it will eliminate 230 jobs in New York by this fall. Morgan Stanley has announced intentions to cut $1 billion in non-compensation expenses over three years, and intends to shed some brokers as well.

"If you're a short-term investor, banks are going to struggle, probably for the next six to 12 months," Michael Yoshikami, chief executive officer and founder of YCMNet Advisors, told Bloomberg News.

Beware, Taxpayers: The Days of U.S. Bank Bailouts Might Not Be Over

By Kerri Shannon

The U.S. government has spent more than $12 trillion to prop up large financial institutions since the 2008 financial meltdown, but more taxpayer money could still be used for U.S. bank bailouts.

A Standard & Poor's report Tuesday said that despite the government's efforts at financial reform through the Dodd-Frank Wall Street Reform and Consumer Protection Act, the U.S. Treasury, U.S. Federal Reserve and Congress could still bail out a "too-big-to-fail" bank if it felt it necessary to contain risk.

"We believe the government may try to avoid contagion and a domino effect if a Sifi [systemically important financial institution] finds itself in a financially weakened position," the S&P wrote in a research note.

S&P acknowledged that policymakers have been trying to make it clear that bank bailouts are over, but that the government's track record says otherwise.

"Time and time again, the U.S. government has found ways, many times reluctantly, to contain systemic risk and limit economic fallout when large financial institutions are on the brink of failure," said S&P.

The government bailed out U.S. financial institutions to the tune of about $700 billion through the Troubled Asset Relief Program (TARP) after the financial crisis, and distributed billions more through other programs.

After billions of dollars was handed out to banks like Goldman Sachs Group Inc. (NYSE: GS), JPMorgan Chase & Co. (NYSE: JPM) Bank of America Corp. (NYSE: BAC), and Citigroup Inc. (NYSE: C), financial firms deemed "too big to fail" only got bigger as they fed off the government subsidies. Bailouts that were supposed to be used for lending to U.S. businesses and consumers were actually put toward other investments. And many banks kept the use of bailouts a secret since they were doled out quickly in a "no strings attached" fashion.

U.S. bank bailouts also have been blamed for encouraging reckless behavior from banks that knew the government would step in with extra money if the bank got in financial trouble.

The Dodd-Frank Act attempted to end forced bailouts of "too big to fail" institutions by preventing the Fed from emergency lending to a financial institution. It gives the Federal Deposit Insurance Corp. (FDIC) the power to dismantle a failing bank and impose losses on shareholders and bondholders. The provision was intended to avoid taxpayer-funded bailouts and market-disrupting bankruptcies, like that of Lehman Bros.

But many analysts are skeptical about whether or not this "Orderly Liquidation Authority" mechanism will ever be invoked, or work as intended.

Changes to the liquidation authority are still being hammered out in Washington. The latest alteration was approved last week, giving the FDIC the power to take up to two years of Wall Street executives' pay if the compensation is found responsible for a firm's collapse.

U.S. Treasury Assistant Secretary for Financial Markets Mary Miller this week warned against making too many changes to Dodd-Frank because they could threaten the intended protection of the U.S. financial system.

"Scaling back or repealing major parts of the Dodd-Frank Act or not providing regulators with the funds they need to implement the Act will leave our economy exposed to a cycle of collapses and crises," Miller said in remarks to the Securities Industry and Financial Markets Association's (SIFMA) Regulatory Reform Summit.

Washington is still debating the specifics of the law, which was approved last July. S&P said any decisions altering the Dodd-Frank Act as it's finalized could change its views on the chances of future U.S. bank bailouts. 

See the original article >>

Sul crollo della borsa


Too Big to Fail

by Francesco Carbone

La gente non finisce mai di stupirmi. Oggi arriva uno su facebook e mi chiede: "secondo te conviene investire in titoli di stato italiano adesso?" Azione successiva: rimuovi dagli "amici". Non ha senso avere "amici" del genere, che probabilmente ancora non hanno comprato un'oncia d'oro e che sicuramente non hanno mai letto una riga di quel che ho scritto e pubblicato in dieci anni di attività. Persone che preferiscono lesinare qualche euro evitando di comprare i libri qua pubblicati, e che invece corrono a buttare cento o mille volte (o diecimila) quella cifra in pasto a un mostro che nei prossimi anni, forse mesi, si divorerà quasi tutto.

Già mi immagino l'omino allo sportello bancario: signora, i bot belli freschi di stampa usciti oggi le offrono un bel 3.6% di rendimento, i titoli a dieci addirittura un 5.5%, non si lasci scappare questa occasione che non vedevamo da almeno quindici anni. Si peccato che un tasso a dieci anni del 4.5%, di appena qualche settimana fa, non lo rivedremo davvero mai più.

A questo, tutt'al più, servirà il rimbalzo del gatto morto partito oggi che ha interessato i titoli abbattuti tra venerdì e il lunedì nero: a scaricare sui poveri retail, ergo il solito parco buoi, ciò che il mondo ha deciso di scaricare prima che sia troppo tardi. Ma che parlo a fare, i nostri libri hanno già previsto a grandi linee tutto quello che accadrà nei prossimi anni. Lasciamo semplicemente certi "amici" al loro destino. E' ciò che si meritano.

Parliamo invece del coro di voci che si stanno rincorrendo a sostenere la solidità, i fondamentali di questo paese che la frutta se l'è mangiata oramai tanti di quegli anni fa che io a 40 anni, neanche mi ricordo quando è stato l'ultimo boccone. Davvero siamo giunti alla tragicommedia. La marea di idiozie che fuoriescono dalla bocca di tutti coloro che continuano a sostenere il truffone nostrano è talmente elevata che meriterebbe davvero una raccolta speciale da far leggere ai posteri.

Riporto, traducendola, solo una delle battute più belle arrivatami con un tweet di zerohedge:

"L'amministratore delegato di unicredito dice che i titoli della sua banca sono vittima delle vendite allo scoperto. Dick Fuld ha chiamato, rivuole indietro il copione".

Non sapete chi è Dick Fuld?? Se guardate, o avete già visto, il film Too Big to Fail, lo capirete subito: era il CEO della Lehman Brothers. Prima che la sua banca fallisse diceva le stesse cose che oggi ripete il CEO di unicredito. E in Italia, più o meno, soprattutto con riferimento ai titoli del debito del paese, stanno recitando tutti lo stesso copione. Avrebbe ragione Dick Fuld a incazzarsi, i diritti di copyright sulle sue splendide battute non si possono rubare così impunemente!

Mi spiace per tutti quelli che indotti dalla stampa di regime pensano di essere vittime dello short selling o delle manovre di qualche speculatore cattivo, perchè da quel che si sente in giro non pare esserci in giro un gran ammontare di vendite allo scoperto. Invece sono vendite reali, del tipo, "get the fuck out of here" prima che sia troppo tardi, come erano quelle che colpirono a suo tempo la Lehman Brothers o più recentemente la Grecia quando i suoi tassi stavano ancora al 7% (bei tempi! era solo un anno fa!).

Il tempo è galantuomo, come sempre. Nessuno dovrebbe preoccuparsi degli short sellers: se il titolo di unicredito e i titoli di stato italiani davvero valgono si risolleveranno, ma se non valgono i prezzi di oggi, come penso io, seguiranno lo stesso destino della Lehman o della Grecia. Time will tell. As Always. Del resto non è colpa mia se una classe politica incompente in queste decadi è riuscita ad accumulare 2.000.000.000.000 di debito, piuttosto la colpa è tutta loro e di tutta quella combriccola di leccapiedi (i lumpen intellettuali) che per decenni hanno cantato al mondo che potevamo permetterci quella montagna di debito grazie ai risparmi degli italiani. Adesso ci sono 2 trilioni di montagna da gestire, e vi posso assicurare che non sono noccioline. Basta un ribasso dei prezzi pari alla metà di quello subito dalla Grecia che le società bancarie e assicurative di questo paese possono benissimo chiedere un TARP tutto italiano o farsi addirittura nazionalizzare come negli anni trenta, che si fa sicuramente prima.

Qualora i vostri risparmi venissero decimati nel prossimo futuro, mi raccomando, ringraziateli per bene tutti quanti. Li potete trovate seduti innanzitutto nelle cattedre di economia politica e macroeconomia di ogni università italiana. E poi al comando delle banche, dei partiti politici, e delle lobby che per decenni si sono arricchite soprattutto alle spalle della gente il cui salario non raggiunge neanche un quinto di quello del più povero sfigato dei soggetti appena menzionati.

La verità è che la gran parte dei risparmi degli italiani sono stati incanalati in un debito senza senso (mentre il resto è stato incanalato in una borsa che oggi vale meno della metà di 10 anni fa e poi nel gioco di scambiarsi immobili come figurine a prezzi folli!), e quindi sostanzialmente sono già stati fumati dalla classe dirigente. I prezzi espressi dai mercati fino a qualche settimana fa erano ancora frutto di una magica illusione. E lo sono stati per 15 anni. Vedere per credere il chart a vasca da bagno pubblicato tempo fa. Adesso finalmente si stanno muovendo per esprimere la vera sostanza della realtà. E siamo appena all'inizio.


La classe dirigente che ha sempre fatto ricorso a svalutazioni competitive, con l'entrata nell'Euro ha pensato di salvarsi dal default che attendeva questo paese già quindici anni fa. Hanno sicuramente guadagnato tempo, mangiando ancora a sbafo alla faccia di chi lavora, e lasciando che la gente continuasse a scavarsi la fossa. Tuttavia La Tragedia dell'Euro spiega bene come l'operazione non potesse risolversi che in un gran insuccesso, con il solo risultato di ingigantire il problema già esistente. E la palla della valanga azzurra infatti si è ingigantita. A dismisura. A me sorprende invece una cosa: come mai chi sta vendendo in questi giorni, non si sia mosso già mesi o anni fa. Misteri. I mercati manipolati dalle banche centrali, o alterati dal credito facile del sistema bancario, del resto, raramente sono razionali. Non a caso viviamo in un videogame oramai da troppi anni.

Insomma l'attacco "speculativo" di questi giorni non è altro che il redde rationem di una serie interminabile di operazioni a confisca del risparmio che sono state perpetrate in decenni di mala gestione della cosa pubblica. Esisterebbe un articolo della costituzione a difesa del risparmio. Lettera morta come scrissi tempo fa: non si può difendere il risparmio in un sistema a riserva frazionaria basato su banca centrale e valuta irredimibile.

E qua ci allarghiamo, perchè sulla base di questa verità economica, non è solo l'Italia a essere insolvente, è l'intero sistema bancario mondiale. Il debito del nostro paese, sarà solo la prima importante pedina a cadere, forse quella decisiva nel processo che porterà al crack up boom risolutivo di questo insano sistema monetario.

C'è un passaggio del film Too Big to Fail che merita particolare attenzione. Ci dice che il regista poi non è così superficiale come sembra (almeno questa è l'impressione guardando tutto il film, davvero pietoso). Mi riferisco al momento in cui il segretario del tesoro americano, disperato e insonne dice alla moglie, in piena notte e nel giardino di casa:

"Non c'è nessuna banca al mondo che abbia abbastanza denaro nelle proprie casseforti da riuscire a rimborsare i propri depositanti!" (minuto 1:03:55 secondi)

ovvero siamo in un regime a Riserva Frazionaria dove fondamentalmente tutte le banche sono insolventi! Paulson lo sa. Quanti altri lo sanno? Pochi, a meno che non abbiano letto Cosa è il Denaro o La Tragedia dell'Euro.

Una ultima parola. Se qualcuno è stato così ingenuo da pensare che gli americani si facessero fottere il loro dominio economico e finanziario da quattro burocrati europei che avevano avuto la bella idea di inventarsi una moneta unica fonte di conflitti, trasferimenti di denaro, parassitismo, e ulteriore confisca inflazionistica, è stato davvero un povero illuso. Il dollaro come vado scrivendo da anni, è spacciato, ma gli americani non lo lasceranno andare a fondo senza prima aver distrutto un competitore che dietro ha ancora più fumo del bigliettone verde.

Come scritto anche nel mio Prevedibile e Inevitabile, la Guerra dei Mondi vedrà in ultima analisi fronteggiarsi nello scontro finale i vecchi padroni della carta finanziaria contro i nuovi padroni dei beni reali. Quindi fate come volete, continuate pure a comprare carta finanziaria, ma così facendo di certo non rientrerete mai nella seconda categoria. A meno che non pensiate di vincere facendo parte della prima. Ahahahahahahahahahha (e ridiamo ogni tanto che fa bene!).

See the original article >>

Moody's Downgrades Ireland From Baa3 To Junk


Who would have thought a few years ago that Moody's would be one of the biggest supporters of the gold bulls...
Moody's Investors Service has today downgraded Ireland's foreign- and local-currency government bond ratings by one notch to Ba1 from Baa3. The outlook on the ratings remains negative.

The key driver for today's rating action is the growing possibility that following the end of the current EU/IMF support programme at year-end 2013 Ireland is likely to need further rounds of official financing before it can return to the private market, and the increasing possibility that private sector creditor participation will be required as a precondition for such additional support, in line with recent EU government proposals.

As stated in Moody's recent comment, entitled "Calls for Banks to Share Greek Burden Are Credit Negative for Sovereigns Unable to Access Market Funding" (published on 11 July as part of Moody's Weekly Credit Outlook), the prospect of any form of private sector participation in debt relief is negative for holders of distressed sovereign debt. This is a key factor in Moody's ongoing assessment of debt-burdened euro area sovereigns.

Although Moody's acknowledges that Ireland has shown a strong commitment to fiscal consolidation and has, to date, delivered on its programme objectives, the rating agency nevertheless notes that implementation risks remain significant, particularly in light of the continued weakness in the Irish economy.

The negative outlook on the ratings of the government of Ireland reflects these significant implementation risks to the country's deficit reduction plan as well as the shift in tone among EU governments towards the conditions under which support to distressed euro area sovereigns will be made available.

Despite the increased likelihood of private sector participation, Moody's believes that the euro area will continue to utilise its considerable economic and financial strength in its efforts to restore financial stability and provide financial support to the Irish government. The strength and financial capacity of the euro area is underpinned by the Aaa strength of many of its members including France and Germany, and indicated by Moody's Aaa credit ratings on the European Union, the European Central Bank and the European Financial Stability Facility.

Moody's has today also downgraded Ireland's short-term issuer rating by one notch to Non-Prime (commensurate with a Ba1 debt rating) from Prime-3.

In a related rating action, Moody's has today downgraded by one notch to Ba1 from Baa3 the long-term rating and to Non-Prime from Prime-3 the short-term rating of Ireland's National Asset Management Agency (NAMA), whose debt is fully and unconditionally guaranteed by the government of Ireland. The outlook on NAMA's rating remains negative, in line with that of the government's bond ratings.


RATIONALE FOR DOWNGRADE

The main driver of today's downgrade is the growing likelihood that participation of existing investors may be required as a pre-condition for any future rounds of official financing, should Ireland be unable to borrow at sustainable rates in the capital markets after the end of the current EU/IMF support programme at year-end 2013. Private sector creditor participation could be in the form of a debt re-profiling -- i.e., the rolling-over or swapping of a portion of debt for longer-maturity bonds with coupons below current market rates -- in proportion to the size of the creditors' holdings of debt that are coming due.

Moody's assumption surrounding increased private sector creditor participation is driven by EU policymakers' increasingly clear preference-- as expressed during the negotiations over the refinancing of Greek debt -- for requiring some level of private sector participation given that private investors continue to hold the majority of outstanding debt.
A call for private sector participation in the current round of financing for Greece signals that such pressure is likely to be felt during all future rounds of official financing for other distressed sovereigns, including Ba2-rated Portugal (as Moody's recently stated) as well as Ireland.

Although Ireland's Ba1 rating indicates a much lower risk of restructuring than Greece's Caa1 rating, the increased possibility of private sector participation has the effect of further discouraging future private sector lending and increases the likelihood that Ireland will be unable to regain market access on sustainable terms in the near future. This in turn implies that some Irish government bond investors would need to absorb losses. The increased risk of a disorderly and outright payment default or of a disorderly debt restructuring by Greece also increases the risk that Ireland will be unable to regain access to private sector credit.

The downward pressure that this creates is mitigated in Ireland's case by the strong commitment of the Irish government to fiscal consolidation and structural reforms, and by its success, so far, in achieving the fiscal adjustment required by the EU/IMF programme. To date, Ireland has met all of its objectives under that programme. In the first half of 2011, the primary balance target was exceeded, with tax revenues on track and lower-than-anticipated government expenditures. However, Moody's cautions that implementation risks related to the overall deficit reduction aims of the three-year programme are still significant, particularly in light of the continuing weakness of domestic demand.


Apart from Ireland's adherence to fiscal consolidation, Moody's also acknowledges the Irish economy's continued competitiveness and business-friendly tax environment. The considerable wage adjustment that occurred in the course of the crisis reflects the Irish labour market's flexibility. Taking Ireland's economic adjustment capacity into account, Moody's expects that, after a period of prolonged retrenchment, Ireland's long-term potential growth prospects remain higher than those of many other advanced nations. While the government's debt-to-GDP burden is expected to be high compared to similarly rated sovereign credits, Ireland has managed elevated levels of indebtedness in the past, and has shown political cohesion while enacting difficult structural adjustments.

WHAT COULD CHANGE THE RATING UP/DOWN

Moody's would consider a further rating downgrade if the Irish government is unable to meet the targeted fiscal consolidation goals. A further deterioration in the country's economic outlook would also exert downward pressure on the rating, as would further market disruption resulting from a disorderly Greek default.

Moody's also notes that upward pressure on the rating could develop if the government's continued success in achieving its fiscal consolidation targets, supported by a resumption of sustained economic growth, is able to reverse the current debt dynamics, thereby sustainably improving the Irish government's financial strength.

Morning markets: weather keeps crops ahead, despite US fears

by Agrimoney.com


Would Moody's trump Ben Bernanke?
The ratings agency's placement of America's AAA credit rating on watch for a possible downgrade won out in many Asian share markets.
Tokyo's Nikkei index, for instance, closed 0.3% lower, despite factoring in as well comments from Mr Bernanke, chairman of the Federal Reserve, earlier yesterday that the US central bank was "prepared to respond" if economic stimulus is needed.
But farm commodities at least held firm in the face of the Moody's threat, predicated on the risk of US politicians failing to agree an extension to the country's debt ceiling.
Laggards
OK, cotton struggled, as a non-food farm commodity which, as more of a discretionary purchase, can be more sensitive to economic factors.
New York's new crop December contract stood 3.2% lower at 105.00 cent a pound as of 07:40 GMT (08:40 UK time).
Tokyo rubber, another inedible crop, eased too, down 0.2% at 375.40 yen a kilogramme.
And this when latest Chinese data has given some hope to demand, putting production up 5.4% in June from a year before.
Soaring temperatures
However, grains held ground gained in a round of advances which saw east coast Australian milling wheat, for January, add 3.0%.
Dollar weakness, another product of the US economy talk, down 0.3% against a basket of currencies, helped commodities' cause, improving their competitiveness as exports.
So did the mounting fears for the US weather, and the prospect of a hot spell due to hit the Midwest this weekend.
"Daytime temperatures in Nebraska and Minnesota are forecast to approach 45 degrees Celsius (113 degrees Fahrenheit) for several days, and may start to reduce corn yield potential," Australia & new Zealand Bank said.
In Iowa, Mike Mawdsley at Market 1 said: "From here on it's weather. Worries about ridging, heat, dryness, etcetera during blooming and pollination is the news item for grains."
Intensifying heat
And latest weather model results offered no more hope for farmers, with the European one retaining a forecast that it will be "hot over the Plains and Midwest", WxRisk.com said.
"The heat dome appears over the central Plains and Mississippi Delta on July 15, and intensifies over the next several days, with the core of the dome being centred over western Missouri, eastern Kansas and southern Iowa."
"The dome reaches its peak intensity over the central plains and the western Corn Belt on July 18, then slides east on July 20 [bringing] very hot temperatures and no rains into the heart of the eastern Corn Belt for several days."
Crop setbacks
At North America Risk Management Services, Jerry Gidel said that "given 2011's corn development being significantly behind", with pollination lagging distantly the normal pace, "this important bushel-producing function for corn could be at risk".
Chicago corn for December, the first new crop contract, edged a further 0.2% higher to $6.82 ¼ a bushel, with the September lot up 0.4% at $6.89 ½ a bushel.
And soybeans were a touch stronger too, up 0.3% to $13.84 ¼ a bushel for the new crop November contract, and 0.4% to $13.80 ¾ a bushel for August delivery.
"While soybeans may not yet be in key blooming and pod-filling stages across a wide swathe of the Corn Belt, next week's heat will extend from the Delta to Wisconsin and from the western Plains to the Atlantic coast, stressing an immature crop," Kim Rugel at Benson Quinn Commodities said.
Correction ahead?
Not that there aren't concerns over recent gains.
"Remember, weather forecasts can change," Market 1's Mike Mawdsley advised, suggest investments "may want to at least consider puts should the highs be tested".
At Benson Quinn, Brian Henry had severe reservations about wheat, saying it was "setting up for someone to really get clobbered in this trade.
"While Russia continues to offer supply at $230 a tonne for 11.5% [protein] and $250 for 12.5%, French and US wheat futures continue to climb effectively resulting in a $50 premium to the Russian offers. "
The grain was a smidgen behind its Chicago peers, adding 0.2% to $7.15 ¾ a bushel for September delivery, and 0.2% to $7.44 ¼ a bushel for December.
Data later
For now, anyway, with export data later on, besides the weather outlook, potentially set to move the market.
Especially when investors have huge expectations for US corn exports in the latest week, with talk of a high for the 2010-11 marketing year and figures up to 2.0m tonnes. That would eclipse the previous week's healthy 1.5m tonnes.
Soybean sales are expected to show at least a small improvement on last week's 435,000 tonnes, and wheat meet or beat the previous figure of 424,000 tonnes.
See the original article >>

Grain prices still heading for a dip, says Goldman

by Agrimoney.com

Goldman Sachs stuck by forecasts of a tumble in grain prices by the autumn despite downbeat official estimates of US inventories, warning over buoyant expectations for ethanol plants' appetite for corn.
The investment bank acknowledged that the US Department of Agriculture's below-consensus estimates unveiled on Tuesday for domestic corn and wheat stocks at the close of 2011-12 "could push prices higher in the near term".
Corn futures soared 3% in Chicago in the last session, and wheat prices 5%, before stabilising in early deals on Wednesday.
"We see prices as currently supported by lingering uncertainty on old-crop inventory levels as well as new-crop production," the bank said.
"Near term, we expect that this uncertainty will continue to be reflected in elevated price volatility and a higher risk premium that will support prices above our forecast."
'Lower crop prices'
However, Goldman retained a forecast that prices of corn will both fall below $6 a bushel in three months' time, implying losses of more than 10% compared with the expectations being priced in on futures market.
"Assuming average weather conditions materialise in coming months, we continue to expect lower crop prices this fall," the bank said.
Corn prices were most vulnerable, and set to resume their traditional discount against wheat in Chicago by year end, with the bank sceptical over the upgrade to corn use by ethanol plants, which meant more of the grain going to make ethanol rather than livestock feed for the first time.
"While the USDA invokes strong ethanol producer margins, we believe that ethanol penetration in the US is close to the blend wall," at which production reaches the maximum levels that can be blended into gasoline.
There remains "little room for demand and production growth" until E15, a 15% blend of ethanol with gasoline, "can be commercialised", the bank added.
Soybeans vs corn
Soybeans retained the best prices prospects, with Goldman's forecasts implying values in line with the current futures curve, rather than well below, as for corn and wheat.
"While corn prices may outperform soybean prices in the near term - as the USDA's US soybean inventory forecast came in line with expectations versus a below-consensus corn inventory forecast - we expect that soybean prices will outperform corn prices over the next 12 months."
"We see soybeans as likely to remain in a deficit in 2011-12 on strong demand and acreage loss to corn and cotton."

Bank and Broker Default Risk

by Bespoke Investment Group

We created a Bank and Broker CDS (credit default swap) Index during the financial crisis to track default risk for the financial sector, and we continue to monitor the index on a regular basis. The cap-weighted index tracks CDS prices for the major banks and brokers around the world. Below is a chart of the Bank and Broker CDS Index going back to January 2009 combined with a chart of the S&P 500 Financial sector. 

As the Financial sector fell from March through June of this year, our CDS index rose, but not by as much as one might expect. The index pulled back slightly as the market bounced from 6/24 through 7/7, and it has barely moved higher in recent days even as the Financial sector continues to struggle. While sovereign debt issues across the globe have caused CDS for specific countries to spike significantly in 2011, at least credit traders have kept things quiet (so far) in the financial sector.


What Has Led the Market Lower?

by Bespoke Investment group

Below is a scatter chart showing the performance of S&P 500 sectors from 6/24 through 7/7 (when the S&P rallied 6.7%) versus their performance since 7/7 (with the S&P 500 down 2.92%). In general, the sectors that went up the most during the prior rally have sold off the most since the rally ended last Thursday. The four defensive sectors (Utilities, Telecom, Consumer Staples and Health Care) are all bunched up in the top left corner of the chart. These sectors all went up between 3% and 4% from 6/24 through 7/7 and have gone down between 1% and 2% since then. Energy, Technology, Consumer Discretionary, and Materials went up the most during the rally (between 8% and 9%), and they're all down right around 3% during the current pullback. Industrials and Financials are the two sectors that stand out the most in the chart. The Industrials sector rallied slightly less than the other cyclicals from 6/24 through 7/7, and it has fallen more than the other cyclicals since 7/7. The Financial sector was up less than the S&P 500 during the 6/24-7/7 rally, and it is down the most of any sector since 7/7 with a decline of 4.35%. Yes, the Financial sector continues to act as a drag on the market.

We also broke the S&P 500 into deciles (10 groups of 50 stocks each) based on stock performance during the rally from 6/24 to 7/7 to see how the best and worst performing stocks during that time period have done during the pullback. As shown in the chart below, the average performance of stocks in each decile since 7/7 has been pretty similar across the board. Typically the stocks that go up the most during a rally also go down the most on pullbacks, but that hasn't been the case this time around.


If You’re Not Scared, You’re Not Paying Attention

by Graham Summers

Forget the details and the specifics… here’s the latest news you need to know about.

Europe is bankrupt and the EU will not exist in its current form within 12 months. The ECB tried to “bailout our way to success” strategy on some of the more minor players (Greece), but is now finding that there isn’t actually enough money to bail out the larger players (Spain and Italy).

So, barring a leveraged buyout of Italy by Germany and China, the EU will be breaking up and the Euro collapsing within the next 12 months. How this will happen remains to be seen (the EU splits into two sections? Is done away with altogether? Etc). But the facts remain that the EU has reached the end game for bailouts (you cannot bail out entire countries).

The last straw of hope that the bulls are clinging is China’s recent decision to actively buy EU member states’ sovereign debt. Those of us who recall China’s decision to buy Morgan Stanley in 2008 can’t help but wonder if the country has never heard of “due diligence” or if it simply doesn’t care about losing money.

Speaking of China, the People’s Republic is finding out that the Republic made $540 billion worth of loans to the people that:

1) Have not been accounted for
2) Are properly garbage and won’t be paid back

We all know how this scheme ends (see subprime collapse in US). However, given that China pretty much makes up its economic data, it’s pretty safe to assume that the bad loan situation there is even worse than Moody’s believes. So look for a “2008 type” bust in China in the coming months.

And then of course there’s the US: the current least horrendous disaster winner by default (literally in Europe’s case and metaphorically in China’s case). Congress continues to play “debt talk” phone tag with President Obama.

However, to say this is a debate ignores the fact that there isn’t actually two sides to this discussion. Both Congress and the White House are debt-crazed groups who believe throwing good money after bad = recovery. So regardless of whether the debt ceiling is raised or budget talks reach an agreement, the US is broke and will continue to be until we default and restructure our debt obligations.

In simple terms, what I’m trying to say is that we are about to witness another “2008” only on a sovereign scale. The EU will be first, but China, Japan, and even the US will be defaulting in the future. The implications these actions have for asset classes will be HUGE as all assets move relative to sovereign bonds which used to be considered the primary low risk asset class in the world.

So expect another bigger Crisis that that will be the equivalent of 2008 all over again, along with food shortages, civil unrest, outbreaks in crime, bank holidays, and the like. It will, in short, be like what’s going on in the Middle East today (though NATO won’t be bombing us).

Which is why if you haven’t already taken steps to prepare yourself and your portfolio for the coming disaster, you need to do so NOW.

Moody's Puts US AAA Credit Rating on Review, Places 7,000 Municipal Ratings on Review as a Result; Bernanke Slapped Already?

by Mike Shedlock

At long last the bond vigilantes have a spotlight on US debt. Please consider Japan Stock Futures Fall as Yen Rises as Moody’s Reviews U.S Credit Rating
Moody’s Investors Service put the U.S., rated Aaa since 1917, under review for a credit-rating downgrade for the first time since 1995 on concern the government’s $14.3 trillion debt limit will not be raised in time to prevent a missed payment of interest or principal on outstanding bonds and notes even though the risk remains low. The rating would likely be reduced to the Aa range and there is no assurance that Moody’s would return its top rating even if a default is quickly cured.

Federal Reserve Chairman Ben S. Bernanke told Congress the central bank is prepared to take additional action, including buying more government bonds, if the economy appears to be in danger of stalling. The Fed last month completed a program to buy $600 billion of Treasury bonds that aimed to stimulate the economy by reducing borrowing costs, boosting stock prices and spurring consumer spending.
Moody’s Places 7,000 Municipal Ratings on Downgrade Review

Bloomberg reports Moody’s Places 7,000 Municipal Ratings Tied to U.S. on Downgrade Review
Moody’s Investors Service placed 7,000 municipal ratings on review for possible downgrade after it warned the U.S. may lose its Aaa investment grade.
Gold Soars as Bernanke Pledges More Stimulus

At 12:30 I reported Bernanke Pledges More Monetary Stimulus, Dollar Tanks, Gold Soars to Record High
The ping-pong match between the ECB and Fed to see who can make the worst policy decisions the fastest, switched back in favor of the Fed today with Bernanke's pledge to pour on the monetary stimulus if needed.

Most think it's a given that the stock market will soar when Bernanke starts QE3. I don't. Just because it did last time does not mean it will every time.

One of these times Bernanke is going to react in a way that spooks the bond market in a major way, and the market will slap him silly just as happened to Jean-Claude Trichet and the ECB over Trichet's "no default" insistence.
Bernanke Slapped Already?

The market was relatively giddy when I made those comments. I was on the road having lunch when I made those comments. I have internet access now at 8:46 PM, for the first time since.

This is the way things looked after the close.

S&P 500 Intraday Chart


As I type, I note that the S&P futures are down 4 points to 1308. I also note that gold held nearly all of its gains today as did the $HUI, unhedged miner index.

$HUI Intraday Chart


I caution that it is too early to say what the market is reacting to, if indeed it is reacting to anything at all. However, this could be the start of the bond and equity markets either having had more than they can take from the monetarist policies of Bernanke and/or the fiscal policies of Congress.

I repeat my caution that one of these times, the market is going to spit directly in the face of Bernanke when he pulls one of his monetarist stunts. I do not know if this is the time, but the sooner it happens the better off the US and the rest of the world will be.

University of California Economist Brad DeLong (who is calling for more monetary easing), should put this in his pipe and smoke it. DeLong is blind, but I assume he can still breathe.

Follow Us