by
And it is about time! Why it was way back in May of, uh, let me think, umm, ahhh…..yes 2011 that we reached a peak. Over two months ago! Back in the beginning of May, Silver ($SI_F) was all anyone could talk about. After peaking and falling dramatically I wrote a piece about why it looked to have more downside (link below). Now after all this time it is starting to look bullish again. Here is my case in three charts.

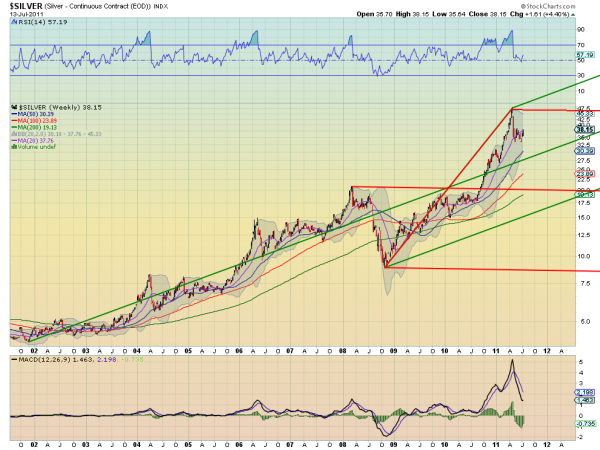
The weekly chart for Silver using the Andrew’s Pitchfork tool shows that after setting the Upper Median Line of the bullish Green Pitchfork it moved back toward the Median Line but has been captured by the pull of the Upper Median Line and stalled. It has also reversed course higher towards the Upper Median Line of the bearish Red Pitchfork. This view shows Silver heading higher.

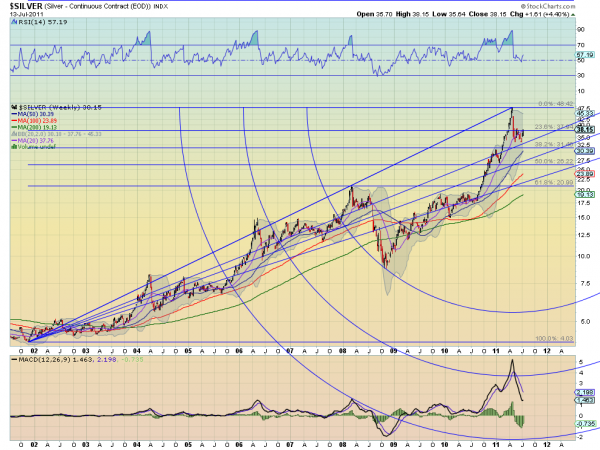
The Fibonacci’s applied to the weekly chart also point higher. After making a top the pullback found support at the first Fibonacci Fan line and is now breaking above the 23.6% Fibonacci retracement level. a solid hold above 37.84 would suggest a move higher to retest the 48.42 high.

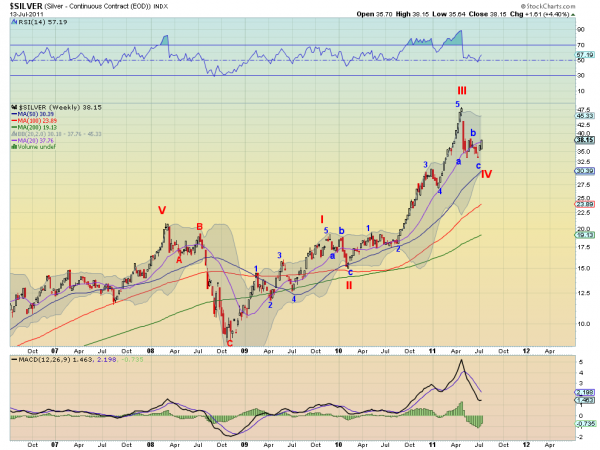
The Elliott Wave chart shows that Silver is beginning Wave V of the motive wave higher. Wave V could extend to 67 without any real issues. So what is there in the way in terms of resistance along the way? One more chart.

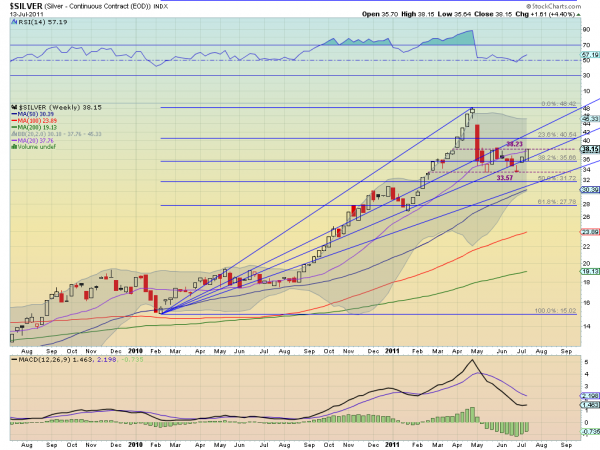
After peaking the pullback to the Fan line gives clues. There is support at the previous lows near 33.57 and now also at the Fibonacci level of 35.66. Resistance comes at 38.23, just above the current level and the 40.54 level above that. if it can get through 40.54 then the fan line is at 42 above followed by the gap at 43.75 before retesting the high and getting into free air. If you cannot play the futures then the iShares Silver Trust (ticker: $SLV) is a good proxy.
No comments:
Post a Comment