Wednesday, June 19, 2013

Bernanke says Fed on course to end asset buying in mid-2014

By Joshua Zumbrun and Jeff Kearns

Federal Reserve Chairman Ben Bernanke (Source: Bloomberg)Federal Reserve Chairman Ben Bernanke (Source: Bloomberg)

Federal Reserve Chairman Ben S. Bernanke said the central bank may start reducing bond purchases later this year and end them in mid-2014 if the economy continues to improve as the central bank forecasts.

“If the incoming data are broadly consistent with this forecast, the committee currently anticipates that it would be appropriate to moderate the pace of purchases later this year,” Bernanke said today in a press conference in Washington. “If the subsequent data remain broadly aligned with our current expectations for the economy, we will continue to reduce the pace of purchases in measured steps through the first half of next year, ending purchases around mid-year.”

Bernanke spoke after the Federal Open Market Committee said today it would maintain the $85 billion pace of monthly asset purchases and that it sees the “downside risks to the outlook for the economy and the labor market as having diminished since the fall.” The FOMC repeated that it’s prepared to increase or reduce the pace of purchases depending on the outlook for the job market and inflation.

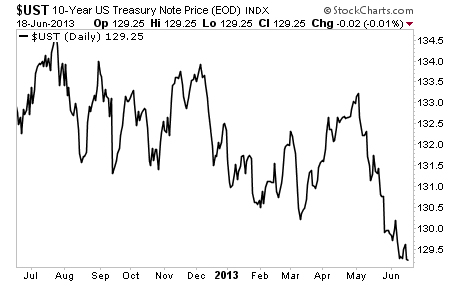
Bernanke is expanding the Fed’s balance sheet toward $4 trillion as he seeks to reduce a jobless rate that stands at 7.6% after four years of economic growth. Concern that the Fed is closer to reducing the pace of asset purchases, also known as quantitative easing, pushed 10-year Treasury yields to the highest since March 2012.

Stocks extended losses after his remarks. The Standard & Poor’s 500 Index declined 1.3% at 3:57 p.m. in New York. The yield on the 10-year Treasury note rose to 2.34% from 2.19% late yesterday.

Downside Risks

“The Fed is out of the closet,” said Ward McCarthy, chief financial economist at Jefferies Group LLC in New York and a former Richmond Fed economist. “They expect to end these QE purchases. Bernanke wasn’t more specific than later this year, but connecting all the dots suggests he is thinking in the fourth quarter.’’

Bernanke stressed that the Fed has “no deterministic or fixed plan” to end asset purchases.

“If you draw the conclusion that I just said that our policies -- that our purchases will end in the middle of next year, you’ve drawn the wrong conclusion, because our purchases are tied to what happens in the economy,” he said. “If the economy does not improve along the lines that we expect, we will provide additional support.”

Unemployment Threshold

The Fed also left unchanged its statement that it plans to hold its target interest rate near zero as long as unemployment remains above 6.5% and the outlook for inflation doesn’t exceed 2.5%.

Bernanke said policy makers might aim for a lower unemployment threshold before considering an increase in short- term interest rates.

“In terms of adjusting the threshold, I think that’s something that might happen,” he said in response to a question. “If it did happen, it would be to lower it, I’m sure, not to raise it.” He said an interest-rate increase is still “far in the future.”

Fed officials lowered their forecasts for the unemployment and inflation rates this year.

They now see a jobless rate of 7.2% to 7.3%, compared with 7.3% to 7.5% in their March forecasts. They predict the jobless rate will fall to 6.5% to 6.8% in 2014, compared with 6.7% to 7% in March.

Labor Market

“Labor market conditions have shown further improvement in recent months, on balance, but the unemployment rate remains elevated,” the committee said. “Partly reflecting transitory influences, inflation has been running below the committee’s longer-run objective, but longer term inflation expectations have remained stable.”

Fifteen of 19 policy makers said the federal funds rate will be increased in 2015 or later, according to today’s forecasts. In March, 14 policy makers predicted an increase in 2015 or later.

The Fed repeated that it will keep buying assets “until the outlook for the labor market has improved substantially.” Bond purchases will remain divided between $40 billion a month of mortgage-backed securities and $45 billion a month of Treasury securities. The central bank also will continue reinvesting securities as they mature.

Labor Market

St. Louis Fed President James Bullard dissented, saying the committee should “signal more strongly its willingness to defend its inflation goal in light of recent low inflation readings.”

Kansas City Fed President Esther George dissented for the fourth meeting in a row, continuing to cite concern that keeping the benchmark interest rate near zero risks creating “economic and financial imbalances,” including asset price bubbles.

No change in policy was expected at today’s meeting. Fifty- eight of 59 economists in a June 4-5 Bloomberg Survey predicted the central bank would maintain the pace of purchases.

Investors are scrutinizing the Fed’s communications for signs the period of unprecedented stimulus is coming to an end as the economy recovers from the longest and deepest recession since the Great Depression.

Inflation is providing little impetus for a tapering in bond purchases. A gauge of consumer prices excluding food and energy that is watched by the Fed rose 1.1% in the year through April, matching the smallest gain since records started in 1960.

Biggest Jump

Speculation that an improving economy will prompt Fed policy makers to reduce bond buying last month triggered the biggest jump in 10-year Treasury yields since December 2010.

About $2 trillion has been erased from the value of global equities since Bernanke told U.S. lawmakers on May 22 that the FOMC “could” consider reducing bond purchases within “the next few meetings” if officials see signs of improvement in the labor market and are convinced the gains can be sustained.

Mortgage rates have soared the most in a decade on speculation the Fed’s purchases may slow. The interest rate on a 30-year fixed home loan climbed to a 14-month high of 3.98% last week, according to data compiled by Freddie Mac.

Investors may be over-reacting to the prospect of a reduction in the pace of bond purchases, Nathan Sheets, the former head of the Fed’s international finance division, said before the Fed announcement.

Still Buying

“Tapering is not a reduction in stimulus,” said Sheets, now the global head of international economics at Citigroup Inc. in New York. “The Fed will still be buying, still removing duration from the market.”

Bernanke is nearing the end of his second four-year term, a period marked by unprecedented measures to battle the deepest recession since the 1930s and then to keep the economy growing at a pace that’s brisk enough to put millions of unemployed Americans back to work.

The former Princeton professor cut the Fed’s target interest rate almost to zero in December 2008 and has led the central bank in three rounds of large-scale asset purchases that have swelled the Fed’s balance sheet to a record $3.41 trillion.

Obama Comments

President Barack Obama, in an interview on PBS this week, provided one of the clearest signals yet that Bernanke may not remain beyond the end of his term on Jan. 31. Bernanke “already stayed a lot longer than he wanted or he was supposed to,” Obama said.

Bernanke declined to discuss his future at today’s press conference.

“We just spent two days working on monetary policy issues and I would like to keep the debate, discussion, questions here on policy,” he said in response to a question. “I don’t have anything for you on my personal plans.”

The labor market has gained strength since the Fed began the latest round of asset purchases in September. Employers added 175,000 jobs in May, and the country has regained 6.3 million jobs since 2010, 72% of those lost in the aftermath of the recession.

Still, unemployment has been 7.5% or higher since January 2009, the longest stretch of such high joblessness since the depression. The ratio of workers to the total population fell to 58.2% in 2011, the lowest since 1983. The ratio rose to 58.6% in May.

Global Growth

Slowing global growth and federal government budget cuts are taking a toll on the world’s largest economy. Manufacturing unexpectedly shrank in May at the fast pace in four years, according to figures from the Institute for Supply Management.

“The uncertainty that continues in Washington has an adverse effect on confidence,” Jeffrey Smisek, chief executive officer of United Continental Holdings Inc. in Chicago, the world’s largest airline, said in a June 14 presentation. “We don’t see a degradation in the United States demand, but we don’t see a significant improvement.”

A rebound in housing, fueled by record-low mortgage rates, has shored up the expansion. Home prices rose 10.9% in the 12 months through March, according to the S&P/Case Shiller index of property values in 20 cities, the biggest annual gain since April 2006.

Blackstone Group LP Chief Executive Officer Stephen Schwarzman said this month housing has been a “big winner” in the economy.

The world’s biggest alternative-asset manager has spent $5 billion to acquire almost 30,000 U.S. single-family houses in a bet home prices will maintain gains. New York-based Blackstone has jumped 38% this year before today, more than double the gain for the S&P 500.

“You are seeing a lot of strength in housing and it’s coming from almost every place geographically,” Schwarzman said in a June 11 presentation to investors.

See the original article >>

Cash Squeeze in China, Interest Rate Swaps Rise Most in 22 Months; China's Credit Bubble About to Pop; Shadow Banking Crackdown

by Mike "Mish" Shedlock

Bloomberg reports China Swaps Surge as Cash Squeeze Sees Demand Wane at Debt Sale.

China’s one-year interest-rate swap rose by the most in 22 months as the central bank refrained from adding funds to the financial system to ease a cash squeeze, causing demand to fall at a government debt auction.
“The cash shortage may get even worse before the quarter-end because banks will have to hoard cash to meet loan-to-deposit ratio requirements,” said Chen Qi, a strategist at UBS Securities Co. in Shanghai. “The central bank probably won’t come out to intervene unless there is a sharp decline in economic growth and large capital outflows.”
“The market is disappointed by the lack of reverse repos from the PBOC,” said Frances Cheung, a strategist at Credit Agricole CIB in Hong Kong. “The liquidity squeeze stems from less inflows and policy makers’ own policy to crack down on shadow banking, so the PBOC may be reluctant to use short-term tools to help.”
Fitch Ratings said in a statement yesterday that the cash shortage reflects the move to reduce shadow banking, a measure that will ultimately slow economic growth.
Capital Flight
The statement by Chen Qi “The central bank probably won’t come out to intervene unless there is a sharp decline in economic growth and large capital outflows” is interesting.
Qi's statement comes fresh on the heels of an article by Ambrose Evans-Pritchard a few days ago entitled China braces for capital flight and debt stress as Fed tightens.
A front-page editorial on Friday in China Securities Journal - an arm of the regulatory authorities - warned that capital inflows have slowed sharply and may have begun to reverse as investors grow wary of emerging markets. “China will face large-scale capital outflows if there is an exit from quantitative easing and the dollar strengthens.” it wrote.
The journal said foreign exodus from Chinese equity funds were the highest since early 2008 in the week up to June 5, and the withdrawal Hong Kong funds were the most in a decade.
It also warned that total credit in Chinese financial system may have reached 221pc of GDP, jumping almost eightfold over the last decade. Companies will have to fork out $1 trillion in interest payments alone this year. “Chinese corporate debt burdens are much higher than those of other economies and much of the liquidity is being used to repay debt and not to finance output,” it said.
There have been signs of serious stress in China’s interbank lending markets, with short-term SHIBOR rates spiking violently. Bank Everbright missed an interbank payment last week in a technical default.
“Liquidity conditions have tightened severely due to the crackdown on shadow banking activities,” said Zhiwei Zhang from Nomura.

China's Credit Bubble About to Pop
In a followup post, Ambrose Evans-Pritchard writes Fitch says China credit bubble unprecedented in modern world history
China's shadow banking system is out of control and under mounting stress as borrowers struggle to roll over short-term debts, Fitch Ratings has warned.
"The credit-driven growth model is clearly falling apart. This could feed into a massive over-capacity problem, and potentially into a Japanese-style deflation," said Charlene Chu, the agency's senior director in Beijing.
"There is no transparency in the shadow banking system, and systemic risk is rising. We have no idea who the borrowers are, who the lenders are, and what the quality of assets is, and this undermines signalling," she told The Daily Telegraph.
Bank Everbright defaulted on an interbank loan 10 days ago amid wild spikes in short-term "Shibor" borrowing rates, a sign that liquidity has suddenly dried up. "Typically stress starts in the periphery and moves to the core, and that is what we are already seeing with defaults in trust products," she said.
Fitch warned that wealth products worth $2 trillion of lending are in reality a "hidden second balance sheet" for banks, allowing them to circumvent loan curbs and dodge efforts by regulators to halt the excesses.
This niche is the epicentre of risk. Half the loans must be rolled over every three months, and another 25pc in less than six months. This has echoes of Northern Rock, Lehman Brothers and others that came to grief in the West on short-term liabilities when the wholesale capital markets froze.
Overall credit has jumped from $9 trillion to $23 trillion since the Lehman crisis. "They have replicated the entire US commercial banking system in five years," she said.
The China Securities Journal said total credit in China's financial system may be as high as 221pc of GDP, jumping almost eightfold over the last decade, and warned that companies will have to fork out $1 trillion in interest payments alone this year. "Chinese corporate debt burdens are much higher than those of other economies. Much of the liquidity is being used to repay debt and not to finance output," it said.

Shadow Banking Crackdown
This shadow banking crackdown is a good thing. The longer it is put off the more violent the reaction when it does happen.
Yet, the crackdown was put off so long already, severe ramifications on growth are already baked in the cake.
In turn, the slowdown in China will hit the commodity exporting countries (Australia, Brazil, Canada) quite hard.

See the original article >>

Dollar Soars, Assets Hit on Fed's Assessment

by Marc to Market

The Fed statement noted that the downside risks have diminished since the fall when it more than doubled the size of the its asset purchases. This coupled with Bernanke's comment that tapering is possible later this year with QE ending purchases around the middle of next year.

These two components outweighed the downgrade in this year's growth and inflation forecast, the first dovish dissent in several years (Bullard wanting to the Fed to more adamant about defending its inflation objectives in light of the recent low readings. Although the dollar has been trending lower against the major currencies since late May as the talk of tapering heated up, helped by comments by Bernanke himself, it rallied strongly against the major currencies in the aftermath of the Fed's statement and extended those gains in response to Bernanke's press conference.

Emerging market currencies, which have generally been under pressure, extended their losses. US interest rates rose sharply in response to the Fed and Bernanke. The benchmark 10-year yield rose to new highs. This is likely to trigger a sharp rise in European yields on Thursday and given the linkages with the banks, may way disproportionately on financial shares in Europe. The periphery in Europe, which is just seeing preliminary signs of a cyclical recovery are particularly vulnerable.

The US equity market fell sharply and although this would usually pose a challenge for Japanese shares, the weakness of the yen may actually help support the Nikkei (and Topix).

The Fed's statement itself was largely the same as last time, except for the acknowledgment that the downside risks had diminished and that owing partly to transitory factors, inflation was below the committee's long run objective. Longer term inflation expectations remained anchored, in the Fed's opinion, though we wonder how much of those expectations are a function of the Fed's QE.

Barring a new deterioration in labor market conditions, we suspect that the inflation story may become more salient in the coming months and Bernanke seemed to confirm this in his remarks.

Contrary to what some critics have argued, the statement and forecasts suggest that the FOMC sees QE3 as being successful in supporting the economy. The Fed's 2103 GDP forecast with a midpoint of 2.5% is still about half a percentage point above the market consensus. This warns that unless there is a substantial change in the pace of growth in Q3, the Fed may revise down its GDP forecast again in September.

The inflation forecast was also lowered to 1.2-1.3% (core PCE) from 1.5-1.6%. Give base effect considerations, this too may be lowered in September's update. So, while those who came into today's meeting expecting the Fed would taper in the Sept/Oct period have not reason to change their views, anticipating the next changes in the Fed's forecasts suggests to us that it is far from a done deal.

Bernanke made several points in the press conference that are worth noting, though not unexpected. First tapering is not tightening. Even if the Fed were to reduce the amount of assets it is buying every month, it will be continuing to purchase assets. Second, the thresholds of unemployment and inflation are not triggers of policy. The Fed is not going on automatic pilot and will continue to review the overall economy and set policy accordingly.

Third, the Fed may lower its unemployment threshold from 6.5%, indicating that the goal, which is likely to be what the Fed considers non-inflationary level of unemployment is 5-6%. Fourth, there is a consensus at the Fed not to sell the MBS securities it has accumulated. There did not seem to be a reference to its Treasury holdings. Fifth, Bernanke stressed the upcoming data is key. This is not new, but worth emphasizing.

We have anticipated the tapering for late this year, but recognize the risks that this may be pushed into next year. We are concerned like Bullard about the low inflation. We also recognize that the pace of job growth has slowed in the past three months. We also see the advantages of allowing the next Federal Reserve chairperson to taper and in so doing, bolster their anti-inflation credentials.

See the original article >>

3 Reasons Stocks May Stumble Despite Fed

by Lance Roberts

All eyes are on the Federal Reverse announcement as the market will quickly parse Bernanke's statements for clues on a reduction of the $85 billion monthly bond buying program that has sent stocks to all-time highs in recent months. As I stated back in February the advance to these new highs was certainly expected as the Fed flooded the financial markets with excess liquidity. The chart below shows the high correlation between the Federal Reserve's balance sheet and the financial markets.

Fed-Balance-Sheet-VS-SP500-061913

The question is simply this: What happens if the Fed does announce a slowing of their bond buying program?

In theory this is binary answer: "No Taper" - stocks go up. "Taper" - stocks go down. Reality, however, may be more of a singularity for three reasons: overbought conditions, fundamentals and economics.

Overbought Conditions:

There is one truth about the markets, despite Federal Reserve interventions, that remains true: "Stocks do not go in a straight line."

During unfaltering advances in the market investors begin to migrate towards the belief that the stock market will continue its current trajectory indefinitely into the future. This is particularly true near market tops when almost every pundit, analysts and investor is touting why now is the time to "jump in". Of course, history is replete with examples of the disaster that followed such advice.

As we discussed at length in our recent weekly missive "An Initial Sell Signal Approaches" prices can only move so far away from their long term average before "gravity" sucks prices back. The chart below shows the S&P Index on a weekly basis (which smooths out day to day volatility) with a set of Bollinger bands representing 3-standard deviations from the mean.

S&P-500-50WMA-Deviation-061913

[Geek Note: In statistics and probability theory, standard deviation shows how much variation or dispersion exists from the average (mean), or expected value. In a normal distribution of data, as shown by the bell curve below, ONE standard deviation from the mean encompasses 68.2% of all data in the distribution (in our case price movement). TWO deviations account for 95.4% of all potential price movement while THREE deviations account for 99.8%. There when prices reach two and three standard deviations above or below their mean the majority of the probable price movement has been achieved.]

With the market trading at 3-standard deviations above the 50-week moving average history suggest that a correction of some magnitude is forthcoming regardless of the Federal Reserve's interventions. This extreme deviation from the long term average combined with record levels of margin debt has the market primed but currently lacking a catalyst to ignite a selling panic.

Fundamentals:

The fundamental underpinnings of the market are also showing signs of strain. While the Federal Reserve interventions, and near zero-interest rate policy, has forced investors to "chase yield" in the financial markets - the current rise in asset prices comes at a time when corporate earnings are hitting a record and showing signs of deterioration as shown in the chart below.

S&P-500-Earnings-061313

The problem with the peak in earnings is that it negatively impacts the "valuation" story of stocks. If the mainstream analysts are right, and bond yields are set to rise substantially, the valuation story (earnings yield versus interest yield) becomes much less compelling. Ultimately, the weakness that is showing up in the fundamental story will translate into a repricing of "risk" in the markets.

Economics:

Behind the scenes of earnings and price momentum is the economic story. In the long run the markets respond to the strength, weakness, in economic growth. While the market charged ahead in hopes of strengthening economic underpinnings - the problem has been that it has yet to be the case. With the economy "muddling" along at less that a 2% real annual rate - the pickup in employment, above mere population growth, wages and demand have been weak.

The chart below shows real, inflation adjusted, GDP turned into an economic indicator. When the annual growth rate has historically fallen below 2% the economy was either in, or about to be in, a recession. The only time in history that this has not been the case was in 2011 when the economy fell below the 2% threshold for 4 straight quarters. Of course, the bailout of the economy through liquidity programs kept the economy from sliding lower.

GDP-Recession-Indicator-061313

The economy is currently pushing a third straight quarter of sub-2% growth with the Federal Reserve discussing taking away a major support for the economy. The extraction of liquidity from the system will stem the forward pull of future consumption, which has come at the expense of higher credit balances and lower personal savings rates for consumers, leading to weaker rates of economic growth.

With corporate earnings dependent on consumer spending (70% of GDP) the gap between economic realities and financial fantasy will likely be filled sooner, if the economy continues to weaken.

The weak economic story, combined with weakening fundamentals and extreme price overvaluation will ultimately lead to a correction of some magnitude in the market. This will occur regardless of whether the Federal Reserve "tapers" their intervention program or not. This leaves investors at the whims of a highly leveraged market that has become much more volatile in recent years. Investors have piled into some of the riskiest assets in the market in their quest for income as their faith has been placed in the Fed that they will prevent a market meltdown. Maybe that is the case, however, history suggests that such blind faith in the markets has rarely worked out well in the long run.

See the original article >>

Fed keeps $85 billion pace of bond buying, sees risks waning

By Joshua Zumbrun and Jeff Kearns

The Federal Reserve will keep buying bonds at a pace of $85 billion a month and said that risks to the economy have decreased.

“The committee sees downside the risks to the outlook for the economy and the labor market as having diminished since the fall,” the Federal Open Market Committee said today at the conclusion of a two-day meeting in Washington. It repeated that it’s prepared to increase or reduce the pace of purchases depending on the outlook for the job market and inflation.

Chairman Ben S. Bernanke is expanding the Fed’s balance sheet toward $4 trillion as he seeks to reduce a jobless rate that stands at 7.6% after four years of economic growth. Investor concern that the Fed may soon start to reduce the pace of asset purchases this month pushed 10-year Treasury yields to a 14-month high.

Stocks extended losses after the statement. The Standard & Poor’s 500 Index declined 0.4% at 2:06 p.m. in New York. The yield on the 10-year Treasury note rose to 2.26% from 2.19% late yesterday.

Bernanke, 59, is scheduled to explain the Fed’s actions at a 2:30 p.m. press conference in Washington.

The Fed also left unchanged its statement that it plans to hold its target interest rate near zero as long as unemployment remains above 6.5% and the outlook for inflation doesn’t exceed 2.5%.

Mortgage Bonds

The Fed’s bond purchases will remain divided between $40 billion a month of mortgage-backed securities and $45 billion a month of Treasury securities. The central bank also will continue reinvesting securities as they mature.

The Fed repeated that it will keep buying assets “until the outlook for the labor market has improved substantially.”

“Labor market conditions have shown further improvement in recent months, on balance, but the unemployment rate remains elevated,” the committee said. “Partly reflecting transitory influences, inflation has been running below the committee’s longer-run objective, but longer term inflation expectations have remained stable.”

Fed officials lowered their forecasts for the unemployment and inflation rates this year.

They now see a jobless rate of 7.2% to 7.3%, compared with 7.3% to 7.5% in their March forecasts. They predict the jobless rate will fall to 6.5% to 6.8% in 2014, compared with 6.7% to 7.0% in March.

Fed Funds

Fifteen of 19 policy makers said the federal funds rate will be increased in 2015 or later. In March, 14 policy makers predicted an increase in 2015 or later.

St. Louis Fed President James Bullard dissented, saying the committee should “signal more strongly its willingness to defend its inflation goal in light of recent low inflation readings.”

Kansas City Fed President Esther George dissented for the fourth meeting in a row, continuing to cite concern that keeping the benchmark interest rate near zero risks creating “economic and financial imbalances,” including asset price bubbles.

No change in policy was expected at today’s meeting. Fifty- eight of 59 economists in a June 4-5 Bloomberg Survey predicted the central bank would maintain the pace of purchases.

Investors are scrutinizing the Fed’s communications for signs the period of unprecedented stimulus is coming to an end as the economy makes recovers from the longest and deepest recession since the Great Depression.

Consumer Prices

Inflation is providing little impetus for a tapering in bond purchases. A gauge of consumer prices excluding food and energy that is watched by the Fed rose 1.1% in the year through April, matching the smallest gain since records started in 1960.

Speculation that an improving economy will prompt Fed policy makers to reduce bond buying last month triggered the biggest jump in 10-year Treasury yields since December 2010. The yield hit 2.29% on June 11, the highest intraday level since April 2012. The benchmark 10-year yield was little changed yesterday at 2.19%.

About $2 trillion has been erased from the value of global equities since Bernanke told U.S. lawmakers on May 22 that the FOMC “could” consider reducing bond purchases within “the next few meetings” if officials see signs of improvement in the labor market and are convinced the gains can be sustained.

Stocks Declined

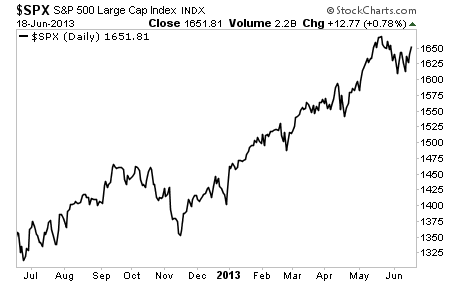
The S&P 500 Index tumbled 3.6% between May 21 and June 5, the steepest such decline since November. The benchmark gauge for American equities rose 0.8% yesterday to 1,651.81.

Mortgage rates have soared the most in a decade on speculation the Fed’s purchases may slow. The interest rate on a 30-year fixed home loan climbed to a 14-month high of 3.98% last week, according to data compiled by Freddie Mac.

Investors may be over-reacting to the prospect of a reduction in the pace of bond purchases, said Nathan Sheets, the former head of the Fed’s international finance division.

“Tapering is not a reduction in stimulus,” said Sheets, now the global head of international economics at Citigroup Inc. in New York. “The Fed will still be buying, still removing duration from the market.”

Bernanke is nearing the end of his second four-year term, a period marked by unprecedented measures to battle the deepest recession since the 1930s and then to keep the economy growing at a pace that’s brisk enough to put millions of unemployed Americans back to work.

Asset Purchases

The former Princeton professor cut the Fed’s target interest rate almost to zero in December 2008 and has led the central bank in three rounds of large-scale asset purchases, or quantitative easing, that have swelled the Fed’s balance sheet to a record $3.41 trillion.

President Barack Obama, in an interview on PBS this week, provided one of the clearest signals yet that Bernanke may not remain beyond the end of his term on Jan. 31. Bernanke “already stayed a lot longer than he wanted or he was supposed to,” Obama said.

The labor market has gained strength since the Fed began the latest round of asset purchases in September. Employers added 175,000 jobs in May, and the country has regained 6.3 million jobs since 2010, 72% of those lost in the aftermath of the recession.

Strength Seen

“The economy is recovering, and there’s a great deal of strength behind it,” said Andrew Wilkinson, chief economic strategist at Miller Tabak & Co. in New York, citing gains in construction and employment and rising retail sales. “People are going out and spending, not keeping the pocketbook closed.”

Still, unemployment has exceeded 7.5% since January 2009, the longest stretch of such high joblessness since the depression. The ratio of workers to the total population fell to 58.2% in 2011, the lowest since 1983. The ratio rose to 58.6% in May.

Slowing global growth and federal government budget cuts are taking a toll on the world’s largest economy. Manufacturing unexpectedly shrank in May at the fast pace in four years, according to figures from the Institute for Supply Management.

“The uncertainty that continues in Washington has an adverse effect on confidence,” Jeffrey Smisek, chief executive officer of United Continental Holdings Inc. in Chicago, the world’s largest airline, said in a June 14 presentation. “We don’t see a degradation in the United States demand, but we don’t see a significant improvement.”

Housing Rebound

A rebound in housing, fueled by record-low mortgage rates, has shored up the expansion. Home prices rose 10.9% in the 12 months through March, according to the S&P/Case Shiller index of property values in 20 cities, the biggest annual gain since April 2006.

Blackstone Group LP Chief Executive Officer Stephen Schwarzman said this month housing has been a “big winner” in the economy.

The world’s biggest alternative-asset manager has spent $5 billion to acquire almost 30,000 U.S. single-family houses in a bet home prices will maintain gains. New York-based Blackstone has jumped 38% this year before today, more than double the gain for the S&P 500.

“You are seeing a lot of strength in housing and it’s coming from almost every place geographically,” Schwarzman said in a June 11 presentation to investors.

See the original article >>

Grain prices rise on China order, crop downgrades

by Agrimoney.com

Grain prices extended gains, with wheat rising 2% to regain $7 a bushel in Chicago, after China was said to be back in wheat-buying mode, with Informa Economics and Lanworth chipping in with crop downgrades too.

Chicago wheat for July soared nearly 3% at one point, helping the new crop December corn lot extend its rally too to 5% over the last three session.

The gains followed talk that China had purchased 200,000 tonnes of wheat from France, rumoured to be for delivery between August and October.

Grain prices as of 12:00 Chicago time (18:00 UK time)

Chicago wheat (July): $7.05 ½ a bushel, (+2.6%)

Kansas wheat (July): $7.38 a bushel, (+2.6%)

Chicago corn (December): $5.59 ½ a bushel, (+1.6%)

Paris wheat (November): E199.75 a tonne, (+1.5%)

London wheat (November): £170.05 a tonne, (+1.2%)

Chicago soybeans (November): $13.03 ¼ a bushel, (+1.1%)

"That seems to be what is behind the rise," said Dustin Johnson at Illinois-based broker EHedger.

While the purchase by China of French wheat, an unusual trade, was viewed by many traders as underlining the non-competitiveness of US wheat, typically a preferred destination for Chinese buyers, the deal was seen potentially setting the scene for further deals.

In May, China was said to be looking for 2m-3m tonnes of wheat for state inventories.

Chinese buyers have separately been rumoured to be interested in US purchases, talk enhanced by Chicago wheat's fall below $7 a bushel to levels which have previously whetted their interest.

'Historically-high May temperatures'

As a further support for wheat prices, Lanworth cut by nearly 1.3m tonnes, to 693.0m tonnes, its forecast for world wheat production in 2013-14, with a downgrade to the nascent Ukrainian harvest offsetting upgrades to some other origins, including Australia.

Lanworth 2013-14 wheat forecasts and (change on previous)

World harvest: 692.95m tonnes, (-1.27m tonnes)

Australian harvest: 24.90m tonnes, (+100,000 tonnes)

Russian harvest: 51.70m tonnes, (+900,000 tonnes)

Ukraine harvest: 19.10m tonnes, (-1.40m tonnes)

World carryout inventories: 178.99m tonnes, -810,000 tonnes)

"Historically-high May temperatures will hold production well below the recent high of the 2008-09 season of 25.9m tonnes," Lanworth said, pegging the crop at 19.1m tonnes.

"Outlooks indicate continued warm and dry conditions through late June."

The estimate for the Australian wheat crop was nudged higher to 24.9m tonnes, after "recent and expected increases in June precipitation in key production areas of the eastern and southern wheat regions reduced the likelihood of lowered plantings and yield".

US corn downgrade

Lanworth also cut its estimate for the world corn harvest by 4.2m tonnes to 956.7m tonnes, reflecting a cut of 4.3m tonnes to 346.0m tonnes (13.6bn bushels) in the forecast for the US crop, the world's biggest.

Lanworth 2013-14 corn forecasts and (change on previous)

US yield: 156.7 bushels per acre, (-2.1 bpa)

US area: 95.334 acres, (unchanged)

US harvest: 13.642bn bushels, (-148m bushels)

US carryout inventories: 39.78m tonnes, (-2.27m tonnes)

World harvest: 956.74m tonnes, (-4.23m tonnes)

World carryout inventories: 139.54m tonnes, (-1.97m tonnes)

The downgrade reflected an estimate of 95.3m acres in the forecast for US sowings, a figure some 2m acres below the US Department of Agriculture estimate, which stands to be upgraded by a much-anticipated plantings report on June 28.

Lanworth pegged the yield at 156.7 bushels acre as "widespread above average precipitation continues to lower the probability of extreme drought in western production areas".

The consultancy, which uses satellite imagery to a large part in its forecasts, acknowledged that the wet weather "raises the probability of yield loss in eastern production areas should high precipitation continue during June- August".

Informa downgrades too

The revisions came shortly before analysis group Informa Economics cut its forecast for US corn acres, by 1.6m acres, also to 95.3m acres.

Informa US crop estimates and (change on previous)

Corn sowings: 95.262m acres, (-1.565m acres)

Soybean sowings: 77.756m acres, (-530,000 acres)

Spring wheat sowings, ex-durum: 11.791m acres, (-610,000 acres)

"They look to have it spot on, although some people may be disappointed," EHedger's Dustin Johnson told Agrimoney.com, noting some markets forecasts of the loss of 4m acres to damp.

However, another US analyst told Agrimoney.com: "Informa is known for being conservative. I think the market will take this in its stride.

"It could even be a bit positive for prices, given how Informa is perceived as being a little reluctant to make downgrades."

Informa also cut its estimate for spring wheat plantings, excluding durum, by 610,000 acres to 11.8m acres.

The forecast for soybean acres was cut by 530,000 acres to 77.8m acres.

See the original article >>

Bernanke Spells "Recovery" F-A-I-L-U-R-E

by Phoenix Capital Research

We’re now five years into the worst recovery in the post-WWII period.

Based simply on historical business cycles, we should already be out of recovery and into a “growth” stage for the US economy. This should have happened even with barely any stimulus from the Fed.

Instead, the Fed has spent TRILLIONS of Dollars and failed to deliver anything resembling economic growth. The number of people who are of working age who are actually working has barely budged since the 2009 low.

In plain terms, this chart shows us point blank that all the talk of “unemployment falling” is total BS. The Feds simply alter their methodology to make the employment picture look better, but that doesn’t change the fact that jobs have not and are not coming back in any meaningful way.

During this period, we had QE 1, QE 2, Operation Twist 2, QE 3 and QE 4. Where in the above chart do you see any real improvement in jobs as a result of these efforts? What data is the Fed looking at when it talks about “recovery” (other than the stock market and housing market which are once again bubbles)?

It’s not as though stocks rallying so high is a great thing either. The S&P 500’s CAPE predicts at best a 4% annual return for stock investors over the next 20 years.

If you’re unfamiliar with CAPE it is the cyclically adjusted price-to-earnings ratio.

In simple terms CAPE measures the price of stocks against the average of ten years’ worth of earnings, adjusted for inflation.

The reason you use the average earnings over 10 years is due to the business cycle. Typically the US experiences a boom and bust once every ten years or so.

By using the average earnings over a ten-year period, you smooth out your earnings data to account for both booms and busts. As a result you get a much clearer measure of a business’s profits, which is the best means of valuing that business’s worth.

CAPE is better at predicting stock market returns than P/E, Government Debt/ GDP, Dividend yield, Fed Model, and many other metrics commonly used by analysts (most of which really predict much of anything).

This is not to say that stocks can’t go even higher than they are today. Bubbles, such as the one we’re experiencing today, can often last longer than anyone expects.

However, based on over 100 years’ worth of data, anyone who is looking to invest for the long term by buying the market today can expect, at best, a 4% real return per year over the next 20 years (this includes both dividends and capital appreciation after inflation).

Today the S&P 500 has a CAPE of over 22. This means the market as a whole is trading at 22 times its average earnings of the last ten years. It’s also definitively in bubble territory.

Folks, QE does nothing but create stock bubbles. Nothing at all. The US economy isn’t in “recovery” which is extraordinary because historically even if the Fed had done NOTHING we’d already be in recovery. The fact that the Fed has spent TRILLIONS of dollars and is still talking about a weak recovery only shows that the Fed doesn’t actually have the tools (or know how) the improve the economy… or jobs.

We all know how bubbles end, with a bang. This one will be no different from the last three.

On that note, we’ve just released a FREE Special Report outlining how to protect your portfolio during times of a market collapse. It outlines the best stocks to own during a crisis as well as how to take out “insurance” on your portfolio.

See the original article >>

3-Pitfalls To Fed's Tapering

by Lance Roberts

Had a good discussion yesterday with Greg Robb at WSJ Marketwatch discussing various pitfalls that the Fed will face when trying to slow injections of stimulus into the financial markets. The article below is from Greg and he did a nice job coverting the issue. However, one pitfall that I think is missing is the inherent "liquidity trap" that as I discussed previously (see here and here) could wind up being a much larger issue than anticipated in the not so distant future.


WSJ MARKETWATCH

June 18, 2013

By: Greg Robb

It has become fairly clear after all of the talk and turbulence surrounding the Federal Reserve's policy meeting that the central bank wants to pull back on its easy policy stance if it can.

"Market participants have come to accept that the Fed is not going to purchase securities ad infinitum and that the wind-down process will probably be implemented later this year," said Ward McCarthy, chief financial economist at Jefferies & Co.

As the Fed starts its two-day meeting, questions arise over how the Fed should handle tapering its quantitative-easing program and what's in store.

Odds that the Fed would increase the size of its $85 billion-a-month asset purchase plan are now seen as very low. Read preview of Fed's meeting.

But there are a few potential pitfalls that could damage the economy and force the central bank to reverse course, some analysts say. Here are three of them: debt ceiling, deflation and a spooked market.

Debt ceiling

The last stand-off between congressional Republicans and the White House over the debt ceiling in 2011 sent stocks down 20% and pushed down GDP growth by almost a full percentage point, noted Lance Roberts, chief economist of Street Talk Advisors in Houston.

So it is hard to imagine that the Fed will reduce the pace of purchases, "at least not going into" the next debate on the debt ceiling this fall, he said.

Recent good news on the deficit has pushed the timing of this year's debt ceiling clash into October, before a rough deadline in November, said Sean West, head of Eurasia Group's U.S. practice.

Despite some rough talk expected over the summer, the conventional wisdom is that the two sides will avoid a default or a crisis.

"Both parties have signaled that they see little benefit in actually playing chicken with the debt ceiling, though both sides will play hard ball in advance of the deadline, West said.

"This has the lowest potential for a meltdown," West added.

With the conventional wisdom not expecting a show down, any hardening of attitudes as the deadline gets closer could be a "negative surprise," West said. So it would be a "negative surprise" if the risks of no deal rise in September, he noted.

Low inflation

Inflation remains below the Fed's 2% target.

The core consumer price index is up just 1.7% year-on-year in May. The central bank's preferred measure, the index for personal consumption expenditures, is up only 0.7%.

Economists disagree about the causes of the low-inflation trend, which has been in place since the Fed started its latest bond-buying program last September. Some think inflation will bounce back later this year, others are not so sure.

St. Louis Fed President James Bullard has said that low inflation has been a surprise and can allow the Fed to keep up QE3.

McCarthy of Jefferies said that the Fed might actually have to increase the pace of purchases to combat low inflation.

Market correction

One last worry is that the Fed will spook markets with discussion about how fast it might exit from its ultra-easy policy stance.

"Another banana peel is the Fed might tell the market too much and panic the market into a bigger selloff," said Roberts of Street Talk. "The QE rally could come to a quick and sharp end," Roberts said. Consumer confidence would deflate, which could dampen growth, he added.

See the original article >>

Three Picks For Bond Sellers

by Tom Aspray

Stocks put in another good performance on Tuesday as the market was acting well heading into the widely anticipated FOMC announcement and Bernanke press conference. The short-term downtrends in the Advance/Decline lines have now been broken suggesting that the correction is over.

Rates were higher on Tuesday making further outflows from bond funds likely as we head into the summer. This is consistent with more gains for stock holders and more nervous times for bond holders.

Though overall volume has been light, both the weekly and daily OBV are positive for the Spyder Trust (SPY), as well as the PowerShares QQQ Trust (QQQ). The confirming OBV signals are a positive for the market but that does not rule out more choppy and volatile trading. The action this afternoon could be wild.

It looks as though the technology sector and small-cap sectors are ready to lead the market higher. I have three picks that look like they should be part of all portfolios, especially those that have lots of cash.

chart
Click to Enlarge

Chart Analysis: The Spyder Trust (SPY) shows that the June 10 highs were overcome on Tuesday’s close.

  • There is next resistance for SPY at $166.59 and then at $167.78.
  • The all-time high is at $169.07 with the weekly starc+ band now in the $172 area.
  • The downtrend (line a) in the NYSE Advance/Decline line has been broken, and it is above its WMA.
  • There is good support now at the uptrend, line b.
  • The McClellan oscillator has broken its downtrend, line c, and according to Reuter’s data made lower lows last week.
  • Two other data sources reflect higher lows but all show completed short-term bottom formations.
  • The 20-day EMA is now at $163.91 with the monthly pivot at $163.54.
  • More important support for SPY at $161.30 to $160.35.

Wal-Mart Stores Inc. (WMT) was a favorite profitable pick early in the year and the stop on the remaining position was just hit at the end of May. It has a current yield of 2.5%.

  • The weekly and daily charts show bottoming formations as WMT dropped between the 38.2% and the 50% support level at $73.55.
  • This typically sets up good buying opportunities for stocks that are in major positive trends.
  • The daily chart also shows that an HCD was triggered with Tuesday’s close.
  • The relative performance is holding above its recent lows and a break of the downtrend, line d, would be positive.
  • The daily OBV has turned up from support at line e, and is back above its WMA.
  • A close above the recent weekly highs at $76.65 and $76.87 would be a further sign that a bottom was in place.

chart
Click to Enlarge

PowerShares QQQ Trust (QQQ) tested the support in the $71.50 area (line a) twice this month and then closed just below the swing high at $73.82 on Tuesday.

  • There is additional resistance at $73.76 and then at $74.54.
  • Once above the May high at $74.93 the 127.2% Fibonacci target is at $75.89.
  • The Nasdaq 100 Advance/Decline has already completed its bottom formation.
  • The A/D line has broken its downtrend, line b, and moved above its previous high.
  • The OBV (not shown) is above its WMA but still below the previous high.
  • There is short-term support now at $72.82 and the monthly pivot.

Intuit Inc. (INTU) was hit hard in April when it lowered its guidance but it had traded as high as $68.41 in March.

  • INTU now appears to be holding the 38.2% support at $57.21.
  • The spike low in April was $55.54.
  • The relative performance is trying to bottom out, line f, with key resistance at the long-term downtrend (line e)
  • The OBV has been in a strong uptrend, line h, since late April.
  • The OBV is now very close to breaking its downtrend, line g.
  • There is next resistance for INTU at $59.71 and then at $60.98.

What it Means: The daily technical indicators suggest that the worst of the selling is over, though the wild card for today is obviously the Fed. Any selling in reaction to the FOMC is likely to be short lived as the action in the PowerShares QQQ Trust (QQQ) and iShares Russell 2000 Index (IWM) is quite bullish.

All three of these picks look attractive and Wal-Mart Stores Inc. (WMT) has a higher yield than the 10 Year T-Note.

How to Profit: For Wal-Mart Stores Inc. (WMT), go 50% long at $75.51 and 50% long at $75.12, with a stop at $73.14. (risk of approx 2.9%).

For PowerShares QQQ Trust (QQQ), go 50% long at $72.84 and 50% long at $71.88, with a stop at $69.28 (risk of approx 4.3%).

For Intuit Inc. (INTU), go 50% long at $58.43 and 50% long at $57.78, with a stop at $55.31 (risk of approx 4.8%).

Portfolio Update: Longs in the ProShares UltraShort S&P 500 (SDS) from $39.55 were stopped out at $38.93 for an approximate loss of 1.6%.

See the original article >>

"Fed In A Box" - Vince Reinhart's FOMC Probability Matrix

by Tyler Durden

Since the only topic on everyone's mind until 1:59:59:9999 pm today (excluding those who have been leaked the FOMC decision in advance of course) will be what the Fed will do, here are some additional perspectives from former FOMC secretary and economist Vince Reinhart (currently at Morgan Stanley), who believes nothing happens today as the Fed has "boxed" itself in, and his Fed Statement Probability Matrix.

But first, here is why to Reinhart, the Fed is (has been, continues to be) in a box:

Here is the box Fed officials have made for themselves. They have to continue the language that they are willing to increase or decrease monthly asset purchases, as it is evidence of their data-dependent flexibility. But if the only new data point is that inflation fell and risks becoming unanchored, it would seem odd to decrease purchases right away. Not acknowledging the inflation fall, thereby ignoring a yawning shortfall from their dual mandate, risks ridicule.

The solution is likely to be an unsatisfying combination of admitting the inflation result, asserting that inflation expectations remain anchored, and repeating that QE is a flexible tool. Indeed, expect Chairman Bernanke to be painfully evenhanded toward QE. This may make it seem like they are ready to start tapering imminently. Not so. Look for even more talk first. They need to roll out their revised exit strategy, probably working through the argument at the semiannual monetary policy hearings, and see that inflation settles down. This puts QE in play for the September meeting at the earliest, and if our forecast eventuates, subdued inflation could stay the Fed’s hand even longer.

And the probability matrix: "The table below provides some possible wording language, starting from
the words of the May statement that may be in play. Strikeouts indicate
deletions and bold face indicates insertions."

See the original article >>

Crude Oil Prices Start to Breakout

By: Donald_W_Dony

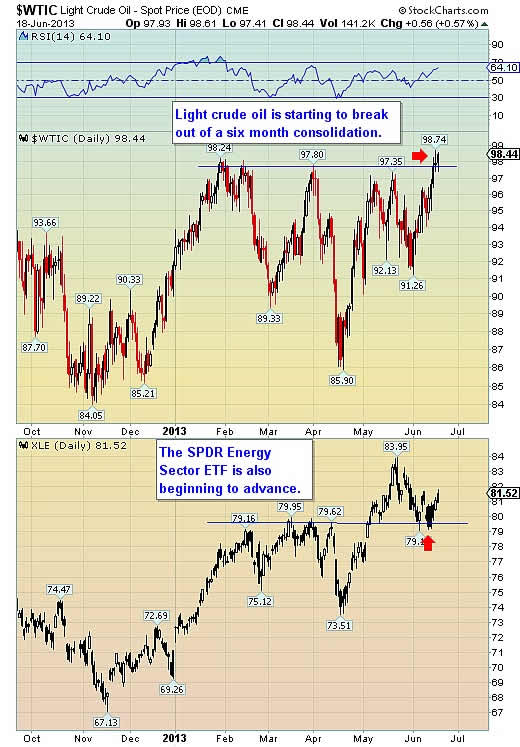
Energy stocks, which usually front run the underlying oil, are also displaying a more positive tone. Having broken above the resistance line of $79.50 in May, the SPDR Energy Sector ETF has now completed its pull back in early June and is now starting to rebound.
Energy companies such as Emerald Oil Inc. (EOX), Newfield Exploration (NFX) and Marathon Oil (MRO) look particularly positive on the sector advance.
Bottom line: The energy sector (XLE) is suggesting that the breakout in Light crude prices will continue. It also indicates that traders believe that world economies will remain upbeat in the second half of 2013.
Once WTI moves over $99, then the project target will be $115.

See the original article >>

Sudden stock crashes usually caused by human error, SEC says

By Sam Mamudi

Concern that American stock markets have become more susceptible to split-second crashes due to computerization isn’t supported by the data, a Securities and Exchange Commission official said.

Most “mini-flash crashes,” a term sometimes applied when an individual U.S. stock briefly surges or plunges for no obvious reason, are the result of human errors, not broken software, said Gregg Berman, head of the SEC’s Office of Analytics and Research.

Scrutiny of market disruptions increased in the wake of malfunctions including the flash crash of May 2010, when the Dow Jones Industrial Average fell almost 1,000 points in minutes before rebounding. In September, the Senate Subcommittee on Securities, Insurance and Investment held hearings on the impact of computerized trading amid concern algorithmic and high- frequency strategies are contributing to investor uncertainty.

“A popular meme has emerged that, taken collectively, sudden price spikes indicate a broken market” and may be harbingers of another crash like the one in 2010, Berman said in New York today at a conference sponsored by the Securities Industry and Financial Markets Association. Critics who blame everything on electronic trading “may be looking in the wrong place,” he said.

Princeton Physicist

SEC staff found that swings in individual stocks are more often caused by human mistakes such as “fat finger” trades -- when a person enters the wrong number of shares to trade or some other typographical error -- or incorrectly entered limit orders, Berman said. While the errors reflect sloppiness and highlight a lack of checks, they can be fixed by better risk management and oversight, he said.

Berman, who trained as a physicist at Princeton University, was appointed to his SEC post in January. He joined the agency in 2009 from RiskMetrics Group and led the development of Midas, the SEC’s system for examining the U.S. stock market.

Sudden stock swings have spurred fluctuations in the paper value of some of America’s biggest companies. On May 17, shares of Anadarko Petroleum Corp., which had a market value of $45 billion at the time, briefly plunged 99 percent in the final minute of trading. Most of the transactions were later voided.

A week later, NYSE Euronext let stand trades that sent American Electric Power Co. and NextEra Energy Inc. down at least 54%, while labeling them “aberrant” and excluding them from records showing the stocks’ lows of the day.

Bigger Moves

While crashes may be started by humans, today’s market structure means mistakes are more likely to snowball rapidly, said Sal Arnuk, a partner at Themis Trading LLC and a frequent critic of the way markets have evolved.

“I would ask Mr. Berman, how can you explain or justify that a large-cap or very liquid stock, when there is a fat- finger trade, sees the market widen out as much as it does,” Arnuk said in a telephone interview. The current structure of markets “is set up to extract the most amount of pain from any mistake.”

A study published by Credit Suisse Group AG on Jan. 17 found that few sudden swings are directly attributable to computer errors.

Ana Avramovic, an analyst at Credit Suisse Trading Strategy, examined mandatory halts prompted by volatility in individual stocks between June 2010 through December 2012. After excluding “extremely illiquid or cheap stocks,” she found that 85 percent were caused by news and 9 percent by human error.

Latency Arbitrage

Only 6% -- or 21 instances in 31 months -- were caused by a bad print, when a quote at an extreme price caused a halt, suggesting a computer algorithm was responsible.

Recent research from the University of Michigan explored another point of contention regarding high-frequency trading: whether investors generally benefit from the practice.

The report found that while a technique known as latency arbitrage -- in which traders exploit delays in sending market data among the 13 exchanges and about 40 alternative venues in the U.S. -- enriches some firms, overall market efficiency is harmed “with no countervailing benefit in liquidity or any other measured market performance characteristic.”

Berman said today that while the SEC continues to study computer trading, other measures should limit human mistakes. He highlighted the proposed Regulation Systems Compliance and Integrity, which seeks to limit technology breakdowns at venues handling stocks, options and bond trades and ensure they can withstand malfunctions that could jeopardize markets.

Risk Checks

Another initiative, the market-access rule adopted in 2010, requires risk checks on any order sent for execution. The two together are a message to market participants and venues to improve, Berman said.

In remarks to the Sifma audience, Berman also questioned critics who suggest computers have made buying and selling stocks too fast for the good of the market. He said the SEC’s analysis will look at the speed of trades, and he will reserve judgment until it’s complete.

“I’m not sure why, absent other facts, it should be a concern that trading take place faster than a blink of an eye,” he said.

See the original article >>

3 Reasons to Buy Stock Even Near All-Time Highs

By Dan Caplinger

Investing in stocks has been a smart long-term move, but as the market has climbed to successive record highs, many investors have questioned whether it's still smart to buy stock now. Below, you'll find three solid reasons that you should still buy stock even when the market is soaring. Let's take a look at them.

1. Stocks have a better risk-reward ratio than alternatives.
The increased volatility in the stock market in recent weeks has made many stock investors reflexively turn to alternatives in search of a smoother ride for their portfolio. Yet when you take a closer look, you'll see that in this latest episode of market choppiness, stocks have actually been less volatile than some investments that many see as being more secure.

For instance, most investors turn to bonds in times of trouble. In recent months, though, soaring interest rates have soared, pushing bond prices downward much more dramatically than stocks. Major bond ETF iShares Core Total US Bond Market (NYSEMKT: AGG ) has plunged to 52-week lows in the past week, and some more aggressive bond ETFs have suffered double-digit percentage declines in value just from the thus-far modest run-up in interest rates. With the upside from bonds fairly limited and that level of risk, using new money to buy stock makes more sense for those seeking a more attractive risk-reward proposition.

2. Some stocks will rise or hold up well even in a downturn.
In times of trouble, investors tend to look at the stock market as a cohesive unit. Yet while correlations exist that make stocks tend to trade in tandem, strong companies can withstand or even benefit from the tough conditions that pull the overall market lower, and buying their stock can be profitable as a result.

For instance, five years ago, the financial crisis hit banking stocks hard, but it was the overall recessionary conditions that helped bring the entire market down. Some companies, though, made the most of the recession and gained ground. McDonald's (NYSE: MCD ) , for instance, benefited from the move away from more expensive casual restaurants, meeting customers' needs with expanded menu offerings that still offered solid value for those who'd moved down from other eating-out options. Similarly, Family Dollar (NYSE: FDO ) and several other deep-discount retailers poached business from higher-cost alternatives as households cut their budgets.

I'm not saying that McDonald's and Family Dollar will necessarily be winners in the next downturn, because current conditions are much different and each company faces new challenges that could hold them back. But whatever drives the next market correction or bear market, there'll be some industry or company in a position to profit from it, and looking closely at the cause of the correction will yield some good investment ideas.

3. Companies have put measures in place that should help earnings for years to come.
Many concerned investors have pointed to high profit margins as potentially being unsustainable. They argue that as a result, it doesn't make sense to buy stock at current levels and that you should wait to invest until what they see as the inevitable reversion of corporate margins to more historically normal levels.

Yet this analysis ignores the long-term improvements that companies have made to boost profits. Perhaps the most notable is the locking-in of cheap long-term financing, as companies have taken advantage of low interest rates to get the cash they need not just now but well into the future. Some of the largest and most creditworthy companies in the economy, including Microsoft (NASDAQ: MSFT ) and Wal-Mart (NYSE: WMT ) , have turned to the debt markets to raise capital not out of need but rather as an opportunistic strategy to minimize their long-term funding costs. Such moves will help keep margins higher even when interest rates rise, as those companies with enough foresight to get long-term financing will reap the benefits for years or even decades to come.

Don't give up
It's understandable to be reluctant to buy stock when the prices are high. But by being discriminating with your purchases and focusing on positioning your overall investment portfolio as well as you can, you'll find that the reasons to buy stock outweigh the reasons to keep your money elsewhere over the long run.

Of course, long-term success often comes with short-term bumps in the road. For instance, after its sterling performance in 2008, McDonald's turned in a dismal year in 2012, underperforming the broader market by 25 percentage points. Looking ahead, can the Golden Arches reclaim its throne atop the restaurant industry, or will this unsettling trend continue? Our top analyst weighs in on McDonald's future in a recent premium report on the company. Click here now to find out whether a buying opportunity has emerged for this global juggernaut.

See the original article >>

The Only Thing Certain About Today’s Fed Meeting

by Graham Summers

The Fed will announce its moves today at 2PM.

There’s really no telling what will happen. The markets have become truly schizophrenic. For instance, stocks continue to rally as though more QE is coming.

However, Gold, which has lead stocks into every major Fed program, continues to fall…

Moreover, Treasuries continue to fall, which indicates that less bond buying is coming…

In simple terms, the markets are all over the place. Some assets are forecasting tapering, some aren’t. It’s really a toss up.

The Fed is known to leak key information to insiders, so for certain “someone” will know before the rest of us.

See the original article >>

Why Vale Has Yet to Bottom

By Matt Smith

With the world’s largest iron ore miner Brazil’s Vale (NYSE: VALE) now trading at lows not seen since 2007, many investors are convinced that now is the time to invest in the company. For the year to date the company’s share price is down by almost 33%, having recently touched a new 52-week low of $14.20. However, it is not only Vale that has taken a beating, all of the major iron ore miners including Cliff Natural Resources (NYSE: CLF), BHP Billiton (NYSE: BHP) (NYSE: BBL) and Rio Tinto (NYSE: RIO) have seen their share prices plunge. The key drivers of this selloff have been a declining iron ore price along with lower economic growth in China and in this article I will explain why investors should be cautious about investing in Vale.

The performance of iron ore miners is closely linked to the outlook for China and the iron ore price and this is particularly so for Vale the world's largest iron ore miner and Cliff's, with both receiving in excess of 70% of their revenue from iron ore. Whereas Rio and BHP are diversified miners with operations producing a range of commodities making their sales and profitability far more sustainable in the current environment.

China’s economic outlook continues to decline

A key driver of demand and pricing for iron ore and hence the share price of iron ore miners, has been the overwhelming demand for the commodity from China as the chart illustrates.

Source data: National Bureau of Statistics of China and Bloomberg.

The rapid growth of China's economy and the ensuing demand for commodities saw the creation of what has been called a resources super-cycle, triggering a boom across the mining industry globally, seeing record profits and investment. But this boom has now come to an end and while there will continue to be demand for iron ore and other commodities globally, there will be no return to the heady highs of iron ore prices reaching almost $190 per metric ton. This is because China’s economy has continued to slow with GDP growth estimated to be 7.8% in 2013, 7.9% in 2014, and 7% in 2015, which are significantly lower than the historical Chinese growth rates needed to drive iron ore prices higher.

Latest economic data indicates that demand for iron ore will continue to fall

The latest economic data from China indicates an increasingly likelihood that demand for iron ore will not significantly increase any time soon, with the May 2013 manufacturing PMI increasing by a modest 20 bps month on month to 50.8%, as illustrated by the chart below.

Source: National Bureau of Statistics of China.

This doesn’t bode well for increased industrial demand for commodities such as iron ore and I don’t expect to see any significant growth in China’s industrial PMI over the short-term.

All of which has already applied downward pressure to the iron ore price, seeing it fall by 23% for the year to date to $116.60 per metric ton and over the long-term I expect the price to fall further to around $90 per metric ton. All of which doesn’t bode well for increasing demand for iron ore or the profitability of Vale.

Shareholder remuneration remains under pressure

It is likely that as Vale's profitability declines it will continue to cut its dividend payments. Already for 2013 Vale has cut its dividend payment by a third, reducing its dividend yield to around 5%. This yield is superior to Rio`s and BHP's 4% and Cliff's 3%, although I don't expect the same degree of pressure to be applied to either Rio's or BHP's dividend payment as iron ore prices continue to fall. This is because both miners have diversified operations, with only a third of their revenue being derived from iron ore.

Just how cheap is Vale at this time?

At this time Vale appears to be particularly cheap with a price to book ratio of 2 and an enterprise value to EBITDA ratio of 6. But as the table below illustrates, both Cliff's and Rio appear to be far better value on the basis of those metrics.

Source data: Yahoo Finance, Y Charts and Fidelity.

Furthermore, while I am confident that BHP and Rio can continue to grow profitability in an environment where iron ore prices are continuing to fall by virtue of their diversified operations, I do not believe that Vale or Cliff's can. This is because of the significant dependence on iron ore sales as a driver of revenue.

The impact of the falling iron ore prices on Vale's financial performance can already be seen in the company's first quarter 2013 performance, with revenue falling by almost 33% quarter on quarter to $10 billion. While net income more than doubled for the same period to almost $3 billion. The almost doubling in net income, despite appearing to be a solid achievement, did not occur because of decreasing costs or increasing profitability but can be primarily attributed to asset write downs that saw the company report a loss in the fourth quarter 2012.

Risks remain high for Vale

Vale also continues to remain a far higher risk play for investors than either Rio or BHP, with the company still experiencing problems associated with the shipping costs and times to reach China. Vale is also exposed to increasing political and economic risk in Brazil, with the Rousseff government having defined iron ore as a strategic asset and continuing to pursue Vale for $15.5 billion in additional income taxes that it claims are due on the profits of Vale's foreign subsidiaries.

Neither Rio, BHP or Cliff's are exposed to such a high degree of political and economic risk in the countries in which they are domiciled or where they have the majority of their iron ore operations. I also expect to see Rio and BHP continue to cut costs through extensive restructuring operations and the economies of scale available in their operations in north-west Australia.

Bottom line

It is clear that demand for and the price of iron ore price will continue to fall on the back of slowing economic growth in China. This will have a significant impact on Vale’s sales growth and profitability given its significant reliance upon iron ore as a driver of revenue, which may further pressure its ability to pay its dividend. As a result I don't believe that Vale's share price has bottomed and that the other diversified miners are better investment opportunities for investors seeking exposure to the sector.

See the original article >>

Why It Would Be Foolish to Sell Your Stocks

By Justin Carley

Justin is a member of The Motley Fool Blog Network -- entries represent the personal opinion of the blogger and are not formally edited.

The market has pulled back from its recent highs, and investors have begun to talk about bubbles in several asset classes. Long-term investors should stay focused on the key trends that can move markets, as opposed to scary headlines and political commentary. Two crucial facts make investing in U.S. stocks a compelling opportunity for patient, long-term investors: demographics and the performance of bonds.

The Bull Market in Bonds has Ended?

David Rosenberg, Chief Economist & Strategist with Gluskin Sheff, has been particularly accurate regarding the direction of U.S. Treasury yields and inflation during his entire career -- and he recently said that the bond bull market has ended.

This comes after Rosenberg correctly forecast a continuation of the bull market since 2009, while several prominent “experts” called for rising inflation and a collapse in bond prices. The end of the bond bull market doesn’t mean hyperinflation, which would be bad for stocks, but rather a gradual increase in rates. Rosenberg expects very modest movements upward in the long end of the Treasury curve -- nothing catastrophic, but enough to suppress the returns of fixed income assets. If he is accurate, this makes the relative return expectations for stocks all the more appealing.

Rosenberg recommends financial stocks during such a scenario. Banks will see increasing earnings from rising net interest margins, and life insurance companies will be able to sell product with higher margins. The Financial Select Sector SPDR (NYSEMKT: XLF) is one of the most popular ways to gain diversified exposure to the financial space. Its weighting includes 47% banks, 26% insurance, 12% REITS, 12% diversified financial companies, and 3% other.

The big boys in the insurance space will likely do well, but one concern is the large amount of buys from analysts in regards to Allstate, Metlife, Prudential Financial, Travelers, and Hartford Financial. It is much harder to outperform when expectations are already high.

Instead, an investor may favor Torchmark (NYSE: TMK) which has a lower percentage of buys than most of its life insurance peers. Torchmark is the low-cost provider of insurance to niche areas such as military, seniors and other relatively underserved groups.

The company has grown book value at a 9% compound annual growth rate, or CAGR, over the last decade, and its current price-to-book ratio of 1.4 is in-line with the industry average. Torchmark has also grown dividends at a five-year CAGR of 11.9%, the highest among life insurance companies with a market capitalization greater than $5 billion.

Demographic Destiny

For long-term investors, there are few things more important than demographics. One of the more important demographic stats is the ratio of people aged 35-49 relative to those aged 20-34.

Ned Davis Research has extensively studied the topic, and found that a rising ratio is good for the economy and stock prices. Per capita spending is higher for those in the 35-49 age group, as are their contributions to retirement goals. And increasing retirement contributions boosts demand for stocks.

The fact that baby boomers were hitting this key age segment was a big factor for the Great Bull Market from 1982-2000. For the U.S., this ratio is set to trough in 2015 and then increase for more than a decade. It should be noted that these forecasts are extremely accurate, as the births occurred 20-40 years ago.

The favorable demographics for stocks also apply to housing. The homeownership rate moves up significantly for the 35-49 age group. According to Ned Davis Research, the home ownership rate will increase by about 90 basis points from 66.7% to 67.6%. This doesn’t sound like much, but combined with other demographic tailwinds such as increasing families with stock ownership it could fuel a long sustainable rise in housing related equities. Home Depot certainly isn’t cheap with a price-to-earnings ratio of 24. There may be some consolidation and pullbacks following such a strong move, but the demographic forces will likely lead to a decade of strong earnings growth.

What about international opportunities? Japan just went through a severe decline in this demographic ratio, which served as a headwind to a 25-year bear market. This ratio is set to rise through 2020, though, and it may be the cause for a new secular bull market in equities. iShares MSCI Japan Index (NYSEMKT: EWJ) is one of the more popular options available. The fund has deep liquidity and offers diversified exposure to more than 300 Japanese companies.

Japan has been front and center with its current monetary and fiscal stimulus. The country has witnessed an 80% surge in the stock market, only to see it immediately crash 20%. Investors should expect significant volatility in the near term if investing in Japan.

Those concerned with currency movements may find the Wisdom Tree Japan Hedged Equity Fund (NYSEMKT: DXJ) a better alternative, as it attempts to offer equity exposure while simultaneously hedging currency risk. Three big markets where the demographics are set to become a headwind include China, the United Kingdom, and Germany.

The Foolish Bottom Line

The stock market doesn’t move in straight lines, and sentiment will ebb and flow. Next to the valuation of the stock market, (which is reasonable in the context of low inflation) the performance of alternative asset classes and demographic forces might be two of the most important factors for long-term performance. The U.S. stock market is positioned to do very well if bond returns turn negative and demographic forces take root.

See the original article >>

Your Last Remaining Edge on Wall Street

By Morgan Housel

Wall Street's edge over you seems to tighten by the hour. Insider trading is rampant. High-frequency traders can see your trades before they're even executed. CNBC reported last week that Thompson Reuters sells the results of consumer confidence reports to select professional investors as little as half a second before the data is made public -- that's all they need to gain an edge.

"Why shouldn't I just give up?" a reader emailed me last week.

I'll tell you why.

Individual investors have a giant advantage over professional investors, and they might not even know it.

What is it? Time.

You're trying to fund your retirement over the next 20 years. Hedge fund managers have to woo their clients every month. You're saving for your kids' education next decade. Mutual fund managers have to fret about the next quarter. You can look years down the road. Traders have to worry about the next ten milliseconds.

Most professional investors can't focus on the long run even if they want to. As Henry Blodget put it:

If you talk to a lot of investment managers, the practical reality is they're thinking about the next week, possibly the next month or quarter. There isn't a time horizon; it's how are you doing now, relative to your competitors. You really only have ninety days to be right, and if you're wrong within ninety days, your clients begin to fire you.

I'm a long-term investor. I'm not going to fire myself because of a bad quarter. The fact that you and I don't have to play these insane short-term games is the last remaining edge we have over Wall Street. And frankly, it's enormous.

The biggest risk investors face is losing money between now and whenever they'll need it (retirement, school, etc.). The good news for you -- and bad news for Wall Street -- is that the odds of losing money drops precipitously the longer you're invested for.

I took monthly S&P 500 (SNPINDEX: ^GSPC ) prices going back to 1871, adjusted them for inflation an dividends, and looked at returns based on various holding periods.

Holding stocks for less than a year amounts to little more than flipping a coin. You are almost as likely to lose as you are to win.

But the odds of success grow perfectly with time. If you hold for five, 10, 15 years or more, the odds of earning a positive return on stocks after inflation quickly approach 100%, historically.This chart shows the percentage of holding periods that generated positive returns:

Source: Robert Shiller, author's calculations. 1-day returns since 1930, via S&P Capital IQ.

The irony is that while Wall Street has more information than you, its short time horizon forces it to deal with more randomness than you have to. That's your edge. And it's why any bumpkin who buys an index fund and forgets about it will beat the vast majority of professional money managers over time.

Here's another way to look at this. This chart shows the maximum and minimum annual returns someone would have earned between 1871 and 2012 based on different holding periods:

Source: Robert Shiller, author's calculations.

Hold stocks for a year (Wall Street's territory) and you're at the mercy of the market's madness -- maybe a huge up year, or maybe a devastating loss. Five years, and you're doing better. Ten years, and there's a good chance you'll be sitting on positive annual returns. Hold them for 20, 30, or 50 years, and there has never been a period in history when stocks produced an average annual loss. In fact, the worst you've done over any 30-year period in history is increased your money two-and-a-half fold after inflation. Wall Street would love to think about those numbers. Alas, it's busy chasing its monthly benchmarks.

You have the opportunity to focus on the long term. The question is, Will you?

See the original article >>

Building Out a Foundation

by Marketanthropology

In what's become a rather humid terrarium of overgrown expectations for game theorists worldwide - the Fed renders an official opinion today and perhaps a few words of color commentary.
Considering the verdict - or not, we continue to find more markers of a build in foundations for the precious metals sector and a loosening of stratum in the US dollar index. While the dollar took the exit fractal we had cautioned it could, the precious metals sector has begrudgingly slouched down a one way street - in what's become a common characteristic around the hub of this markets infrastructure. Be that as it may, it has not shifted our market posture for the sector - in fact, has done quite the opposite. In our eyes, the actual momentum wave and duration for the cascade has counter intuitively moved the needle progressively bullish in our opinion.
With that said, and derivative of our work with Apple and oil circa 2008; silver is starting to build out a promising low, that although took the gradual route - is reminiscent of copper's pivot in the first quarter of 2009.
The takeaway: It may take some time to turn silver staunchly higher - but we think it may just be worth the wait.

See the original article >>

Follow Us