Monday, January 31, 2011

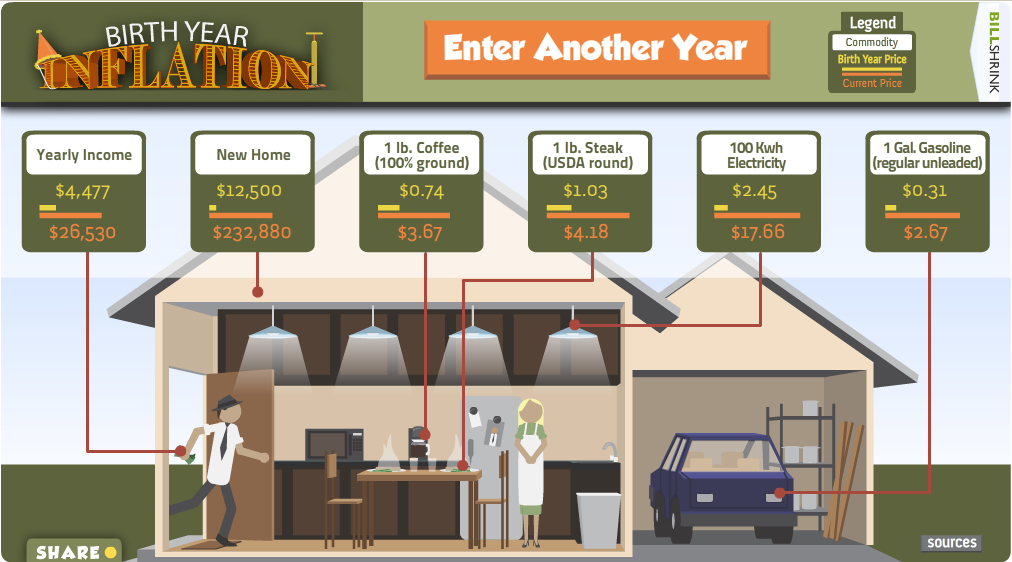
Inflation Rates vs Your Birth Year

by The Big Picture|Barry Ritholtz

This is fun: Enter the year if your Birth, and see what various items cost vs today:

click for interactive graphic


Here’s mine:


Continue

Seculators cut bullish positions in all metals

By Debbie Carlson

(Kitco News) - Speculators cut bullish positions in all the U.S. metals futures markets in the week ending Jan. 25, according to data released late Friday from the Commodity Futures Trading Commission.

In its weekly commitment of traders report for futures and options combined, the CFTC showed speculators in both the disaggregated and legacy reports reduced gross long positions across the precious and base metals. Morgan Stanley noted precious metals’ prices spent most of the week under pressure until Friday’s rally because of civil unrest in Egypt.

During the timeframe covered by the report, front-month April gold futures on the Comex division of the New York Mercantile Exchange fell $36.10 an ounce, settling Jan. 25 at $1,333.80. March silver dropped $2.107 an ounce, settling at $26.805.

The funds continue to chip away at their net-long positions in gold, with this week’s data the fourth straight week of declines. In the disaggregated report, managed-money accounts are now net-long 129,664 contracts as they cut 1,993 gross longs and added 2,817 gross shorts. Producers and swap dealers cut exposure on both sides in gold but cut more gross shorts than longs, reducing their net-short position.

As in the disaggregated report, funds in the legacy report cut gross longs and added to gross shorts. The non-commercials cut 9,337 gross longs and added 4,269 gross shorts, leaving them net-long 175,828 contracts. Commercials carved out both gross shorts and longs, but significantly more shorts, dropping their overall net-short position. [..]

Continue reading this article »

Chicago PMI: Highest Level Since 1988

by Think BIG|Bespoke


This morning's report of the Chicago PMI for January was not only ahead of expectations (68.8 vs. 65.0), but it also came in at the highest level in over twenty years.  While the headline number was strong some of the sub-components were even stronger.  For example, Employment (64.1) was at its highest level since May 1984, while New Orders (75.7) haven't been this high since December 1983.
In the charts below we highlight the Chicago PMI headline index as well as its employment component going back to 1967.  Each chart shows a similar story of a sharp rebound, followed by a pause (last Summer's weakness) and a new leg higher.  With the employment component surging to multi-decade highs, bulls will no doubt anticipate strength in Friday's employment report. [..]


Copper eyes record high, demand hopes fuel gains

(Reuters)

LONDON - Copper came within touching distance of record highs on Monday as expectations of healthy demand from top consumers China and the United States boosted sentiment, despite a firmer dollar.
Tin hovered near record highs on worries about supplies from top exporter Indonesia.
Benchmark copper hit $9,722 a tonne, its highest since prices rose to an all-time high of $9,781 a tonne on Jan 19. The metal used in power and construction was trading at $9,695 a tonne at 1022 GMT from $9,635 on Friday. Investors have retreated from copper recently on expectations of a lull in activity because of a week-long holidays in China starting on Wednesday and on worries about tighter monetary policy in the country.
“Fears that China’s monetary policy would choke off economic growth have been overdone,” said Peter Fertig, a consultant at Quantitative Commodity Research.
“Even if China were to grow at a slower pace this year than last it would not change the picture, there would be a deficit.”
Markets expect another rise in Chinese interest rates in the first quarter. The country hiked rates twice and raised banks’ reserve requirements six times last year.
Traders say the market is waiting avidly to see the results of purchasing managers survey of manufacturing sectors in China and the United States on Tuesday.
The dollar has risen recently as investors sought safety in U.S. assets because of unrest in the Middle East.
Normally a higher U.S. currency would weigh on dollar-priced metals as it makes them more expensive for holders of other currencies, but so far this time, the market has ignored it.

RED HERRING

China accounts for nearly 40 percent of global copper demand estimated this year at around 21 million tonnes. The United States is the second largest consumer, accounting for about 15 percent of consumption.
“We anticipate accelerating economic growth in the U.S. at a similar level as seen in 2010, coupled with robust growth in emerging markets,” Swiss private bank Sarasin said in a note.
“This is likely to have a positive impact overall on the share prices of metals and mining companies.”
Aluminium, which is tracking copper, rose to two-week highs of $2,495 a tonne. The metal used in transport and packaging was at $2,482 a tonne from $2,472 on Friday.
Tin saw $30,000 a tonne, only $40 away from the record high of $30,040 a tonne seen on Friday. It was last at $29,800 a tonne from $29,600 on Friday.
Prices are up more than 10 percent so far this year. Last year the gain was nearly 60 percent. Behind the rise has been constraints on output in Indonesia.
“It started with Indonesia, but there is still a lot of momentum there,” a trader on the floor of the LME said. “If the funds pull the plug though, we could see a sharp correction.”
Lead was trading at $2,464 a tonne from $2,437 on Friday. The battery material has in recent weeks come under pressure from stocks in LME warehouses, which at 279,925 are at their highest since 1995.
But Macquarie in a note said: “We think that this stock build should be seen as a red herring rather than a red flag.”
“While the level of lead stocks in LME warehouses is at multi-year highs, total reported industry stocks in relation to the size of the market are not unusually high today.”
Zinc was at $2,355 a tonne from $2,354 and nickel at $26,900 from $26,620. [..]


Continue reading this article »

Gold Is Looking Risky, But Silver Looks Much Worse

Clemens Kownatzki, FXIS Market Insights

The World Gold Council recently issued its Gold Investment Digest for 2010 which provides, among many other interesting data points, a listing of official gold holdings of various countries. Notable highlight in our chart is the fact that the ETF GLD has been the 6th largest holder of gold at the end of 2010 (in case you were wondering what has been driving the price of gold in recent years).

chart

Gold continues to fascinate although it has been under pressure since the beginning of 2011. The precious metal has gained in investor acceptance and many advisors have been advocating to include a (small) percentage of gold as part of a well-diversified portfolio.  That in turn has led speculators to continue to invest in gold based exchange traded funds such as GLD (chart above). There are other gold funds though all seeking to share the gain on this unprecedented gold bull run.  How much of a speculative element there is remains to be seen but there sure are plenty of funds trying to imitate the precious... [..]

Continue reading this article »
WHERE IS INFLATION HEADED?

by Cullen Roche

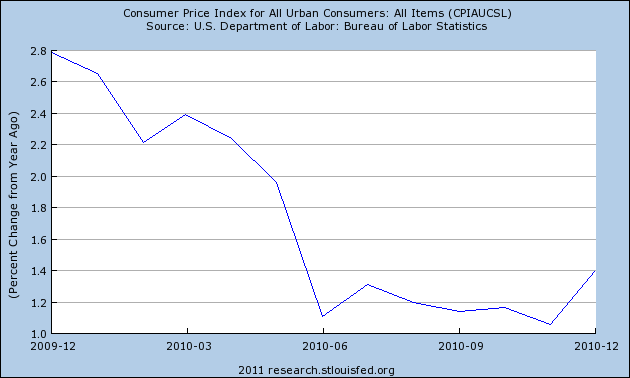
A little over a year ago I said inflation concerns in the USA were blown out of proportion and that we were likely to see an environment of disinflation “with a greater risk of deflation than hyperinflation”.  One year later that’s clearly what has occurred in the USA as disinflation ensued.  Overall inflation has continued to decline and deflationary fears became so substantial in Q3 2010 that the Fed panicked into implementing QE2.  In retrospect, it looks like the Fed jumped the gun as September economic data proved that the summer slowdown and double dip fears were overblown (not that it matters as we remain mired in one continuous balance sheet recession).  The good news is we’re not repeating the mistakes of Japan (yet), but we’re also not growing fast enough to meaningfully close the output gap.


But where are we now?  Is deflation still the greater risk?  What about commodity prices and global inflation?  How is this all going to play into the USA’s future inflation/deflation problems?
One thing we know from the credit crisis is that the Fed’s various “money printing” operations have had a far lesser impact on the rate of inflation than most presumed they would.  Despite an explosion in the monetary base inflation is near its lows.  As I’ve previously discussed, this unusual recession (a balance sheet recession) exposed many flaws in the way we understand the functions of modern banking.  The primary myth that has been exposed in recent months is the money multiplier.
Because we’re working in an unusual environment we have to throw out the old playbooks when estimating future rates of inflation.  The Fed’s actions are and will continue to be relatively futile in influencing future inflation.  Fiscal policy remains intact, however, is likely to come under increasing pressure in the coming years.  All of this occurs during a process of de-leveraging by the private sector.
From a demand-pull perspective the story remains little changed from last year.  This environment of low capacity utilization and tepid aggregate demand is likely to result in benign inflation.  This is due to the continuing strains at the consumer level.  A lack of job growth, de-leveraging, falling house prices, etc are likely to continue exerting pressures on the U.S. consumer in the coming years and make demand-pull inflation unlikely .... [..]

Continue reading this article »

Follow Us