Friday, September 12, 2014

The Trials and Tribulations of “Abenomics”

by Pater Tenebrarum

Abenomics Keeps Sputtering – What To Do?

We have frequently discussed the nonsensical attempt by Japanese prime minister Shinzo Abe and BoJ governor Haruhiko Kuroda to print and spend Japan back to prosperity in these pages. By now it is well known that devaluing the yen has not achieved the desired effect, but rather the opposite. Not only have exports not really received the expected boost, but Japan’s trade and current account surplus have decreased markedly, even posting negative numbers for the first time in decades. Of course, currency debasement never works: it cannot work.

1-Japan, current account

Japan’s current account over the past two decades.

We would like to point out though that a trade or current account surplus is not a measure of a country’s prosperity anyway. So even if the devaluation gambit had “succeeded”, its success would have been meaningless and any positive effects would have been strictly transitory. Japan’s consumers would have suffered just as they are suffering now. As Ludwig von Mises stated with regard to alleged advantages of devaluation:

“The much talked about advantages which devaluation secures in foreign trade and tourism, are entirely due to the fact that the adjustment of domestic prices and wage rates to the state of affairs created by devaluation requires some time. As long as this adjustment process is not yet completed, exporting is encouraged and importing is discouraged. However, this merely means that in this interval the citizens of the devaluating country are getting less for what they are selling abroad and paying more for what they are buying abroad; concomitantly they must restrict their consumption. This effect may appear as a boon in the opinion of those for whom the balance of trade is the yardstick of a nation’s welfare.

In plain language it is to be described in this way: The British citizen must export more British goods in order to buy that quantity of tea which he received before the devaluation for a smaller quantity of exported British goods.”

In short, devaluation means securing a strictly temporary advantage for a small sector of the economy – export-oriented companies – while impoverishing all consumers concurrently. In the end, not even the advantages for exporters will be maintained, as domestic prices will inevitable adjust. As strategies for economic revival go, this has to be one of the most moronic ones ever devised. Not surprisingly, the EU’s coterie of economic planners is also fervently in favor of debasing the euro. Especially France’s government has been quite vocal in this respect, which is telling. The situation in the EU at present is this: the ECB has taken the advice of the biggest economic illiterates in political power in the EU.

Abenomics has lately suffered additional setbacks. It is “succeeding” only in one respect – the yen’s purchasing power has plummeted. GDP has just declined by 7.1% annualized last quarter, reversing the gains of the previous quarter and then some. Both the previous quarter’s reported growth and the subsequent decline have partly been the result of a sales tax hike, so they have to be taken with a grain of salt. It is however conspicuous that virtually every economic datum released since April has come in “worse than expected” – in many cases, much worse.

2-japan-gdp-growth-annualized

Japan – annualized quarterly GDP growth rate

As a side effect of the sales tax hike as well as the yen’s depreciation, Japan’s consumer price index has begun to soar. Japanese officials play this down by relying on a “core inflation index” that excludes the effect of the sales tax hike, and consequently argue that the inflation rate is still too low. This obviously matters little to the average Japanese citizen, who has seen his real income melt like a pile of snow in the Sahara. It is unfortunately not possible for Japan’s consumers to pay “seasonally adjusted prices ex the sales tax effect”. Statistical artifice cannot alter economic reality.

3-japan-inflation-cpiJapan’s annual CPI growth rate.

Previously, Japanese consumer prices tended to mildly decline from time to time, thereby enhancing the meager incomes of Japan’s growing class of retirees and the incomes of wage earners. Abe and Kuroda have succeeded in impoverishing them. Mainstream economists all over the world are almost unanimous in their approval of this idiocy.

The Latest Advice

This brings us to the most recent plans and the advice dispensed by assorted bien pensants. Given the recent faltering of Japan’s economy, BoJ governor Kuroda has assured everyone that the central bank stands ready to monetize even more debt. After all, whenever the Keynesian recipe of money printing and deficit spending fails to work, it can only mean that not enough of it has been applied. The fact that it hasn’t worked in 25 years is regarded as clear proof that even more of the same is needed.

Concern has been mounting over whether the economic recovery will continue and inflation will hit the BOJ’s 2% target sometime next year.

“Should conditions emerge where the target becomes difficult to meet, we are ready to make without hesitation adjustments to policy, additional easing or whatever,” Mr. Kuroda told reporters after meeting Mr. Abe over lunch at the prime minister’s office. The consumer-price index, the BOJ’s policy target, has logged year-over-year rises for 14 straight months and stood at 1.3% in July, excluding the sales-tax rise.

Appearing on TV later in the day, the governor refuted views that there was little room for further easing, given the BOJ’s already massive bond purchases. “I don’t believe that there is a limit to additional easing or that there is nothing more we can do.”

[...]

The Japanese economy contracted an annualized 7.1% in the April-June quarter, as consumers tightened their belts and companies slashed new spending following the three-percentage-point rise in the sales tax to 8%.

The BoJ’s efforts have blown Japan’s monetary base “off the charts”, but a concomitant reduction in bank credit has meant that very little of this has actually translated into money supply growth – so far, that is.

4-monetary base, Japan

Japan’s monetary base rockets into the blue yonder.

It must be kept in mind here that this massive rise in the monetary base means that an ever larger share of the fiduciary media in Japan’s banking system have been transformed into covered money substitutes. This makes a deflationary credit collapse less and less likely, and by inference means that the opposite is becoming ever more likely. It cannot be ruled out that faith in the currency one day simply evaporates and that prices will then “catch up” with the monetary inflation that has taken place up to this point.

The main reason why the public’s continued confidence in the currency cannot be taken for granted is the essential Ponzi nature of the BoJ’s debt monetization schemes. By buying ever more government debt with newly issued bank reserves, the government ends up owing more and more of its debt to “itself”. The inherent absurdity of this situation should be obvious.

We can deduce from Mr. Kuroda’s comments that he is not at all concerned that anything untoward could happen. After all, it has all gone swimmingly so far. This unawareness on the part of the BoJ’s planners actually heightens the dangers considerably.

5-Japan-M1 st
Japan’s narrow money M1 (demand deposits and currency), roughly equivalent to money TMS-1. Note that in spite of the BoJ’s massive ‘QE’ operations, annualized growth has recently declined to 4% from an interim high of 6% achieved in early 2014. All the same, the money supply is up by a factor of six since Japan’s asset bubble burst in 1990. CPI meanwhile has risen somewhat until 1995 and has essentially flat-lined since then – click to enlarge.

So what is the advice dispensed to Japan’s policymakers in the financial press? That’s actually a rhetorical question – they are advised to do what they plan on doing anyway. The Nikkei Asian Review has recently been pondering whether Japan’s economy can “afford” another sales tax hike in 2015. It concludes that in spite of the dangers posed by the government’s debt-berg, only more printing and deficit spending can possibly rescue the economy – and there is of course great urgency:

“Most economists probably feel timid about predicting negative growth at a time when the pros and cons of another consumption tax hike are being discussed. Ryutaro Kono, chief economist at BNP Paribas Securities (Japan), is an exception. He predicts 0.1% negative growth for fiscal 2014.

For many economists who belong to organizations, it seems difficult to make unique and surprising predictions. But importantly, they do not want to see the additional consumption tax hike fall through. If it becomes clear the Japanese economy will post negative growth in fiscal 2014, it will be impossible to discuss another tax increase.

Japan’s fiscal conditions are continuing to deteriorate due to the aging of society. Many economists feel a sense of crisis, fearing that any delay in the additional tax hike would result in the crumbling of confidence in Japan’s fiscal policy.

So, what should be done?

The government and private sector should acknowledge the harsh economic situation and then discuss what measures should be taken. It could be possible to implement a supplementary budget, and embark on additional monetary easing as well as accelerate growth strategies.

The government’s Council on Economic and Fiscal Policy is due to start intensive discussions about the state of the economy on Sept. 16. Unbiased discussions and quick actions are more necessary than ever before.”

(emphasis added)

To summarize: there is a “sense of crisis” due to the explosion in Japan’s fiscal debt and the danger that confidence in fiscal policy may wane. The best way to counter this is by engaging in more money printing and even more deficit spending (this is what the “implementation of a supplementary budget” means – it means more government spending). This is Keynesian logic and brilliance in all it splendor.

6-Japan-debt-to-GDP plus projection

Japan’s total public debt-to-GDP ratio, including an overoptimistic projection – click to enlarge.

7-japan-government-budget-deficit

Japan’s government deficit as a percentage of GDP.

Conclusion:

We conclude that “more of the same” will remain the agenda until the whole house of cards implodes one day.

See the original article >>

10-Year Yield could move up over 150% says Joe Friday

by Chris Kimble

joefridayinversehandspattern10yryieldssept12

CLICK ON CHART TO ENLARGE

The Power of the Pattern suggested that interest rates were about to blast off in May of 2013, because it looked like a bullish inverse head & shoulders pattern in yields was in play. (see post here) What happened right after that posting? Interest rates experience the largest 18-month rally in yields in the past 30-years, beating the next biggest rally by 50%! (see rate aberation here)

Could an even larger bullish inverse head & shoulders pattern in yields be taking shape? The Power of the Pattern suggests it could be possible, if a few other developments take place.

It appears that a larger inverse H&S pattern in the 10-year yield could be forming. What needs to happen to make this huge rate rally possible? First step is to break above falling resistance in yields that has formed as rates have fallen this year. If a break of that resistance takes place, the next huge step is to see if rates can break above very stiff & heavy resistance at the neckline of this potential bullish yield pattern.

Joe Friday says.....If it does push above the neckline, the "measure move projection in rates" suggests that the yield on the 10-year note could reach almost 7%.

Besides bonds (TLT), watch Utilities (XLU) and Real Estate (IYR) to see if these interest rates sensitive sectors reflect concerns about rising rates.

See the original article >>

BofA Warns "Risk Of Selloff" After September's FOMC

by Tyler Durden

While BofAML's Michael Hanson expects Yellen’s overall tone to remain dovish, market perception will be key. The combination of changes to the forward guidance language, upward drift of the dots, and any comments seen as potentially hawkish, could lead to a selloff...

Via BofAML,

Risk of a hawkish read

The September FOMC meeting may be the most anticipated in nearly a year. We expect no fundamental changes in Fed policy, despite revising the statement to clarify policy data dependence and some upward drift in the dots. The FOMC should taper by another $10bn as well. Fed Chair Janet Yellen’s press conference will set the tone for the market reaction. While we anticipate she will continue to support a patient and gradual normalization process, the risk is that markets may sell off on the perception of a less dovish Fed.

Textual analysis

The FOMC statement has been the focus of much market speculation recently. The “significant underutilization of labor resources” phrase should be retained, in our view, given the soft August jobs report and only slight improvement on net since the July meeting. Conversely the “considerable time” language is likely to revised, in our view, as several Fed officials worry it sounds too much like calendar guidance. To reinforce the data dependent nature of policy, the FOMC could suggest that they will maintain the current 0 to ¼ percent funds rate target range until there has been “considerable progress toward the dual mandate objectives.” We also expect the statement to note that these changes do not reflect a shift in policy preferences, and for Yellen to reiterate that point at the press conference. Still, the risk is that markets see these revisions as a hawkish move in the timing of liftoff.

Drifting dots

The Summary of Economic Projections (SEP) should reveal a slight revision lower for the unemployment rate forecasts for this year and next. We expect a modest upward drift to the 2015 and 2016 dots as well, as some centrist Fed officials have recently shifted to “midyear” from “second half” for their expected start to the tightening cycle. (We just updated our own forecast for the Fed’s first rate hike to June 2015 from September.) The 2017 forecasts will be included for the first time; we look for the median dot to be between 3.25 and 3.50%, with the median ex-hawks at that lower bound. The median longer-run policy rate projection should remain at 3.75%.

Recall that Governor Lael Brainard participates in the SEP for the first time at this meeting.

Market risk also drifts up

Markets are priced well below just about any reasonable variation on the median dot, and a recent San Francisco Fed paper noted that the market seems both too dovish and too certain about Fed policy as well.

Drifting dots thus represent a significant risk for a selloff in the markets. While we expect Yellen to de-emphasize the dots at the press conference  - they are not a consensus policy tool, after all - markets may have difficulty looking past them this time.

*  *  *

Meet the press

Finally, Chair Yellen will likely continue her more balanced discussion of the labor market outlook, yet still emphasize a patient approach to policy normalization. She also may update the discussion around the revised Exit Strategy Principles, but a formal restatement may not appear until later this year. While we expect Yellen’s overall tone to remain dovish, market perception will be key. The combination of changes to the forward guidance language, upward drift of the dots, and any comments seen as potentially hawkish, could lead to a selloff, particularly at the short end of the yield curve.

See the original article >>

Are US bonds and gold anticipating higher rates?

By Anthony Lazzara

Retail sales climbed at the fastest pace in four months. The Thomson Reuters/University of Michigan preliminary consumer sentiment index rose to 84.6 in September from 82.5 the month before. The S&P 500 (CME:SPZ14) has declined 0.8 percent this week.

Equities: The E-mini S&P 500 is down 5 points to 1984. The next key Fibonacci support level is at 1957. We would not be surprised to see the market head towards that area, possibly even this month as the Fed meets next week. With the strong retail sales data, it looks like the bond and stock markets are starting to try to adjust for the potential of higher rates. 2000 is a tough barrier for the E-mini S&P500, and for the past couple of weeks, the market has not been strong enough to overcome that key level. If this market sells off, we look for 1957 to be hit.

Currencies: The Aussie dollar is down 50 ticks to 89.85, while the USD is down just one tick to 84.45. The Swiss Franc has rebounded slightly to 107.03. It looks like the big move in the USD has been made, and perhaps we will see some consolidation in the short term. We would not be surprised to see the USD move higher in the future however. The Pound is up 5 ticks to 162.12, in back and forth trade before the big referendum vote later this month.

Bonds: The U.S. bonds are down over one point today in a significant downmove. We believe the bonds will continue to slide, possibly along with stocks this month, as the implications of higher interest rates spook bond and stock bulls. Our next key support/target level is 134’28. We would not be surprised to see the bonds head towards that level. We believe the Fed will likely try to talk interest rates lower until they actually start to raise them. However, if we continue to get strong economic reports out of the United States, we believe the bond market will act first.

Commodities: Many key commodities are lower today, likely in conjunction with rising U.S. bond yields. Gold (COMEX:GCV14) is down $10 to $1229. Our next key technical support level is $1225. Crude (NYMEX:CLV14) oil is reversing some of yesterday’s gains, down $.25 to $92.58. Nov14 soybeans spiked lower on yesterday’s quarterly USDA report, and are now at one of our key areas at $9.83, up almost $.02 on the day.

See the original article >>

5 Things To Ponder: "Bear-ly" Extant

by Lance Roberts

"It is a bad sign for the market when all the bears give up. If no-one is left to be converted, it usually means no-one is left to buy.” - Pater Tenebrarum

That quote got me thinking about the dearth of bearish views that are currently prevalent in the market. The chart below shows the monthly level of bearish outlooks according to the Investors Intelligence survey.

Bearish-Sentiment

The extraordinarily low level of "bearish" outlooks combined with extreme levels of complacency within the financial markets has historically been a "poor cocktail" for future investment success.

As Michael Sincere recently stated rather sarcastically:

"If you study history, you know that no one thought the price of tulips, houses, or stocks would ever go down. Even most bulls believe that 'one day' there will be a correction, but that day is far away. After all, the Fed has an unlimited supply of magical tools, and they are determined to keep the market from falling.

Unfortunately for soul-searching bears, the Fed trumps all. As long as new money flows into stocks, interest rates are low, and the market keeps going up, why worry?"

That is the focus of this weekend's list of "Things To Ponder."


1) The Death Of Bears by Pater Tenebrarum via Acting Man Blog

“What prompts this missive is news that yet another prominent bear has apparently given up. The thing is, this bear – Wells Fargo analyst Gina Martin Adams – wasn’t even a bear, but merely a somewhat reluctant bull, whose targets got taken out a few times. It is interesting from a psychological perspective that a not overly foaming-at-the-mouth bull is considered a “bear” by the financial media, a “famous bear” even. She has now recanted, and has apparently been preceded by several others. An SPX target of 1850 points apparently made her the “most bearish strategist” on Wall Street!

‘Gina Martin Adams of Wells Fargo has long been known as the most bearish strategist on Wall Street. After all, at 1,850, she had the lowest year-end S&P target among major strategists. But on Tuesday, she got rid of that year-end target and initiated at 12-month target of 2,100, reflecting a mildly bullish outlook.’

Given that no prominent bearish Wall Street strategists seem to be left now – not even those forecasting 5% dips or flat markets – we won’t be able to report on any additional conversions."

2) The Two Pillars Of Full-Cycle Investing by John Hussman via Hussman Funds

"As value investor Howard Marks observed last week:

'Today I feel it’s important to pay more attention to loss prevention than to the pursuit of gain. Although I have no idea what could make the day of reckoning come sooner rather than later, I don’t think it’s too early to take today’s carefree market conditions into consideration. What I do know is that those conditions are creating a degree of risk for which there is no commensurate risk premium.'

So while many observers pronounce victory at halftime, in the middle of a market cycle, at record highs and more extreme market valuations than at any point except the 2000 peak, remember the two pillars. First, the combination of high confidence, lopsided bullishness, overvaluation, and overbought multi-year advances has predictably been resolved by steep market losses, time and time again across history. Second, strong market return/risk profiles warranting constructive or leveraged investment positions emerge in every market cycle, generally following a material retreat in valuations, coupled with an early improvement in market action. We believe that one of these is descriptive of present market conditions, and the other is well worth our patience.

Hussman-091214

History teaches clear lessons about how this episode will end – namely with a decline that wipes out years and years of prior market returns. The fact that few investors – in aggregate – will get out is simply a matter of arithmetic and equilibrium. The best that investors can hope for is that someone else will be found to hold the bag, but that requires success at what I’ll call the Exit Rule for Bubbles: you only get out if you panic before everyone else does. Look at it as a game of musical chairs with a progressively contracting number of greater fools.”

3) Eerie Parallels To 1937 by Dr. Robert Shiller via Project Syndicate

“The current world situation is not nearly so dire, but there are parallels, particularly to 1937. Now, as then, people have been disappointed for a long time, and many are despairing. They are becoming more fearful for their long-term economic future. And such fears can have severe consequences.”

Read Also: For 90% Of Americans There Has Been No Recovery

4) The Tailwind To Stocks Is Gone by GaveKal Capital Blog

“Generally as equity prices rise, commercial hedgers take on a greater short position, and when price fall they take on a greater long position.  When the position of commercial traders is significantly short, it suggests a large short position has been built up.  If commercial traders are short and get their directional bets wrong, it provides fuel for the market to propel higher as commercial traders have to cover their shorts by buying stock.  In turn, if commercial traders have closed out their short positions, this suggests there may be little fuel left for the upside in stocks.”

GaveKal-COT-091214

“This short covering induced buying has helped the equity markets attain all-time highs.  But, now the short covering has largely been completed and will no longer provide much of a tailwind for stocks.”

5) Tracking The Decline Of Risk Aversion by Scott Grannis via Calafia Beach Pundit

“For most of the past five years I've argued that one of the dominant features of this recovery was risk aversion. The Great Recession so scared and shocked the world that risk aversion became exceptionally high. I've also argued that the main purpose of the Fed's QE program was to supply a very risk averse world with safe securities, by essentially converting ("transmogrifying") notes and bonds into T-bill equivalents (aka bank reserves). The point of QE was not to stimulate the economy, as many have argued, but to accommodate the world's intense demand for safe assets.”

See the original article >>

Why This Equity Rally Is About To End Badly

by Michael Pento

The deafening cacophony on Wall Street for the past six years has been since interest rates are at zero percent that there is no place else to put your money except stocks. For most, it just doesn’t matter that the ratio of Total Market Cap to GDP is 125 percent, which is 15 percent points higher than in 2007 and the highest at any time outside of the tech bubble at the turn of the century. Sovereign bond yields are at record lows across the globe and the strategy for most investors is to ignore anemic economic growth rates and just continue to plow more money into the market simply because, “there’s no place else to put your money.”

But the epicenter for this market’s upcoming earthquake will be in the FX market. The US dollar has soared since May due to the overwhelming consensus that while the Fed will be out of the QE business in October and raising rates in 2015, Japan and the Eurozone are headed in the exact opposite direction. The BOJ is already going full throttle with QE and the ECB announced last week that its own asset back security purchase program would begin in October. The Greenback is already up over 5 percent on the DXY in the past four months and a continued increase in the dollar’s values will start to significantly impair the reported earnings on US based multinational corporations. This deflationary force is one reason why stock prices could correct very soon.

But what is even more likely to occur is a sharp and massive reversal of the dollar’s fortunes. As stated before, nearly everyone on Wall Street is convinced the Fed will be hiking rates next year. And now that the BOJ and ECB have committed to go all-in on QE, how much more can they really do to cause their currencies to depreciate further? With the Ten-year notes in Germany and Japan yielding just .93 and .50 percent respectively, can these central banks really make the case that borrowing costs are still too high to support GDP growth?

If robust U.S. GDP growth does not materialize this year as anticipated, just as it has failed to do each year since the Great Recession ended, the dollar will come under pressure. In fact, real GDP growth has not grown north of 2.5% since 2006. With the Fed ending its massive bond purchases and the rest of the developed world flirting with recession, it’s hard to make a case why this year’s growth rate would be the exception—U.S. GDP growth for the first six months of this year is running at just 1 percent.

If the market perceives that Fed won’t be able to hike rates next year and may be forced back into the QE business due to a stalling U.S. economy, a reversal in the yen carry trade will occur. Financial institutions have been borrowing yen at near zero percent and investing into our bond and stock markets. Since yields are higher in the U.S. and the direction of the yen was virtually guaranteed to be headed lower due to the continued intervention from the BOJ, the trade has been a double-win. However, if the dollar reverses course it will cause a stampede of dollar sellers out through a small and narrowing door to sell overvalued stocks and bonds in order to purchase back a rising yen.

Massive currency volatility is just one of the incredibly-destructive effects resulting from this unprecedented manipulation of interest rates on the part of global central bankers. The unwinding of the yen carry trade is one factor that could bury the notion that stock prices can’t fall while the Fed is at the zero bound range.

Of course, the selloff in stocks would merely be a tremor that forebodes a much greater earthquake—one that would be devastating for both stocks and bonds. The real quake I’m speaking of is the inevitable synchronized collapse of global sovereign debt prices.

This is because the free market works a lot like plate tectonics. Continental drift causes friction in the earth's lithosphere. The slippage of these plates causes the earth to quake and is really nature’s way of relieving pent-up pressures. Smaller earthquakes tend to preclude larger ones from occurring by gradually relieving that stress.  Likewise, recessions and depressions relieve the imbalances of debt and asset bubbles that build up in the economy. Trying to prevent minor earthquakes and recessions from occurring can only lead to a complete catastrophe.

Central banks tried to avert a healing recession in 2008 by completely commandeering the global sovereign debt market. And now, yields in Europe, Japan, and the United States have never been lower in history. Record-low sovereign bond yields should be the result of plummeting debt to GDP ratios and central bank balance sheets that have shrunk down significantly to ensure inflation will be quiescent.

However, the exact opposite is the case. For example, U.S. National debt has increased by $8.6 trillion since 2008 and the debt to GDP ratio has increased from 64 percent, to 105 percent during that same time frame. In addition, the Fed’s balance sheet has jumped from $800 billion to $4.4 trillion in those same years. Therefore, the credit quality has vastly decreased while the danger of inflation has dramatically increased due to the growth in the monetary base. Unless the economy is flirting with a deflationary depression, interest rates would be much higher than they are today.

Central bankers should eventually achieve success in creating inflation above the 2 percent target. But these money printers can’t pick an arbitrary inflation goal and stick the landing perfectly. It is likely that inflation will overshoot the stated goals. The difficult choice would then be to either allow inflation to run out of control or force bond sales. This means central banks would swing from being a huge buyer of sovereign debt, to selling massive quantities of bonds. In this scenario interest rates would not only mean revert very quickly but most likely eclipse that level by a large degree.

In the case of Japan, the 10-year note averaged 3 percent from 1984 until 2014. A spike in yields from .50 percent to over, 3.0 percent would cause interest expenses on sovereign debt to explode to the point where the economy would be devastated. Much the same scenario holds true for the Eurozone and the United States.

In contrast, if these central banks are unsuccessful in creating growth and inflation, then the resulting economic malaise will cause bond investors to lose faith in the government’s ability to ensure debt service payments don’t outstrip the tax bases of these countries. This is exactly what occurred in Europe during the recent debt crisis of 2010-2012. Once a market becomes convinced that a nation can’t pay back its debt in real terms the value of that debt plummets.

Ultimately, this is the real crisis that awaits us on the other side of this massive and unprecedented distortion in global bond yields. And is why this equity market rally will end sadly in a massive quake that will make 2008 seem like a mild tremor.

See the original article >>

Macro Factors Dominating Gold Price As US Dollar Outweighs Physical Demand And Investor Flows

By Mark O’Byrne
With gold trading in a narrow range below $1,300 and remaining relatively weak, it is worth pausing at this juncture to look at the combination of factors that are affecting its price formation.

A current snapshot of the world gold market and its near term outlook can be gauged by examining four sets of influences on the market, namely the macro/geopolitical environment, investment demand flows, physical demand in the major markets (using India as an example), and finally the technical picture.

Macro Economic/Geo-Political
Overall sentiment in the gold market continues to be set by the global geopolitical and macro environment.

The relative strength of the US economy compared to other economies is currently creating relative dollar strength, even despite the fact that the monthly US non-farm payrolls for August came in at 142,000 new jobs last Friday, this was substantially lower than the consensus predictions of 200,000.

This is because other major currencies are making the US Dollar look good. The British pound is weakening due to the heightened uncertainty over the outcome of next week’s Scottish independence referendum, while last week’s European Central Bank (ECB) cut in interest rates and expectations of sovereign bond buying by the ECB later this year are weighing on the Euro. Therefore, with pressure on the Pound and the Euro, the US Dollar is displaying relative strength.
As gold price discovery on world markets is in US dollars, and most pricing and trading is in US dollars, as the dollar strengthens, gold purchases become more expensive for non-US dollar denominated investors. This is just a fact of the market.

Globally, while there are not as of yet very strong expectations of interest rate rises in the major economics, interest rate expectations are strongest for the US economy. This was illustrated yesterday when the San Francisco Federal Reserve cited a study which indicated that investor interest rate expectations are currently lower than those of the Federal Reserve. The San Francisco Fed seems to be signalling that investors should expect an interest rate hike sooner than expected.

With the recent ceasefire in the Ukrainian-Russian conflict, the relative demand for gold as a safe haven asset has dwindled in the last week. Today a report by Dutch investigators  into the downing of Malaysian Airlines flight MH 17 only stated that the flight was likely downed by an outside impact. Since the report’s conclusions appear to be deliberately ambiguous, this does not appear to change anything as far as the ceasefire or the negotiating position of any peace negotiations.
Investor Demand
The flows of investment into and out of physically backed gold Exchange Traded Products (ETPs) are also helpful in gauging sentiment in the world gold market.

In August there was a net 17 tonne outflow from physically backed gold ETPs, with an outflow of 6.5 in the last week of August. ETPs include the GLD (SPDR Gold Shares) and the IAU (iShares Gold Trust) products. The total accumulation of gold in these products then stood at 1,726 tonnes at the beginning of September and was down 36 tonnes compared to the beginning of the year.

While this year-to-date drop is not much compared to the 800 tonne outflow in 2013, it is still a sign that investors who use the ETF/ETP route, are not, on a net basis, allocating new money to gold.
In first week of September there were 13 tonnes of outflows from physical gold ETPs. In GLD, the total holding is now at 785 tonnes, and total ETP holdings (in all tracked products) are now down to 1,713 tonnes (as of September 4), nearly 3% lower than the start of the year. Thus, ETP flows are slightly bearish at the moment but overall quite neutral.

Investor sentiment in the gold futures market as well as coin demand for the bullion coins of the major Mints are also used as additional gauges for investor demand flows, but at the moment, these gauges, along with the ETPs are just neutral to slightly bearish.

Physical Demand in India
Physical demand in the large consumer gold market of India has been weaker than expected because the newly elected government has not yet reduced gold import restrictions despite the trade balance having improved.

Last year, the fall in world gold prices saw a surge in gold imports into India which had a large negative impact on the trade balance and weakened the Indian Rupee. Import duties on gold rose to 10% and import restrictions were imposed specifying that of all the gold officially imported, 20% had to be re-exported. Other import restrictions were also introduced for banks and trade houses that usually import gold.

These restrictions on gold demand worked as expected however they led to a sharp increase in gold smuggling into India. Although official figures on gold smuggling are just estimates, the World Gold Council speculates that for all of 2014, Indian gold imports via smuggling could reach 200 tonnes. This is about the same amount as was imported into India officially during Q2 of this year.

It remains to be seen how the new Indian government views the current import restrictions on gold. They may wait in the near term before tweaking with economic policy that has helped to improve the trade balance.

The Indian festival and wedding season is fast approaching however, which is always seen as a positive factor in the annual cycle of Indian gold demand. The major festival of Diwali is on October 23, while the end of year wedding season peaks in November and December.

The wedding season is important since in traditional Indian society, gold is given as wedding gifts as well as being a source of demand for wedding jewellery.

Another factor impacting gold demand in India is the monsoon season since this affects crop production and dictates how much disposable income is available to rural Indian society to save in the form of gold. If a monsoon season is weak then sometimes saved gold is even used to raise cash to balance household incomes.

Technical Factors
Support that had existed at $1,270 has now been breached. The next major support level is at $1,240, but before that the psychological support level of $1,250. There is major support near $1,180.

Resistance is now at $1,277 and $1,297. If gold did manage to go above $1,297 it could trade up to $1,325 or even higher to $1,345.  A resumption of an uptrend in the price would be clear if gold broke above $1,520.

Interesting, Jim Sinclair, the well-respected gold expert and technical analyst said yesterday that gold cycles which turned gold back from the $1,900 level in 2011, have now turned up and are indicating that the gold price which is now in a major support area, will now aim to reach a $2,100 target area.
Market Update
Today’s AM fix was USD 1,256.00, EUR 974.78 and GBP 779.79 per ounce.
Yesterday’s AM fix was USD 1,267.25, EUR 978.87 and GBP 786.57 per ounce.

Gold fell $13.20 or 1.04% to $1,255.60 per ounce and silver dropped $0.17 or 0.89% to $19.03 per ounce yesterday.

Gold is currently trading near a three month low at $1,255, but unchanged from close of trading in New York yesterday. Specifically, the three month low was in June 2014 at $1,240. Yesterday in New York trading, gold fell more than $10 from $1,265 but recovered to close in New York at $1,255. In Singapore overnight trading, gold finished trading near $1,255.

The US Dollar Index is currently trading near its 14 month high which was reached in July 2013.

Silver is trading at $19.19, unchanged from yesterday. Platinum is down 1.05% at $1,395 while palladium is down 1.45% at $887.

See the original article >>

Bubble forming in US middle market leveraged finance

by Sober Look

US middle market leveraged buyout (LBO) transactions are becoming increasingly frothy. According to the latest data from Lincoln International, risk-return fundamentals in the space are worse than they were in 2007. Here are some disturbing facts about leveraged transactions in US middle markets:
1. Leverage multiples (debt to EBITDA) are higher than at the peak of the bubble in 2007. In particular, leverage through the senior debt (dark blue) is now materially higher.

2. Yields on senior leveraged loans for middle market deals are now significantly lower than in 2007. Investors are not getting paid for taking on riskier loans.

3. Furthermore, private middle market company valuations (as a multiple of EBITDA) are at record levels.

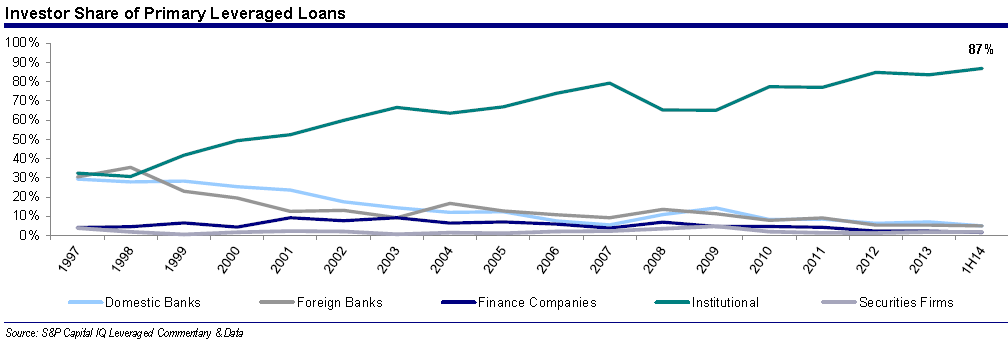
4. Banks have all but exited leveraged loan origination, as institutions (shadow banking) have taken over. These institutions include loan funds (mutual funds and closed-end funds), BDCs, CLOs, hedge funds, insurance firms, pensions, etc. However, since the Fed is mostly looking at banks' balance sheets, the central bank seems to be unconcerned about the froth in this market.

5. According to Lincoln International, there are signs that leveraged middle market firms are experiencing margin compression. That is worrisome given the amount of leverage these firms have.

Lincoln International: - While over 50% of companies are seeing revenue growth, the fact that over 50% are experiencing EBITDA declines suggests margin compression. For the sixth consecutive quarter, more middle market companies experienced EBITDA declines than gains.

The Fed has allowed for bubble to build in the US corporate sector - particularly in leveraged middle market companies. A broad hit to revenues could create a massive wave of failures, as firms become too leveraged to withstand such a shock. At the same time investors could face significant losses without being compensated for the risk they are taking. Let's hope someone on the FOMC is paying attention.

See the original article >>

Same $#!%, Different PIIGS

by Shane Obata

Desperate governments call for desperate measures.

Unfortunately for us, citizens often end up paying for the mistakes of their governments. That’s not how it should be but, sometimes, that’s how it is. If and a when a government is no longer able to meet its obligations, capital controls, broad wealth confiscation measures, and other extreme burdens are often considered.

Spanish bond yields just fell to their lowest levels in history but does that mean that your money is safe there? Absolutely not. It means that investors are complacent, not that Spain’s political risk has diminished.

Portugal is in the same boat. While its borrowing costs continue to fall, its prospects for economic growth and its financial position continue to worsen. If you’ve got assets in Portugal then now would be a good time to contemplate how safe they really are. Unless you like bail-ins, that is.

Bail-ins

“A bail-in “forces the borrower’s creditors to bear some of the burden by having part of the debt they are owed written off. In the case of Cyprus, the creditors in question were bondholders, and depositors with more than €100,000 in their accounts.”

Some say “bear the burden”, others, like Jeff Thomas, say “wealth confiscation” :

“On 16th of March 2013, the banks of Cyprus – with the approval of the Cyprus government, the European Commission, the European Central Bank, and the International Monetary Fund, confiscated private savings of accounts exceeding €100,000.”

Why were the savers punished? Because of excessive risk taking by Cyprus’s banks. Two of its largest banks, Laiki Bank and the Bank of Cyprus, decided to Greek government bonds in an attempt to profit from their higher yields. Unfortunately for the banks, the bet turned sour when yields spiked past 40% during Greece’s sovereign debt crisis. As a result, the Greek bonds lost most of their value – costing the Cypriot banks close to €4.5 billion and wiping out their capital.

Were there any indications that a bail-in might occur? Sure.

According to Trading Economics, In Cyprus…

- GDP started contracting in late 2011.

- The number of employed persons fell from 388.7 thousand in 2011 to 376 thousand in 2012.

- The number of unemployed persons more than tripled from 2009 to 2013.

- The Government debt to GDP ratio increased from 58.5% in 2010 to 86.6% in 2013.

- The residential property price index has been in decline since the financial crisis.

In sum, depositors in Cyprus were punished for the mistakes of their banks. Yes, Cyprus’s economy was showing weakness before the confiscation occurred. That said, it was not clear to depositors that their savings were at risk; what happened to them was unjust to say the least. Savers should NEVER be held accountable for the mistakes of their governments; regrettably, they often are.

Another form of wealth confiscation to think about is deposit taxes.

Deposit taxes

Like bail-ins, deposit taxes are bad for savers. What’s more is that they’ve been used before – recently in Spain:

“On 4th July, Spain announced that it would impose a blanket taxation on all bank accounts at the rate of 0.03% for the purpose of “Harmonizing tax regimes and generating revenues.” – Jeff Thomas

This situation is a great example of moral hazard because the deposit taxes will negatively impact Spain’s citizens more so than its government officials.

If the tax is supposed to help Spain’s economy then isn’t it a good thing? No. Spain’s people should not be forced to make up for the errors of their government.

Not unlike Cyprus, Spain’s economy has been in trouble for some time. According to Focus Economics, in Spain, GDP, Investment, and retail sales contracted in every year from 2009 to 2013. Furthermore, public debt as a % of GDP grew from 54% to 93.9% over that same time frame.

In both Cyprus and Spain, poor decisions and economic and fiscal problems led to some form of wealth confiscation.

If it happened there then could it happen to Portugal? It’s not out of the question.

Portugal

Same problems, different country. Portugal is an ideal candidate for wealth confiscation because, like Cyprus, its banks are in trouble. On July 19th, 2014, the holding company of Banco Espirito Santo (BES) – Portugal’s 2nd largest bank - filed for bankruptcy protection. Since that time, two more of its holding companies did the same. If and when BES goes under then who’s going to have to pay for it? Hopefully not its depositors.

What’s more is that the economic backdrop is Portugal is getting worse.

In Portugal,

- Debt as a % of GDP is rising

- Credit is contracting

- Economic activity is in decline

- The employed population and the working-age population (15-64) are shrinking

- Consumer sentiment is mostly negative

If the banking system problems in Portugal turn out to be systematic then it’s likely that its people might have to foot the bill. In order words, wealth confiscation might be right around the corner.

If you’ve got assets in Portugal then watch out. You don’t want to be left holding the bag if and when shit hits the fan.

See the original article >>

Per la ripresa non ci sono scorciatoie

by Roberto Perotti

Giavazzi e Tabellini propongono un taglio alle tasse di 80 miliardi, finanziato dalla Bce e accompagnato da una riduzione della spesa futura. Ma nessun paese ha mai prodotto un piano credibile di riduzione di spesa così enorme. L’unica alternativa realistica: ridurre le tasse insieme alla spesa.

È sempre più comune l’opinione secondo cui “l’austerità non ha funzionato”: l’ Europa è sul baratro della deflazione, e soffre di un deficit di domanda. Una recente proposta su lavoce.info di Francesco Giavazzi e Guido Tabellini offre una soluzione che è ampiamente condivisa: i paesi dell’ Eurozona dovrebbero tagliare le tasse simultaneamente del 5 percento del Pil, e la Bce dovrebbe comprare il debito pubblico risultante. Allo stesso tempo, questi paesi dovrebbero  presentare dei piani credibili per la riduzione della spesa pubblica futura.

Come notano Giavazzi e Tabellini, la Germania quasi certamente si opporrebbe. Ma anche non lo facesse, il piano non funzionerebbe. Il motive non è che le politiche restrittive di bilancio (l’opposto del tax cut) siano espansive: come ho mostrato in una mia recente ricerca (1)  (e contrariamente alle implicazioni di mie ricerche meno recenti), l‘evidenza empirica in supporto dell’“austerità espansiva” è debole.

UN PIANO CREDIBILE DI RIDUZIONE DELLA SPESA FUTURA E’ NECESSARIO …….

Dove è il problema quindi? Molti commentatori sono d’ accordo che parecchie economie europee, come l’Italia o la Francia, hanno bisogno di ridurre permanentemente le tasse. Il vincolo di bilancio intertemporale dello stato ci dice che questo può essere ottenuto solo riducendo la spesa pubblica permanentemente. Un taglio delle tasse del 5 percento può essere interpretato come un modo di aniticipare i benefici del taglio permanente delle tasse, mentre si attende che i tagli di spesa si materializzino. Perché questo funzioni, è necessario appunto un piano credibile di riduzione della spesa in futuro.

Perché? Nel mondo reale, il debito pubblico è rischioso, e ai mercati non piace che esso cresca, sopratttutto in paesi con un alto livello di spesa e debito pubblici. Senza un piano credibile di riduzione della spesa in futuro, di fronte a un taglio delle tasse gigantesco come quello proposto da Giavazzi e Tabellini i mercati finanziari sarebbero presi dal panico, perché vedrebbero un ritorno alle politiche di bilancio irresponsabili  del passato; questo avrebbe effetti devastanti sul settore bancario, ancora molto esposto al debito sovrano, come nel 2011. Il tentativo di espandere la domanda aggregate attraverso un taglio delle tasse  si trasformerebbe in un boomerang.

…… MA NON FATTIBILE

Il problema di fondo è che è praticamente impossibile produrre un piano credibile di riduzione della spesa futura, tantomeno per l’importo enorme che un taglio delle tasse del 5 percento comporterebbe. L’ esempio più chiaro è offerto dai due piani di consolidamento fiscali più celebri, la Finlandia e la Svezia negli anni novanta. Tra il 1992 e il 1996, secondi gli annunci ufficiali la Finlandia avrebbe dovuto ridurre il disavanzo dell’11,4 percento del Pil, di cui 12,1 percento del Pil in tagli alla spesa; gli stessi numeri per la Svezia erano del 10,6 e del 6,8 percento del Pil, ripsettivamente. Tuttavia, questi erano gli annunci; la realtà fu molto differente. Alla fine di quel quinquennio, la Finlandia ridusse la spesa pubblica di solo lo 0,4 percento del Pil (contro previsioni  di un taglio del 12,1 percento!), la Svezia del 3,6 percento.

Ma non è necessario andare indietro così tanto. Un taglio delle tasse del 5 percento del Pil in Italia significa 80 miliardi di euro. I tagli di spesa individuati in un anno di duro lavoro dal commissario Cottarelli sono al più di 12-15 miliardi, e presumibilmente non tutti verranno approvati dal governo.

Il problema è ancora più complicato perché la promessa di monetizzazione del taglio alle tasse della proposta di Giavazzi e Tabellini crea un insormontabile probema di azzardo morale. Per coloro che pensano che questo sia solo un problema di interesse teorico, è utile ricordare che la crisi del debito pubblico in Italia inziò nell’ estate del 2011, quando il governo italiano, dopo aver annunciato un taglio di spesa di circa 3 miliardi di euro (lo 0,2 percento del Pil) ritrattò immediatamente dopo che la Bce iniziò a comprare titoli di stato italiani.

Si potrebbe pensare che, se le cose non dovessero andare come ci si aspetta, si possono sempre ritirare i tagli alle tasse. Ma un paese come l’Italia non ha mai sperimentato un taglio discrezionale alle tasse di più del 0,5 percento del Pil. Un taglio e poi un aumento di tasse di una cifra come 80 miliardi di euro,  creerebbero un disastro politico, ed enorme incertezza economica.

NON TUTTI I DISAVANZI SONO UGUALI

Non tutti i disavanzi di bilancio sono uguali. Una cosa è un disavanzo temporaneo per ricapitalizzare il sistema bancario in un paese con basso debito  e con una storia di politche fiscali responsabili, come in Gran Bretagna dopo la crisi finanziaria. Un’ altra cosa è un disavanzo di bilancio senza un piano credibile per ridurre le spese future, in un  paese ad alto debito pubblico, con una storia di politiche di bilancio irresponsabili e con governi tradizionalmente deboli.

Per un tale paese, l’ unica alternative possible per raggiungere lo scopo più importante – ridurre le tasse – è di tagliare le tasse insieme alla spesa. Questo processo richiede tempo, e funzionerà incrementalmente, miliardo di risparmi di spesa dopo miliardo. Ma è l’ unico approccio realistico. L’ alternativa non raggiungerebbe il proposito di aumentare la domanda.

See the original article >>

Un popolo di santi e poeti? Non proprio…

by Tito Boeri

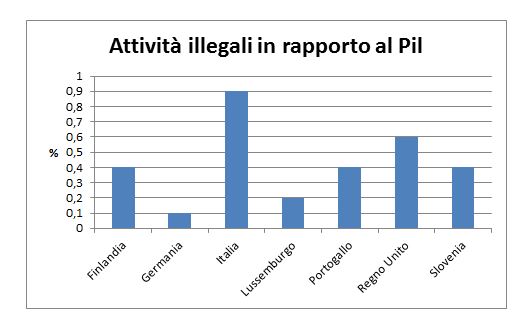
Per accorgersi di quali siano le basi scientifiche della correzione del Prodotto Interno Lordo per attività illegali “con scambi volontari” promossa da Eurostat e attuata anche dal nostro istituto di statistica, basta guardare il grafico qui sotto. Ci dice qual è la quota del Prodotto Interno Lordo associata a prostituzione, droga e gioco d’azzardo nei diversi paesi che hanno fatto questo aggiustamento. In Italia queste attività valgono, con le debite proporzioni,  quasi dieci volte in più che in Germania, cinque volte in più che nel Lussemburgo, il doppio che in Slovenia e un terzo in più che nel Regno Unito, l’unico paese in cui è l’ufficio statistico ad avere chiarito come questi numeri sono stati calcolati. L’ufficio Statistico di sua Maestà la Regina ha stimato il valore aggiunto associato al traffico di droga moltiplicando il potenziale numero di consumatori di sostanze stupefacenti con congetture sulle dosi di cui fanno uso, senza preoccuparsi di controllare (sarebbe stato  “troppo complesso”) che queste cifre abbiano una qualche corrispondenza con gli accertamenti giudiziari e della polizia sul traffico di droga. Il contributo dato dalla prostituzione al Prodotto Interno Lordo è stato invece stimato guardando all’offerta anziché alla domanda: invece di stimare il numero di utilizzatori finali, sono stati raccolti dati sul consumo di preservativi, sul numero di “tenute da lavoro” delle prostitute e sulle abitazioni in affitto adibite a ricevere i clienti. Non sappiamo quale metodo abbia utilizzato l’Istat, ma le cifre diramate in questi giorni implicano che ogni maschio italiano in età sessualmente attiva spende circa 167 euro l’anno per andare con prostitute, che il traffico di droga genera un valore aggiunto pro-capite di 248 euro e il contrabbando di sigarette ha un valore aggiunto di circa 30 euro per fumatore o una spesa per fumatore di almeno 300 euro (trattandosi di beni importati, bisogna dedurre dalla spesa degli italiani il costo delle sigarette acquistate all’estero dai contrabbandieri), vale a dire un terzo dei consumi di una famiglia media per tabacco. Se crediamo a queste stime, dovremmo ritoccare la facciata del Palazzo della Civiltà Italiana dell’EUR. Più che “un popolo di poeti di artisti e di navigatori”, siamo soprattutto un popolo di drogati, contrabbandieri e…. puttanieri.

attività illegali pil terzo e ultimo

Elaborazione dati da Istituti Statistici Nazionali

See the original article >>

How to Adjust to the Roller Coaster Market

by Greg Harmon

This short term choppy market can give you agita if you are trading the wrong timeframe. You do your homework, and find your trades and they trigger, only to reverse lower. Here is where the agita part comes in. Your longer term analysis shows that the uptrend in the market is still intact. Yet with each break out in a stock you like it pulls back and looks to trigger your stop. You feel you are right, but you have had it drilled into your head to trust your stops and just move on. If you are wrong and remove your stop what happens if it just keeps going lower? When do you release your rising trend conviction? How are you supposed to rectify these two conditions?

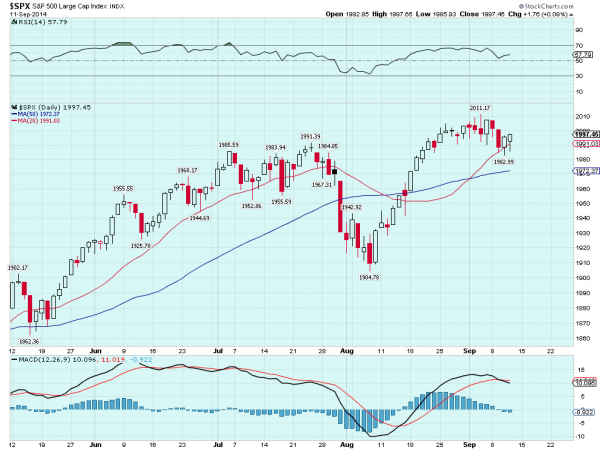
spx

The answer often comes down to three things. First, change your timeframe to suit the current market. If there is chop on a swing trading time frame either move to a day trading style or to a longer position trading style. Avoid the chop. The second thing to do is change your position sizing. What ever size you use for a swing trade, that can move day to day and get you stopped out at 3-4% lower, should be smaller to accommodate a wider stop for a position trade. Conversely if you move to a day trading style with tighter stops then you could increase your position sizing. the important thing to realize is that your position size needs to correspond with your stop, and your stop will be determined based upon your style of trading. Once these are set do not change them. You developed a trade based on a style, with a stop and position size suited for that style. If you change a day trade to a swing trade for example you will likely be carrying too much risk overnight, and a position trade to a swing trade then you may be taking profits too soon.

The third adjustment is to use options, if you are not already doing so. Stock replacement, buying in the money calls instead of stock, can shave 90% or more off the capital at risk in a trade. Using options collars can protect against measured downside risk. Selling premium in the form of covered calls can also lower your basis in a trade.

See the original article >>

Why the Safe Gains in US Stocks Are Behind Us

by Bill Bonner

Looking at the Big Picture

Step back. Look at the big picture. Stocks are near record highs. Investor sentiment has never been more bullish. The VIX, which shows the options market’s expectation of 30-day volatility in stocks, is near record lows.

But the US stock market – broadly measured by the S&P 500 – is “above the line” of our Simplified Trading System (STS). It’s trading above 20 times reported earnings. The index could go much higher. But our simple approach tells us that the safe gains are behind us. It is better to be out than in.

Yesterday, we imagined a man who had lived and invested throughout the entire 20th century. Today, we meet a man, in the flesh, who almost did that … a man 42 years older than we are. He makes 66 seem like childhood …

Irving Kahn is 108, to be exact. Born in 1906, he began investing before the 1929 Crash. He spotted the anomaly… and decided to take advantage of it. He sold US stocks short.

“I borrowed money from an in-law who was certain I would lose it but was still kind enough to lend it. He said only a fool would bet against the bull market.”

In the event, Kahn doubled his money. But he gave up speculation in favor of long-term value investing. In fact, he practically invented it.

USDJIND1930

The crash of 1929 and the bear market of the early 1930s – via Dharelynx – Irving Kahn shorted the bubble at the right time. Click to enlarge.

Dollars Selling for 50 Cents

Kahn was Ben Graham’s teaching assistant at Columbia; a Midwesterner named Warren was a student.

Said Kahn recently to British newspaper The Telegraph:

“In the 1930s Ben Graham and others developed security analysis and the concept of value investing, which has been the focus of my life ever since. Value investing was the blueprint for analytical investing, as opposed to speculation.

During the Great Depression, I could find stocks trading at tremendous discounts. I learnt from Ben Graham that one could study financial statements to find stocks that were a “dollar selling for 50 cents.” He called this the “margin of safety” and it’s still the most important concept related to risk.

Indeed, he uses the same approach today. During the recent crash and in other sell-offs, Tom and I looked for good companies selling at a discount, which do surface if you’re patient. If the market is overpriced, an investor must be willing to wait.”

That is the price you pay if you’re going to profit from our STS. You may wait a long time for the stock market to fall below 10 times earnings… and a long time for it to clear 20 times earnings.

Then, like now, you won’t want to sell. Because stocks are still going up! And if you do have the discipline to sell… you may regret it for years… as stock prices continue to rise and you are regarded as a numskull by everyone, including yourself.

Kahn does not believe in market timing. Instead, he looks for underpriced stocks. As the stock market rises, he finds fewer and fewer. At the extremes, a lack of good values forces him out of the market entirely.

That’s what happened to Warren Buffett in 1968, when US stock prices had gotten so high that he couldn’t find any way to use the money he had under management. What could he do? He sent the money back to its owners.

Buffett-photo

Warren Buffett – returned money to investors in 1968

(Photo credit: Javier, via flickr)

Why Is the Market Inefficient?

Our STS is for readers who are not going to do the difficult work of studying company filings to figure out where the value is. You’re just going to get in and out according to a rough measure of value – the stock market’s 12-month trailing P/E ratio – with no consideration of discounted income streams, debt levels, taxes or anything else.

As we saw yesterday, this approach would have greatly outperformed “buy and hold” over the last 114 years. But we still have an open question: How is it possible that this sort of opportunity exists – even for someone who doesn’t do the hard research?

How come there are still $100 bills lying around, waiting to be picked up, when there are so many smart people who should have picked them up already? Couldn’t Goldman Sachs hire a few mathematicians, program a few computers, and arbitrage away these gains?

We put the question to our colleague Porter Stansberry at Stansberry & Associates:

“So, the question is, why is the market inefficient, given all of the computers and all of the brains on Wall Street? How is it possible that little guys like us are still capable of outsmarting the big guns at Goldman?

Three explanations:

#1. They are conflicted.

Take my prediction that GM would go bankrupt. Here was a car company that hadn’t made a real profit in 20 years, was sitting on $400 billion in debt, and had more retirees on the payroll than workers. Seemed like a pretty simple bet to me.

However, Wall Street was making a lot of money selling GM bonds. There were huge incentives not to rock the boat. Likewise with my prediction about Fannie and Freddie going bust. Everyone on Wall Street was selling those clowns paper that was worth $0.20 for a full $1.00. Going along with the lie was more profitable than shorting the stocks could have ever been.

#2. Far too much opportunity cost.

Trying to arbitrage every minor discrepancy in value would take far too much capital. Firms that have tried to do this (Long-Term Capital Management) end up using far more capital than they can afford to borrow. There are just too many financial instruments to handicap. Likewise, there’s too much knowledge to manage to do so accurately and in a timely fashion.

#3. Far too much risk.

Even when investors possess superior knowledge, getting the timing right and managing all of the other variables is impossible.

Take my short sell of Netscape, for example. Back in 1999, I was shorting Netscape, which produced the first Web browser. Microsoft had begun “bundling” Web browsers inside its operating system, so nobody needed Netscape – which had given its software away and had no revenue model.

The stock was a zero. I was shorting it (personally, with real money) as it sank from $25 per share all the way down to $15. Then, I come into work one day with the news that AOL bought it, using stock, for $90 per share. I got wiped out.

And it wasn’t until about a year later that AOL’s stock collapsed, in large measure because it had been fudging all of its accounting. (They were budgeting marketing expenses on the capital account.)

I’m sure we’ll find that the market is least efficient (and we have the best opportunity to make outsized returns) when:

  1. We’re dealing in securities that have little or no following on Wall Street.
  2. We’re dealing with stocks that have been heavily promoted by Wall Street.
  3. We’re dealing with securities where we have an abundance of firsthand knowledge and experience.
  4. We’re dealing in industries where unusual amounts of expertise are required to follow it – insurance or biotech – for example.
  5. We focus our portfolios into only a few themes (foxholes) where we have an edge.”

Does that answer our question? It’s as good an answer as we’re going to get. But it doesn’t fully settle the question. If there are $100 bills lying in the street, there may be a reason – a reason you don’t see – why no one has picked them up.

Maybe no one is looking …

Maybe “The Street” wants you to believe they’re not there …

Maybe they’re too hard to see… or too hard to pick up …

And maybe they’re not really there at all! More to come, when we wrap up our series on how to invest intelligently in an uncertain world …

Lost and Confused Signpost

Say hello to uncertainty

The above article is from Diary of a Rogue Economist originally written for Bonner & Partners. Bill Bonner founded Agora, Inc in 1978. It has since grown into one of the largest independent newsletter publishing companies in the world. He has also written three New York Times bestselling books, Financial Reckoning Day, Empire of Debt and Mobs, Messiahs and Markets.

See the original article >>

Gold Sentiment Plunges to Summer 2013 Levels

by Pater Tenebrarum

Newsletter Writers Turn Very Bearish

This is a little addendum to our recent gold update. Shortly after we had posted it, Mark Hulbert published an article at Marketwatch regarding the recent moves in the Gold Newsletter Writer Sentiment Index (HGNSI). Note here that this sentiment measure must be seen in the context of market action. As we have pointed out previously, there have been a number of very significant ‘misses’ of this indicator, especially in early 2003 and early 2004, when following its message would have been a grave mistake.

However, there is also the fact to consider that today’s gold-focused newsletter writers are probably not the same bunch that was active 10 years ago. Many of those who were active in 2003 had survived a 20 year long bear market, so their collective judgment was at times actually quite good.

To Mr. Hulbert’s credit, we must concede that his indicator has worked better in recent years, and his interpretations of it in the course of this year have largely been on the mark. That’s actually a good thing, as the indicator is currently showing an extreme in negative sentiment.

Here is the chart:

1-HGNSI

Hulbert Gold Newsletter Writer Sentiment Index – currently it stands at – 40.6% – click to enlarge.

What the percentage means is that at the moment, gold timers are recommending that their clients allocate 40.6% of their gold-related assets to shorting gold. Although the measure fell to even lower levels in the summer of 2013 and also in 1998/1999 if memory serves, this is still a historically fairly extreme level.

Mr. Hulbert notes:

“Consider the average recommended gold market exposure level among a subset of short-term gold market timers tracked by the Hulbert Financial Digest (as measured by the Hulbert Gold Newsletter Sentiment Index, or HGNSI). This average currently stands at minus 40.6%, which means that the typical gold timer is recommending that clients allocate nearly half their gold-oriented portfolios to going short the market.

That’s a particularly aggressive bet that gold will keep declining, and — at least according to contrarian analysis — these timers are unlikely to be right. As recently as last week, the HGNSI had not fallen below minus 21.9%. That was less than the lows to which this sentiment index fell last December (minus 36.7%) and in the summer of 2013 (minus 56.7%). And that, in turn, led me to conclude that contrarians were not yet ready to bet on even a short-term rally.

[…]

The usual qualifications apply, of course. Sentiment is not the only thing that moves the markets. And even when contrarian analysis is right, it doesn’t necessarily have pinpoint accuracy. But, because sentiment analysis has been on the correct side of this gold market in recent months, it’s definitely noteworthy that it’s now more optimistic.”

(emphasis added)

Now for the context: since gold is mired in another short term downtrend, it is not surprising that bearishness is high. However, gold also remains above the lows made in 2013, and gold stocks have built multiple divergences with the gold price, in the process beginning to hold up somewhat better on a relative basis. So the context is at least to some extent a mixed bag and not entirely negative.

Note by the way that yesterday’s decline in cap-weighted gold stock indexes like HUI and XAU was distorted by Anglogold (AU) announcing that it will hive off its non-South African assets into a new company. Normally such an announcement would be seen as bullish for the stock, the problem is though that in order to get approval from the SA Reserve Bank for the deal, AU had to find a way to extinguish a lot of debt. In order to to that, it plans to do a very large share issue. That was not what the market wanted to hear, and the stock was clobbered by more than 15.5%.

Given that AU is one of the world’s largest gold mining firms, it has a pretty large weighting in the indexes and has been responsible for about 50% of yesterday’s decline. Needless to say, the timing of the announcement is a real head-scratcher. We have no idea why AU’s management decided to make it just as the stock was hitting multi-month lows. However, we have often seen such announcements being made at especially inopportune times. Apparently the managers of many gold mining companies don’t consider that it can actually cost shareholders money when such announcements are mistimed (since greater dilution will now be required than would otherwise be the case).

2-AU

AU crashes on news of a capital raise that has become necessary to receive SARB approval for its planned demerger – click to enlarge.

Other Sentiment and Positioning Data

Below is a quick overview of other sentiment and positioning data. Commitments of traders in gold have seen hedgers covering and speculators selling, and as of last week Tuesday, the net speculative long position (small and large speculators combined) stood at 103 K contracts. This is not very much compared to recent years, and it is highly likely that it will have become noticeably smaller in the meantime.

Note though that there is no telling where this indicator will go. If a new bear market leg lies ahead (i.e., a multi-week downtrend), then this position could conceivably be reversed altogether (from net long to net short). So it currently looks mildly encouraging compared to the levels of recent years, but it there is always the caveat that it can worsen further in the event of a more protracted bear market. Luckily for bulls, it coincides with the above mentioned extreme in the HGNSI and several other sentiment extremes – so at the very least the downside should be somewhat limited.

3-Gold-CoT

Commitments of traders in gold – the hedger net position in blue, the small speculator net position in red. The latter group is by now probably either flat or slightly net short (we are guessing, as this snapshot is more than a week old. Unfortunately the release of CoT data is not very timely) – click to enlarge.

Lastly, a look at the discounts to NAV of closed end bullion funds, as well as Rydex precious metals assets and cumulative cash flows. Normally we consider it better when these discounts contract, but when they hit what are historically extreme levels, then they serve as contrary indicators as well. Again, similar to what Mr. Hulbert notes w.r.t. the HGNSI, these are by no means very accurate timing indicators. They can only tell us whether there is froth or fear in the market, and right now there seems to be quite a bit of fear.

We’ve adapted a chart that was recently posted by Erin Swenlin (formerly of Decisionpoint, now with Stockcharts) and have left the trendlines she drew on the gold price chart in. It should be noted that the triangle formed over the past year or so with its two lower highs does not look particularly encouraging, so once again, it is not a big surprise that bearish sentiment is quite pronounced at the moment. While the long term chart picture is currently discouraging, it wouldn’t take much to turn it completely around. On the other hand, if the 2013 lows were to break, that would obviously be very bad news.

The engagement of Rydex traders in the sector meanwhile is reminiscent of 1999/2000. Note though that it is not enough that sentiment is bad – that by itself will not turn the market around.

4-Gold sentiment data

Discounts to NAV of CEF and GTU (two closed end bullion funds) plus Rydex precious metals assets and cumulative cash net cash flows – click to enlarge.

Conclusion:

Bulls should actually hope that these sentiment trends bottom out and reverse, but that a certain amount of skepticism remains if and when they do. However, in the meantime the relatively extreme levels of the data suggest that the potential additional downside should actually be limited in the short term. It then remains to be seen how things evolve in the next bounce.

Addendum:

Note that this article was written prior to Thursday’s market open, so the charts reflect Wednesday’s close. Thursday’s market action does however not substantially alter the situation described above, except insofar that it can be inferred that several of the data points may have deteriorated slightly further.

See the original article >>

What If the Easy Money Is Now on the Bear Side?

by Charles Hugh Smith

Complacent melt-ups aren't just boring--they're not very profitable.


File this under Devil's Advocate: what if the easy money in the stock market is no longer the "guaranteed" Bull melt-up but the Bearish bet on a sudden air pocket?Just as a thought experiment, put yourself in the shoes of the money managers who have the leverage to move the markets.

You probably know the drill: program your trading bots to recognize every technical trading scheme's key support and resistance levels, and then unleash huge futures/options buys after hours or pre-open so the market jumps in the direction that makes you the most money.

Unleashing a tsunami of buy orders forces Bears to cover their bets on a decline (shorts), goosing the market higher. The melt-up depends not just on trading bots hammering the market in the desired direction with massive buy orders--it depends on a supply of nervous Bears to cover their shorts by buying stocks. This buying triggers others' trading bots to buy into the rally.

Short-covering is an essential source of the self-reinforcing buying that has kept the U.S. market melting up for years without any gyrations down of more than a few percentage points.

Buy the dips has entered the Pavlovian realm of automatic response because the managed tsunamis of futures/options force those betting on a decline to cover their shorts by buying, pumping the rally up with steroid-like buying.

The problem with this guaranteed melt-up is the unceasing advance and immediate buy the dip response has decimated the ranks of Bears willing to bet against the melt-up. This has removed one of the primary fuel sources of the melt-up.

In other words, the managers' great success with forcing Bears to seek cover has drained a key reservoir of buying power. Eradicating the Bears has all been jolly good sport, but it has also reduced the shorts who can be forced to cover, which means the market is left with only the managers' manipulations and the other institutional trading bots that follow trends.

Consider this chart of the Rydex ratio of Bear/Bull assets, from John Hampson:


If Market Bears were tallied, they'd be on the list of Endangered Species. There is some confusion about the true number of Bears left, as prudent money managers may buy puts (bets on a market decline) to hedge their portfolios. As a result, a mass of put buying may reflect hedging, not Bearish bets.

The net result of eradicating the Bears is the gains from the melt-up are now limited. If you're a serious manager of serious money, squeezing out a couple of points from the melt-up is not only boring--it's detrimental to your career, because you need to beat the index melt-up to keep your big-bucks job and skim your payoff.

Which leads to the notion that the really big money waiting to be skimmed from the unwary is not more melt-up but a sudden "unexpected" meltdown that catches everyone who isn't short off-guard. The most profitable trade would be to stealthily build a short position while telling everyone else how the melt-up was guaranteed essentially forever ("the Fed, ECB and Bank of Japan have your back," etc.).

To make sure nobody strayed from the long side of the boat, you'd unleash the usual frenzy of buy orders at every dip, because the last thing you'd want is to give anyone else an easy entry to the Bearish short side.

The ideal situation is a boat heavily tilted to one side with complacent Bulls confident in the continuation of the never-ending melt-up, and only yourself and a few insider cronies on the short side.

Then, when all the Bulls are happily swapping stories about how the yen carry trade guarantees capital flows into U.S. equities and other Bull stories--

BANG! You unleash a tsunami of sell orders that triggers all the trend-following trading bots to sell. When the buy the dip crowd confidently enters their buy orders, you crush them with a load of futures and options orders that reverse the uptick. This triggers another wave of bot selling.

Since there are no Bears left except you and your cronies, the buy the dip retraces have no legs: they quickly peter out because no Bears are left to spark short-covering buying.

Since there are no Bears left, there's only the trading bots programmed to follow trends: and with your leverage and bag of tricks, that trend can go down faster than complacent Bulls thought possible.

Then, when the Bulls are stampeding in panic selling, you cover your Bear bets and start buying from the panic-stricken Bulls. The Hobby Bears who went short near the bottom are forced to cover as your buying turns the tide, and the market is soon in full recovery mode.

This is such an obvious (and immensely profitable) play, I'm surprised we haven't seen it more often. Complacent melt-ups aren't just boring--they're not very profitable.

See the original article >>

Party Hardy

by Marketanthropology

With the most recent push higher in the Nikkei, Japan finds itself at a threshold opening that has rejected their equity market advances over the past three decades. Throughout the year, on both sides of the field (see Here), we have followed the momentum comparative of the Nikkei's 1987-1988 rejection and recovery. Similar to our Meridian work with the SPX that also extends from 1987, this time period as well marks the upper-pivot of the declining resistance trend, the Nikkei has strictly adhered to and been rejected by since making its historic peak in late December 1989.

In our most recent note on Japan (see Here), we had described that the Nikkei was following a similar recovery pattern that our own equity markets had taken at pivotal times - most recently in 2011. What they all had in common - with varying proportions, was that momentum was quickly restored to the upside, once the retracement decline was completed.

From our perspective, it appears the Nikkei will loose its deflationary shackles, just in time to celebrate its twenty-fifth anniversary this Christmas. Coincidentally, it took the S&P 500 twenty-five years to the month to break above its nominal high from 1929. While the lay of the land is much different for the Nikkei and Japan today, perhaps similar to the US generation born during the Great Depression and World War II, historians will eventually refer to those brought up in Japan over the previous two decades as the "Lucky Few" as well. History repeats - often with a great sense of irony.

With Draghi recently breaking the glass and pulling the QE fire alarm, he's attempting to startle some of Europe's markets out of their respective cyclical peaks and deflationary glide-paths, we believe they have been moving towards this year. Will it work? We remain skeptical, and look towards Japan's initial efforts that broadly failed at maintaining momentum in their capital markets. As Paul McCulley aptly describes in his latest note for September (must read - see Here), it is a Hobson's choice - and one that theoretically, "should never be on the table, if the fiscal authority is willing and able to party hardy..."

Considering the many disparate economies, players and opinions around that table today in Europe, the amount of libations needed to imbibe and maintain the festive atmosphere will likely need to be significantly larger than what was initially floated. Don't get us wrong, it was really nice to receive the invitation - it's another thing entirely when folks show up at the party.

See the original article >>


Follow Us