Saturday, September 3, 2011

Macro Week in Review/Preview September 3, 2011


Last week’s review of the macro market indicators looked like the unofficial last week of Summer would bring Gold to bounce around in its uptrend while Crude Oil slowed at resistance and turned lower. The US Dollar Index seemed content to move sideways while US Treasuries were biased lower. The Shanghai Composite and Emerging Markets were biased to the downside with risk of the Chinese market running a little higher first. Volatility looked to remain elevated keeping the bias lower for the equity index ETF’s SPY, IWM and QQQ, despite the moves higher the previous week, with the QQQ looking to have the best chance to break the bear flags higher.

The week began with Gold meandering sideways and Crude Oil hitting the breaks at resistance. The US Dollar Index was behaving as anticipated but US Treasuries were finding some support. The Shanghai Composite drifted lower while Emerging Markets caught a bid and moved higher. Volatility tailed off but only marginally as the Equity Indexes SPY, IWM and QQQ rose. And then Friday happened pushing Gold and Bonds higher and Crude Oil and Equities lower. What does this mean for the coming week? Lets look at some charts.

As always you can see details of individual charts and more on my StockTwits feed and on chartly.)
Gold Daily, $GC_F

Gold Weekly, $GC_F

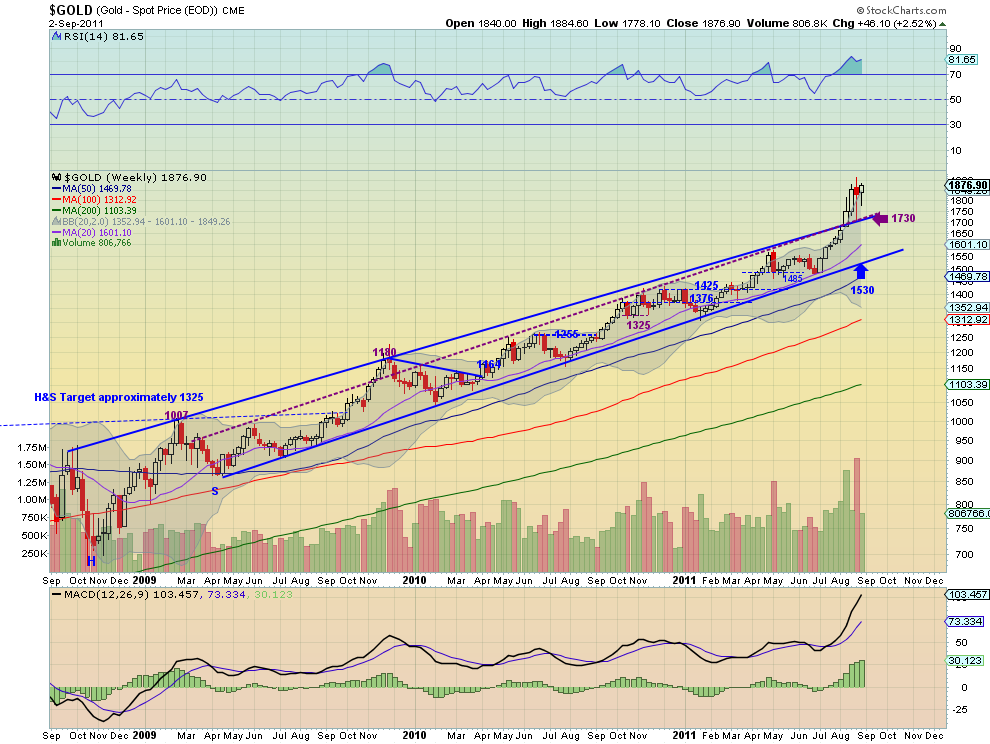
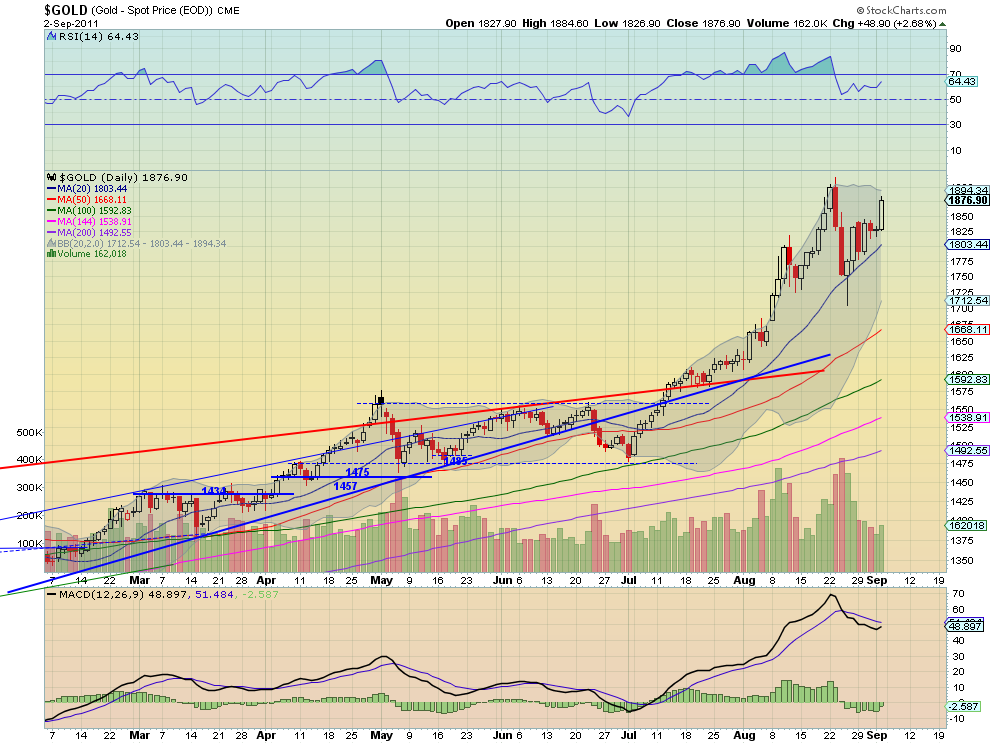
Gold spent most of the week building an ascending triangle under resistance of 1840 before launching over it on Friday to resistance near 1875. The daily chart shows a Relative Strength Index (RSI) that held well over the mid line and is moving higher and a Moving Average Convergence Divergence (MACD) indicator that is about to cross positive. The weekly chart remains bullish with upward sloping Simple Moving Averages (SMA), a MACD that is increasing and a RSI that remains high. The only concern about more upside in these charts is that the weekly RSI is over 80, and volume has been decreasing, but not a reason to sell. The triangle break has a target of 1930 with resistance at 1900 along the way. Look for Gold to head toward that target and possibly beyond in the coming week to the Measured Move (MM) of 2225 if it gets over 1940. Any pullback should find support at 1840 and 1800 below that.
West Texas Intermediate Crude Daily, $CL_F

West Texas Intermediate Crude Weekly, $CL_F
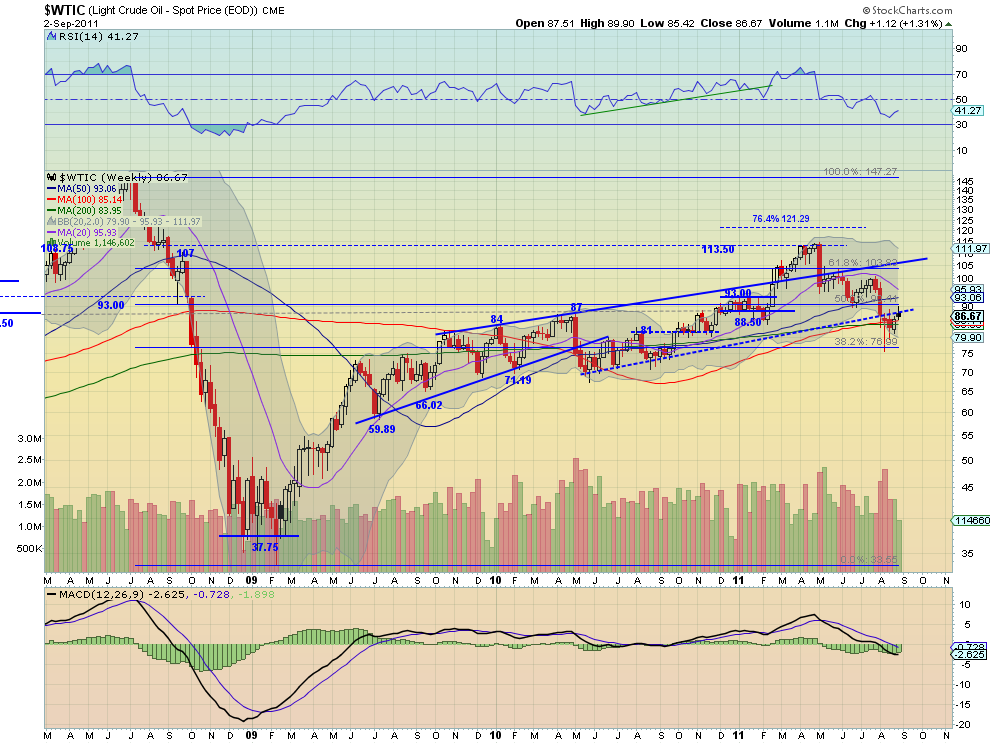
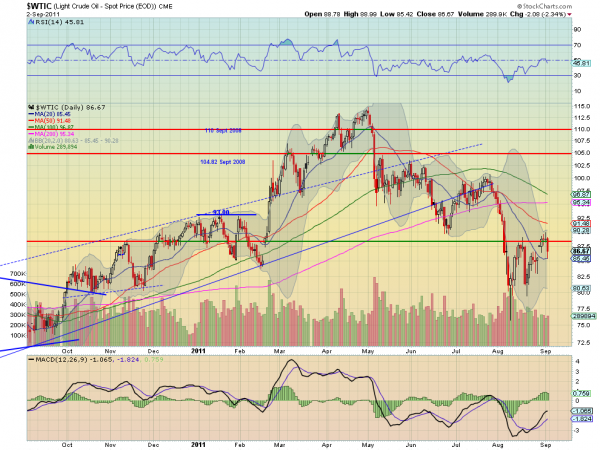
Crude Oil found resistance at the long term support/resistance line at 88.50 and fell back Friday. The RSI on the daily chart is now rolled lower and pointing down and the MACD is starting to fade. The SMA’s have been successively rolling lower also with only the 200 day SMA left. The weekly chart reinforces the rejection with the rising resistance line, but shows both the 100 and 200 week SMA as support underneath. The RSI on this timeframe has been trending lower but currently cricked higher, while the MACD is negative but has been flat. Look for Crude to continue lower next week toward support at 84. A move below 81 would trigger the next leg down with a target of 77. Any move above 88.5 will find resistance at 90.
US Dollar Index Daily, $DX_F

US Dollar Index Weekly, $DX_F

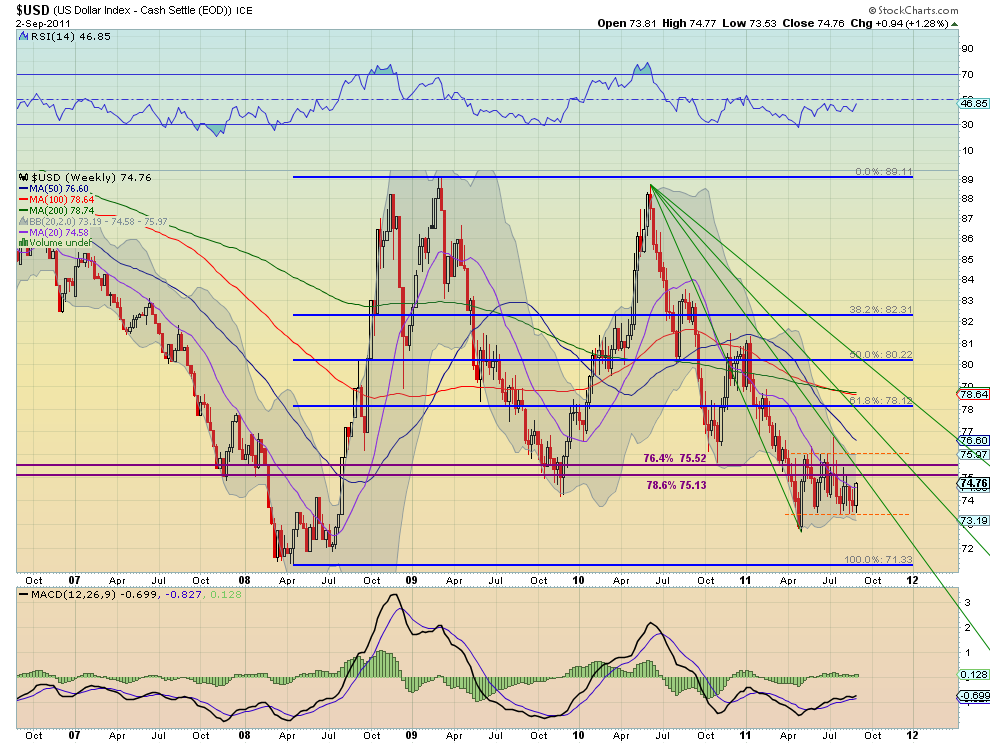
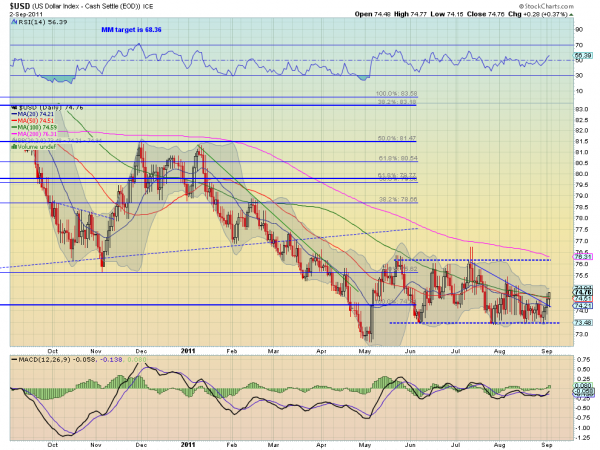
The US Dollar Index broke higher above the descending triangle with in the 73.50 to 76 channel this week. It has a RSI on the daily chart that is rising and a MACD that has crossed positive, both suggesting more upside to come. The weekly chart is more middle of the road looking with the range in tact and the RSI shuffling along just below the mid line while the MACD stays near zero as it moves one week closer to the first Fibonacci fan line. Look for the Index to spend time in the top half of the channel next week. Any move over 76 should find resistance at 77.50 and a move below 73.5 support at 73 and 72.
iShares Barclays 20+ Yr Treasury Bond Fund Daily, $TLT

iShares Barclays 20+ Yr Treasury Bond Fund Weekly, $TLT
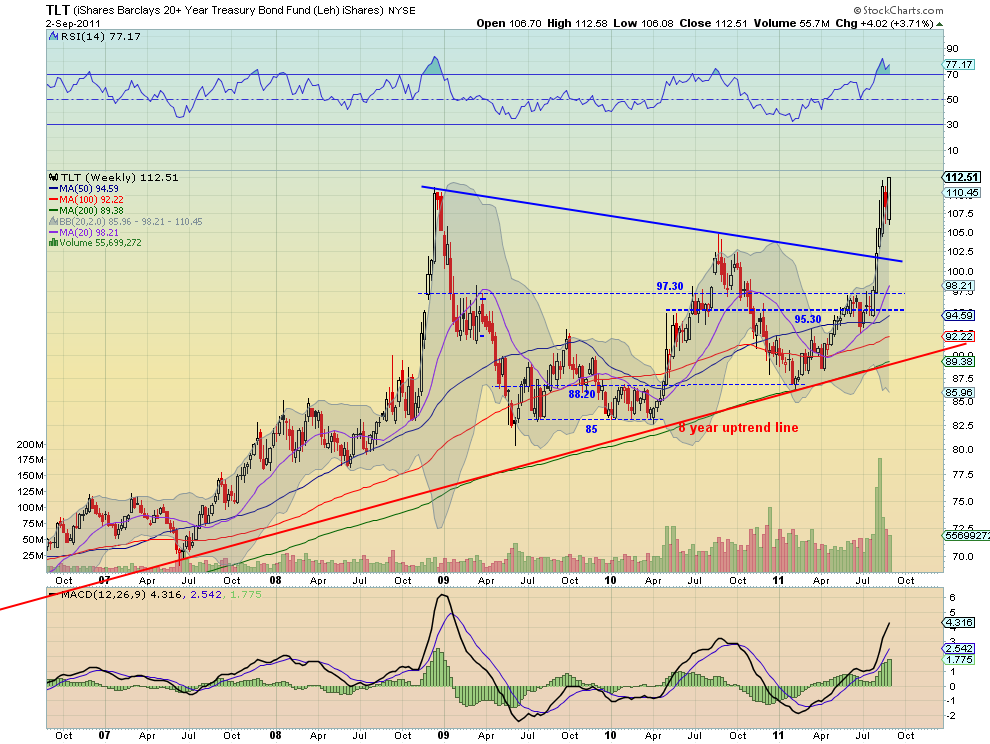
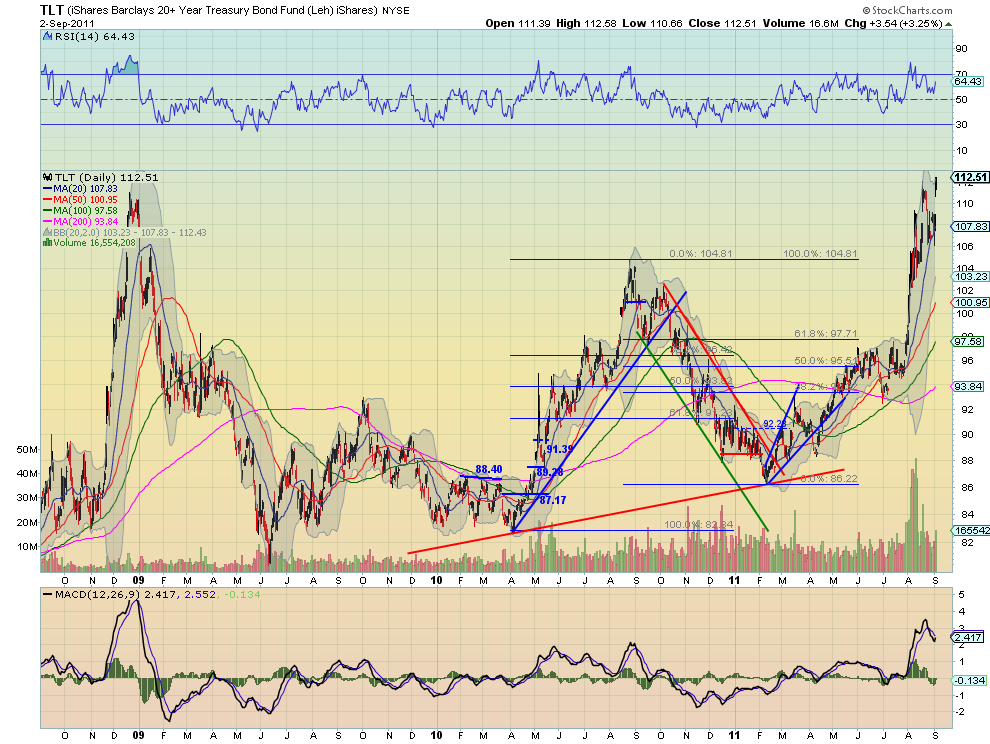
US Treasuries, as measured by the ETF $TLT, consolidated higher for most of the week before breaking to new highs on Friday. The RSI is in bullish territory and currently rising while the MACD has moved back to the zero line and looks ready to cross higher, on the daily chart. The weekly chart shows a strong white candle closing nearly on the high in a bull flag. The RSI is elevated but not extreme at 77.17 and the MACD continues to increase. Look for more upside in Treasuries next week with targets higher on a MM to 120.70 and then 137 from the symmetrical triangle pattern breakout on the weekly chart. Any downside move should find support before 104.80 at either 108 or 106.
Shanghai Stock Exchange Composite Daily, $SSEC

Shanghai Stock Exchange Composite Weekly, $SSEC
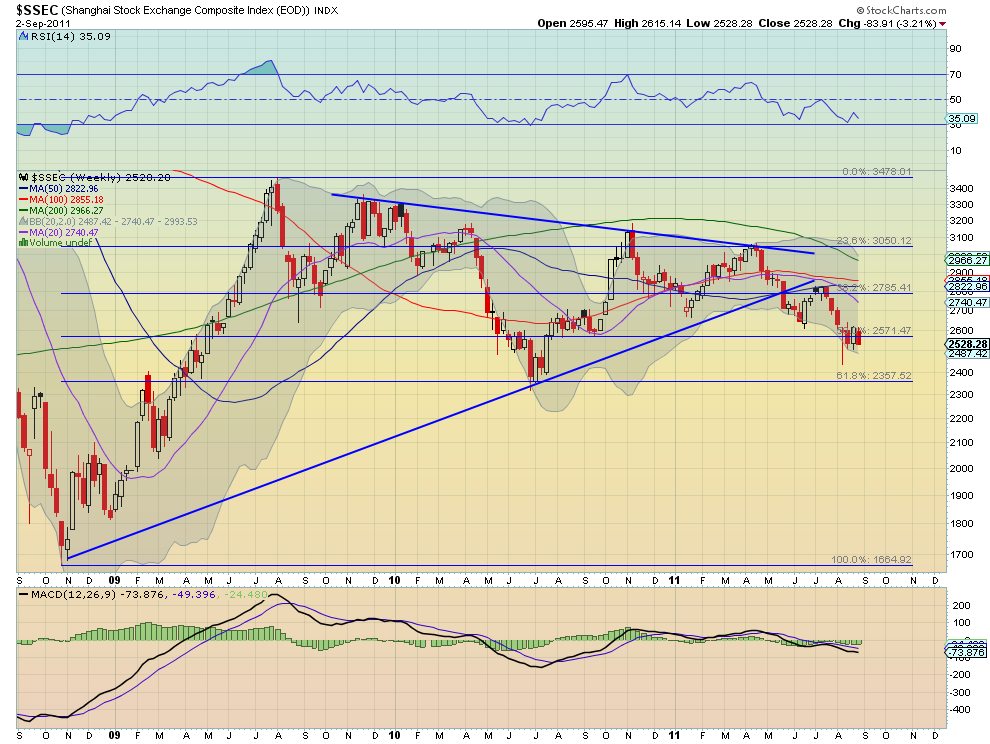
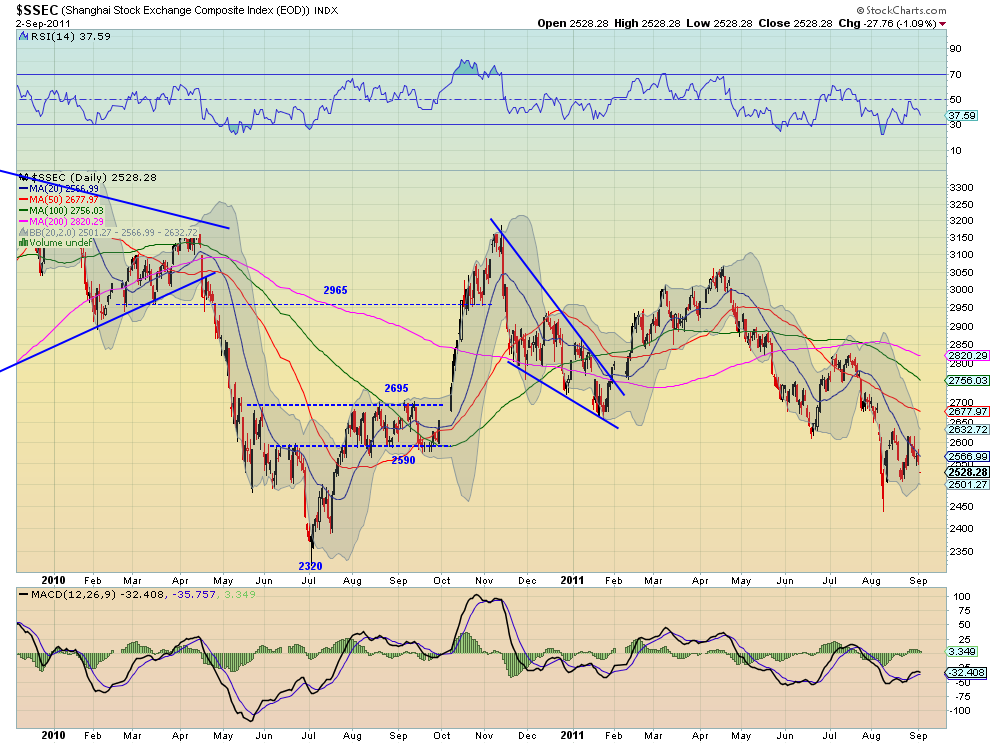
The Shanghai Composite is in a bear flag or continuation symmetrical triangle and moved lower in it this week. The daily chart shows the RSI indicating for more downside with a MACD that is rather flat. The weekly chart shows the flag is right at the 50% Fibonacci level of 2571 form the move up from 2008 to 2009. The RSI is heading lower and the MACD is flat on this timeframe. Look for more downside in the coming week with support lower at 2500 and then 2450. A break below that leads to a test of the 61.8% Fibonacci at 2357 and a target on the MM lower at 2260. Any upside surprise should find resistance at 2590 and then 2695-2700.
iShares MSCI Emerging Markets Index Daily, $EEM

iShares MSCI Emerging Markets Index Weekly, $EEM

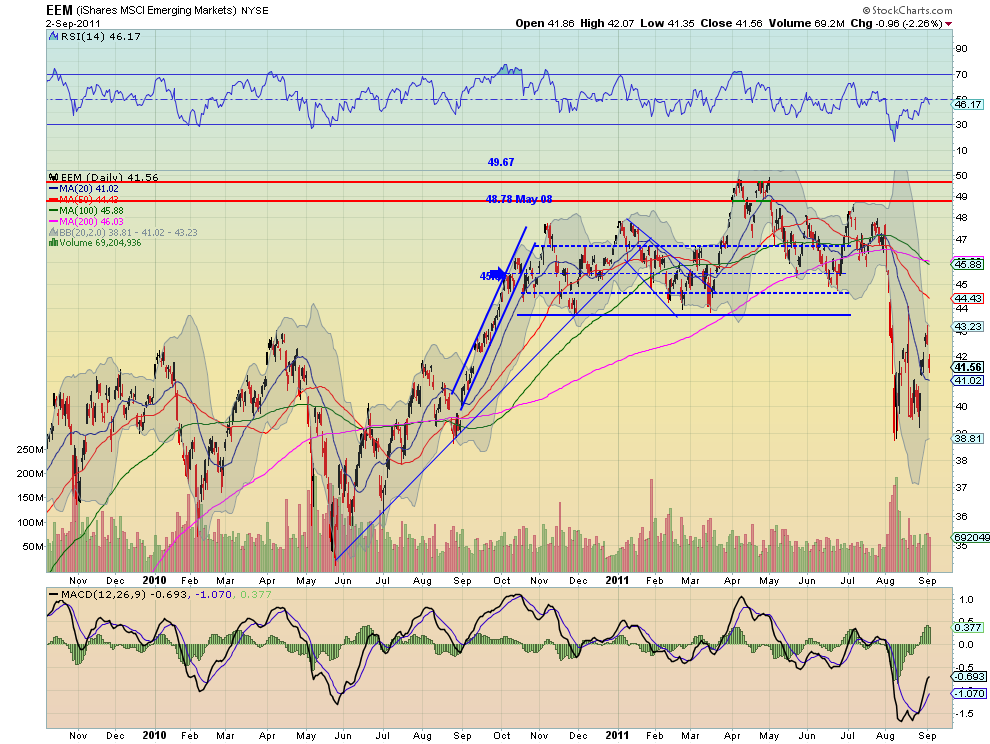
Emerging Markets, as measured by the ETF $EEM, made a move higher early in the week only to be contained by what might be the beginnings of a symmetrical triangle as resistance and close lower Friday. The RSI met the mid line and rejected lower while the MACD peaked and is now waning on the daily chart, with all of the SMA’s sloping lower. The weekly chart shows the reach higher with the long shadowed candle but unable to hold over the 42.54 support/resistance level. The RSI is suggesting upside on this timeframe and the MACD is starting to improve. The path in the short run looks lower with any upside contained at 42.54 with a hold over that level leading to a shift in thinking. Next week support comes at 39 and a break below that puts a move to to support at 35.91 on the way to a MM at 32 into play.

VIX Daily, $VIX

VIX Weekly, $VIX

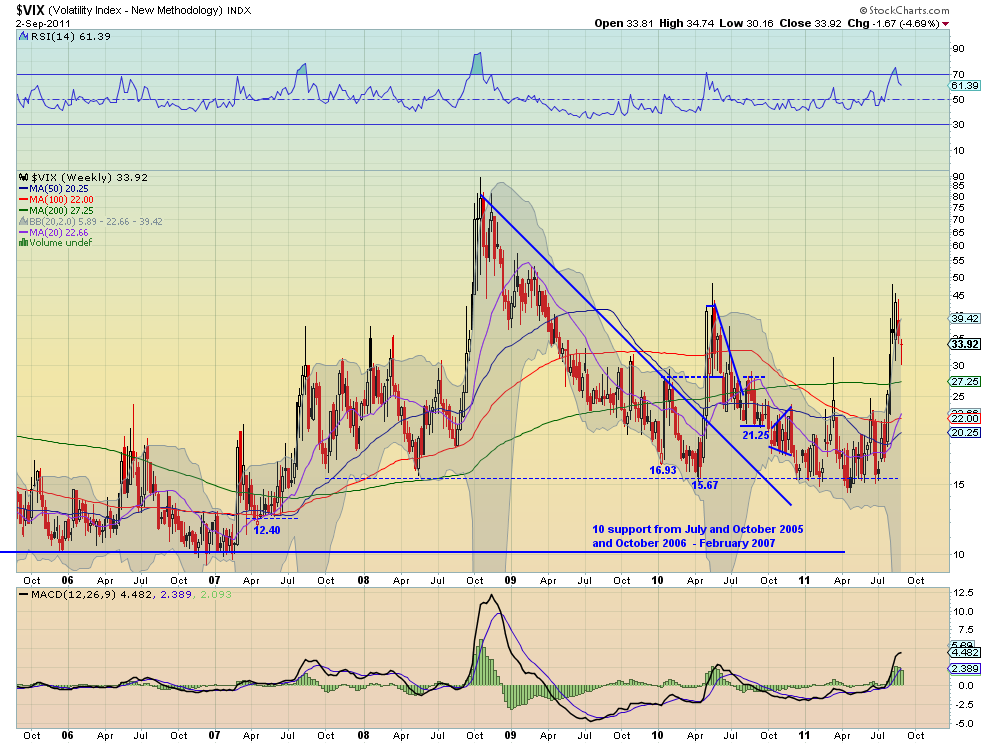
The Volatility Index pulled back but held support at 30 before rising to close the week. The RSI on the daily chart bounced higher after hitting the mid line and the MACD peaked negative and is now improving. The weekly chart has the RSI falling and the MACD starting to move back toward zero. Divergence between timeframes. Look for volatility to remain elevated relative to the first 7 months of the year but a move below 28 could change that quickly. Conversely a move over 38 should lead to a retest of the 44 to 48 range. Look for more in the 28 – 38 range next week.
SPY Daily, $SPY

SPY Weekly, $SPY

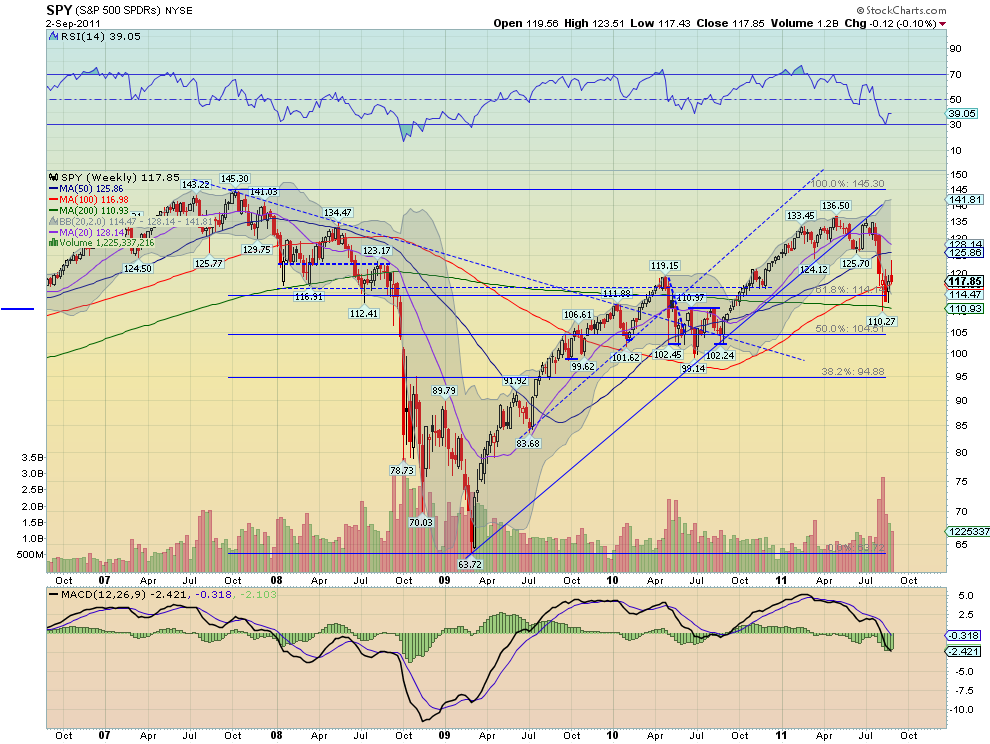
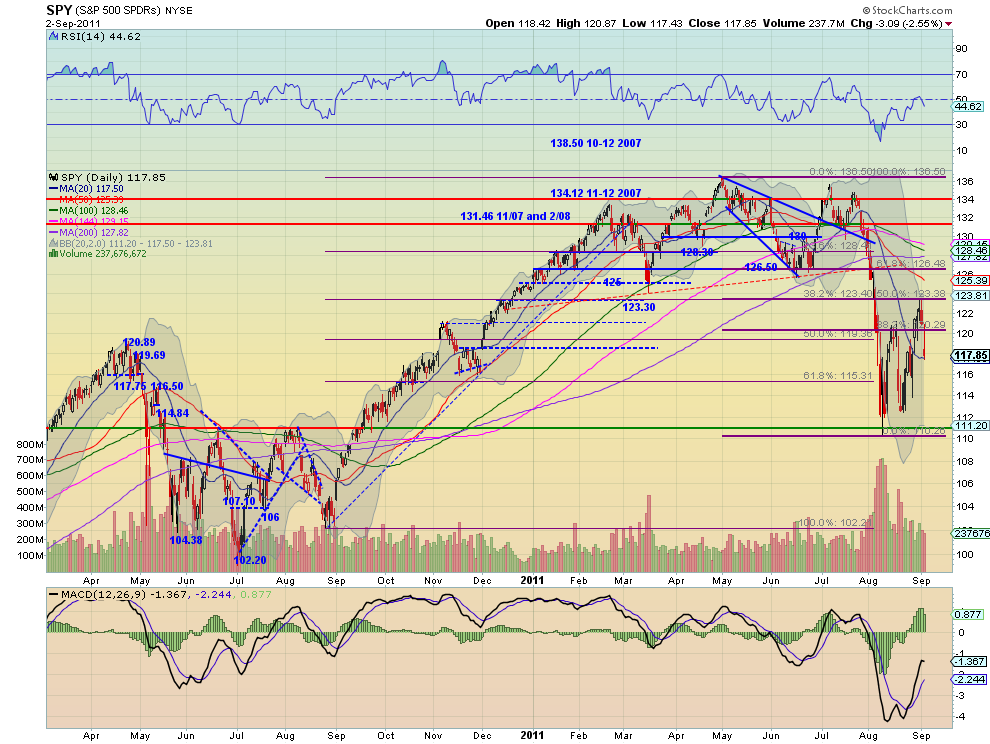
The SPY rose early in the week but fell hard Friday after printing a Tweezers Top with topping tails halting at the 20 day SMA. The RSI on the daily chart turned lower at the mid line and the MACD is waning. On the weekly chart the long upper shadow may be foreshadowing more down side out of the bear flag. The RSI however is rising off of the low and the MACD is improving on this time frame. The trend is lower and look for that to continue next week with any upside move held at 121.50 or 123.40 above that. Any more and the down trend is in question. To the downside if support at 112.4 does not hold then the next levels down for support come at 111.15 and 104 on the way to the MM target of about 95.
IWM Daily, $IWM

IWM Weekly, $IWM

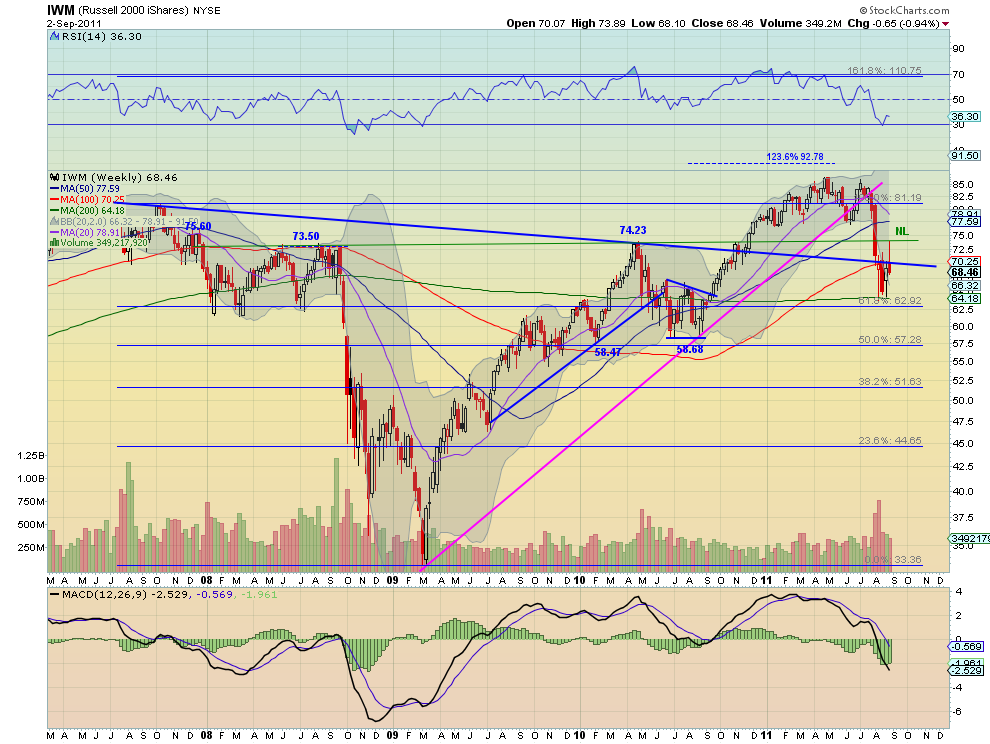
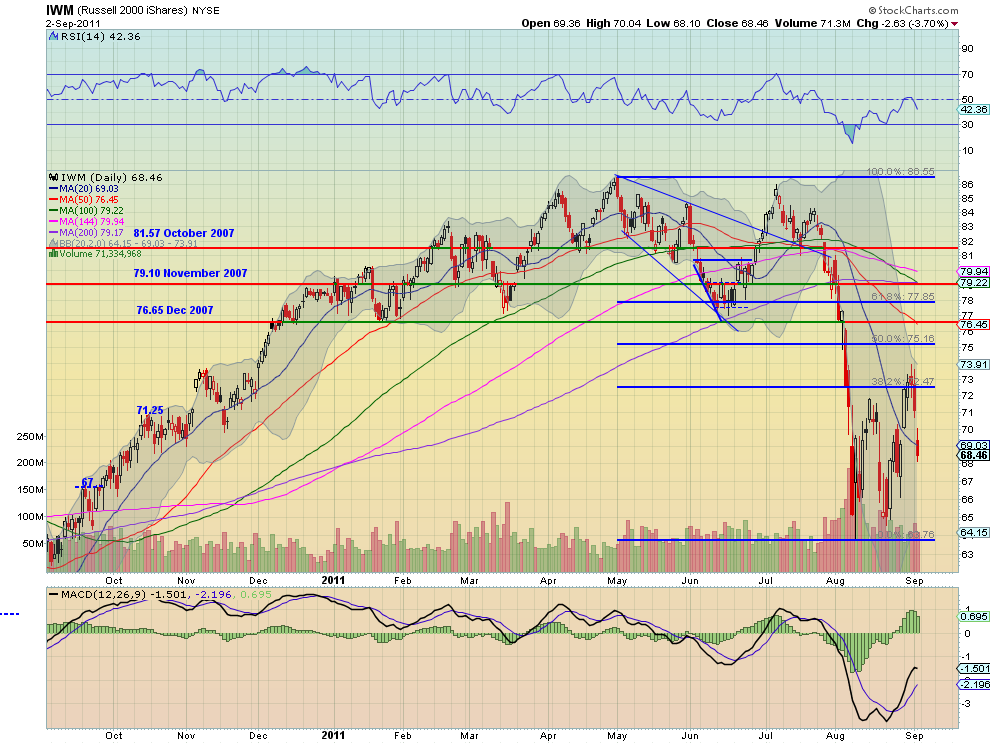
The IWM rose early in the week but also crashed Friday after printing a topping tails at the 38.2% Fibonacci retracement of the move lower, halting under the 20 day SMA. The RSI on the daily chart turned lower at the mid line and the MACD is waning. On the weekly chart the long upper shadow at the extended neckline of the previous inverse Head and Shoulders is showing more down side out of the bear flag. The RSI is rising off of the low but cricking back down and the MACD is improving on this time frame. The trend is lower for next week with any upside move held at 71.60 or 73.60 above that. Any more and the down trend is in question. If the downside support at 65 does not hold then the next level down for support comes at 62.8 on the way to the MM target of about 48.
QQQ Daily, $QQQ

QQQ Weekly, $QQQ

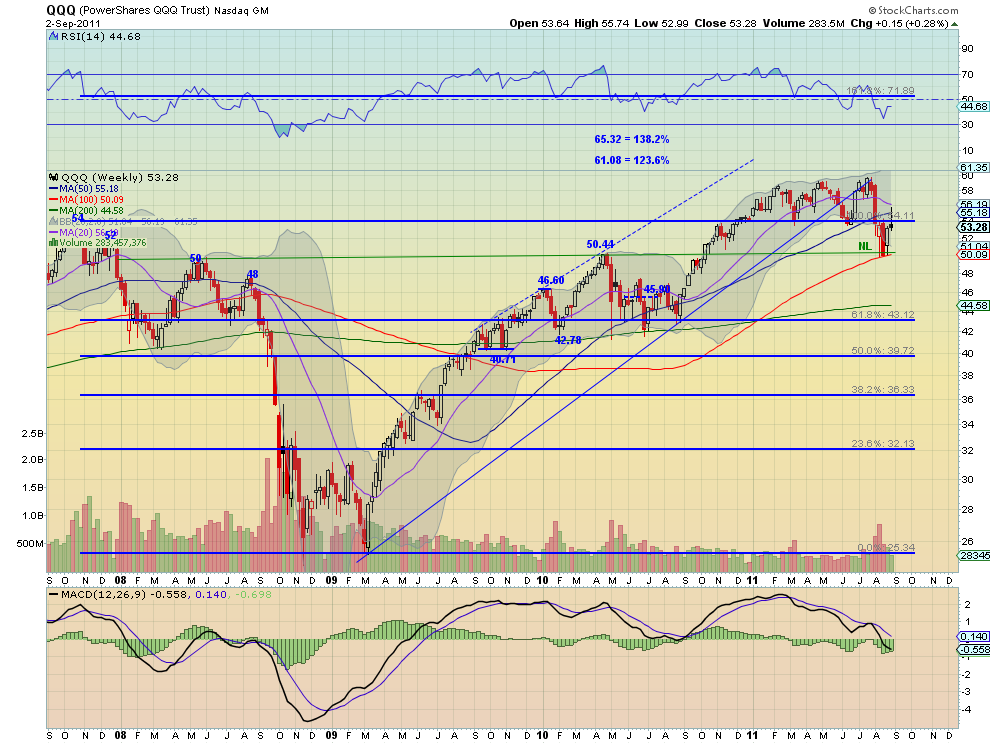
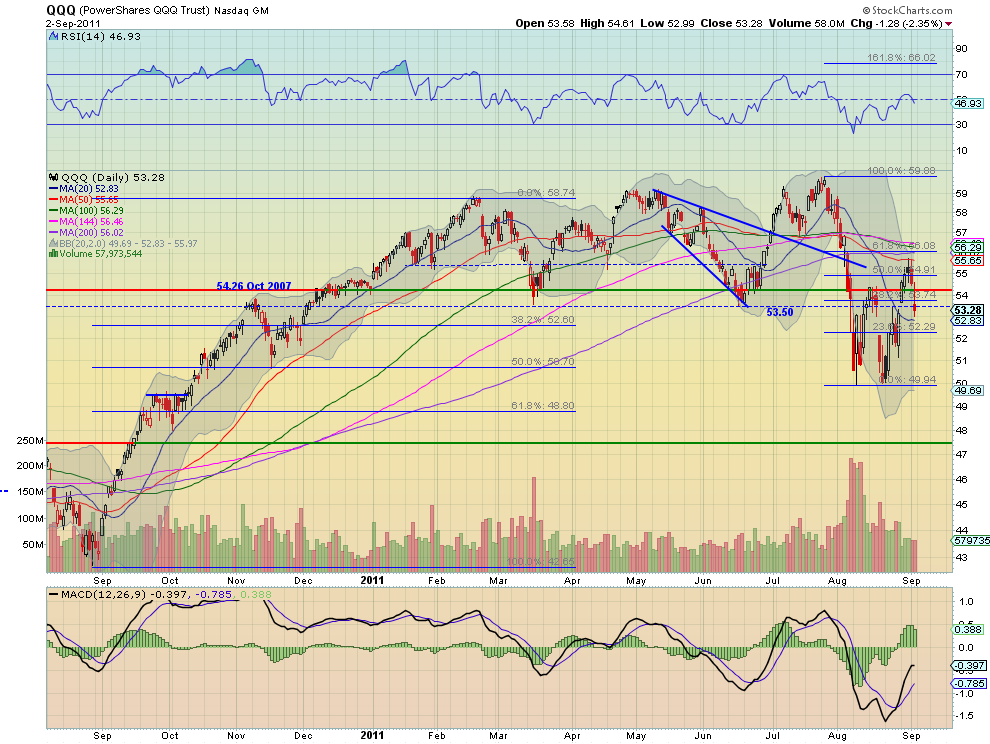
The QQQ also rose early and fell hard Friday after a Tweezers Top with topping tails at the 50 day SMA halting just above the 20 day SMA. The RSI on the daily chart turned lower under the mid line and the MACD is waning. On the weekly chart the long upper shadow may be foreshadowing more down side out of the bear flag. The RSI however is rising off of the low but cricking lower again and the MACD is improving. The trend is lower for next week with any upside move held at 54.26 or 55.50 above that. Any more and the down trend is in question. if the downside support at 50.00 does not hold then the next levels down for support come at 48 and 46 on the way to the MM target of about 40.

Next week looks like the moves that revealed themselves Friday will continue. Gold and US Treasuries are ready to continue higher. Crude Oil looks poised to drop further and the US Dollar Index to move sideways in the top of its range. The Shanghai Composite and Emerging Markets look to continue lower. Volatility looks to continue elevated with the US Equity Index ETF’s SPY, IWM and QQQ ready to continue lower in their bear flags. US Treasuries breaking out and Gold racing higher again could be the catalyst for a break of the bear flags lower. Use this information as you prepare for the coming week and trade’m well.

What's Driving the Selloff?

by Bespoke Investment Group

The average stock in the S&P 500 is down 4.61% over the last two days. We wanted to see how a stock's performance during the 8%+ rally from 8/22 to 8/31 has impacted performance since 8/31. To do this, we broke the S&P 500 into deciles (10 groups of 50 stocks each) based on performance during the rally, and then calculated the average performance of stocks in each deciles during the current 2-day selloff.

As shown below, the better a stock performed during the rally, the more it has gone down during the pullback. The 50 stocks that went up the most from 8/22 to 8/31 are down an average of 6.40% since 8/31. Conversely, the 50 stocks that went up the least from 8/22 to 8/31 are only down an average of 2.28%. Investors have clearly been selling their winners over the past two days.


See the original article >>

The Week Ahead: This Is No Vacation for Investors


This is going to be a long weekend as we wait for the markets to reopen on Tuesday, but there are some bright spots, writes MoneyShow.com senior editor Tom Aspray.

Last week, the hopes that the economy was not really that bad were supported by some of the economic data (such as auto sales) turning out better than expected.

The tone changed Thursday, as stocks opened weak, then rebounded sharply as the ISM Purchasing manager’s report came in stronger than expected.

The rebound was short-lived. New concerns over Bank or America (BAC) and Goldman Sachs (GS) helped stocks to reverse to the downside. The very weak close suggested that the rebound from the August lows was likely over.

Then the dismal monthly jobs report hit stocks hard Friday, as stocks opened sharply lower and the major averages closed near the lows.

The rally was classic in technical terms, as the Spyder Trust (SPY) came very close to retracing 50% of the decline from the July highs. Most of the major averages traced out flag formations, which are normally seen as interruptions in the downward weekly trend. I will share some more specifics below.
chart
Click to Enlarge

The key question is whether the support zones derived from the recent rally will hold. If they do, we could see the formation of a short-term double bottom that would set the stage for a better rally.

The other alternative is that we will crash below the August lows and head to stronger support, but well below current levels.

There are some conflicting seasonal and historical trends that may give us some insight. The chart above, from The New York Times, shows that the third year of a presidential cycle is normally the best for stocks, showing a median gain of 18% since 1946—and 94% of the time, stocks rose in the third year.

To give you some perspective, the S&P 500 closed 2010 at 1,257.64, and is currently about 6.2% below this level.
chart
Click to Enlarge

This clearly casts a positive historical light on the last quarter of the year…but first we have to survive September.

As this second chart reveals, over the past 40 years September has been the worst month of the year by a significant margin. February was the only other consistently lower month.

The sharply lower close in the US is likely to set the stage for further weakness after the holiday. It is thus likely that the global markets may be hit Monday, so this could carry over to Tuesday’s opening in the US.

Of course, we may try to stabilize by mid-week, as the nation gets ready for President Obama’s Thursday night speech.

With the negative trend in the economic reports over the past month, the market may not be ready for the ISM Non-Manufacturing Report due out on Tuesday. The rest of the week is pretty light, with the ICSC-Goldman store sales and the Beige Book out on Wednesday.

On Thursday, we get the weekly unemployment claims and data on international trade. Ben Bernanke is also scheduled to speak in the afternoon, with Obama on tap that night.

WHAT TO WATCH
chart
Click to Enlarge

As I discussed early last week, many of the major commodity indices and the broad-based commodity ETFs and ETNs appear to have completed their corrections.

This may have important implications for some of the emerging markets, as many have charts that are much more constructive than those of the US or European market averages. One of the best continues to be Indonesia; the chart of the Market Vectors Indonesian Market Index (IDX) shows that the early August drop just took it back to its long-term uptrend (line a)
.
The weekly RS analysis is in a strong uptrend, as IDX continues to outperform the S&P 500. The weekly OBV is acting much stronger than prices, and it made a new high this week even though IDX is almost 10% below the July high of $34.99. This makes a new high in IDX very likely.

Stocks are likely to decline into the middle of the week. If stocks can then rally sharply, the technical outlook will improve.

The Spyder Trust (SPY) gapped lower Friday and closed near the lows. There is further support in the $116 to $117 area, with the uptrend (line d) in the $114.70 area.

A close below this support will suggest a decline to at least $112.40, if not the August lows at $110.27.
 
The rally reached the upper boundary of the flag formation (line c) and came within 20 cents of the 50% Fibonacci retracement resistance.

The McClellan oscillator, which hit a low of -446 in early August, rebounded all the way to +266 last Wednesday before turning lower Thursday. It closed Friday in the +60 area, and has broken its uptrend (line e).

Russell 2000

The small cap iShares Russell 2000 Index Fund (IWM) also peaked Wednesday, and followed Thursday’s weak close with a gap to the downside. There is minor support now at $66.50 to $67.50, with the lower boundary of its flag formation at $65.43.

The downside target from the flag formation is in the $56 area. There is a band of strong resistance now in the $71.40 to $74 area.

The Russell 2000 A/D line has just rebounded to resistance, and have now turned lower. It is acting weaker than prices, as it is closer to the August lows.

See the original article >>

SPX Reversal Confirmed


Last chart of the Day. Yesterday’s reversal was confirmed today. Let’s see the action tomorrow. The retracement from the early August collapse topped out at 50%, and we should be looking for new legs down in the coming days.


See the original article >>

US Debt Graphics


BEAR MARKET RULES APPLY

By Carl Swenlin

It is a concept that we stress on a periodic basis, and we got another illustration this week. Technical indicators must be interpreted within the context of the overall market trend.
 
On August 17 the S&P 500 Index 50-EMA crossed down through the 200-EMA, declairing by our definition that the long-term trend was down and that we were in a bear market. When this happens, we remind ourselves that “bear market rules apply,” and that we should expect negative outcomes more often than positive ones.

As of yesterday many of our short-term indicators were overbought and topping — the chart below shows what the STO-B and STO-V looked like yesterday. And even though prices had broken above the previous August top, we expressed doubts about the viability of the rally in our daily blog because internals were negative.
Chart
While we just recently had technical confirmation that we are in a bear market, the bear has actually been around since the May 2 top, and the coincidence of price and indicator tops was an early clue that the up trend had stalled and may have been in trouble. Since the price break in August we need to consider overbought indicator tops as being cracks in thin ice.

S&P500 Takes the “Road Not Taken”

By Global Macro Monitor

Robert Frost may have been the greatest contrarian trader, no?

Our post of August 22nd, S&P500 Faces a Fork in the Road, noted the S&P500 faced a fork in the road. One path, the 2010 bullish trajectory bolstered by Jackson Hole; the other, the bearish 2008 trajectory, the result of, say, a European sovereign induced banking crisis.

From the post to yesterday’s close, the S&P500 was up almost 8.5 percent generating its “best eight-day gain since 2009.“ Not a lot of fundamental news to explain the rally so let’s just call it for what it is/was, a Robert Frost rally.

The road not taken, less crowded, and most shorted was the path of least resistance in a quiet market with very little macro headlines. We noted hedge funds, some with almost no tolerance for short-term pain, had opened their biggest net short positions in the S&P500 since early 2008. Hence the rally.
Where to now? We’re not certain, but Bespoke does note September is the cruelest month for stocks, the S&P500 is having trouble at 1230, which is right at the 50 percent retracement of the recent crash, and the Europeans will be returning from their holiday at Swan Lake.

Even given our uncertainty where equities are headed, we note most global stock indices have attempted to put in W bottoms and it therefore essential the August 9th 1101 low on the S&P500 holds. Our sense, however, volatility is about to pick up in the next two months. Our best guess is the S&P500 and other equity indices will enter an expanding triangle pattern (see chart below) in September and October before deciding how to close the year. Best to buckle up. But, hey, what do we know?
>


See the original article >>

Labor’s Dwindling Share of the Economy and the Crisis of Advanced Capitalism

By Guest Author

Charles Hugh Smith publishes Foreclosure Crisis Weekly, dedicated to documenting the often-amazing foreclosure crisis.


All attempts to reform the Status Quo of advanced finance-based Capitalism will fail, as its historically inevitable crisis is finally at hand.It is self-evident that conventional economics has failed, completely, utterly and totally. The two competing cargo cults of tax cuts/trickle-down and borrow-and-spend stimulus coupled with monetary manipulation have failed to restore advanced Capitalism’s vigor, not just in America, but everywhere.


Conventional econometrics is clueless about the root causes of advanced finance-based Capitalism’s ills. To really understand what’s going on beneath the surface, we must return to “discredited” non-quant models of economics: for example, Marx’s critique of monopoly/cartel, finance-dominated advanced Capitalism. (“Capitalism” is capitalized here to distinguish it from “primitive capitalism.”)


All those fancy equation-based econometrics that supposedly model human behavior have failed because they are fundamentally and purposefully superficial: they are incapable of understanding deeper dynamics that don’t fit the ruling political-economy conventions.


Marx predicted a crisis of advanced Capitalism based on the rising imbalance of capital and labor in finance-dominated Capitalism. The basic Marxist context is history, not morality, and so the Marxist critique is light on blaming the rich for Capitalism’s core ills and heavy on the inevitability of larger historic forces.


In other words, what’s wrong with advanced Capitalism cannot be fixed by taxing the super-wealthy at the same rate we self-employed pay (40% basic Federal rate), though that would certainly be a fair and just step in the right direction. Advanced Capitalism’s ills run much deeper than superficial “class warfare” models in which the “solution” is to redistribute wealth from the top down the pyramid.


This redistributive “socialist” flavor of advanced Capitalism has bought time–the crisis of the 1930s was staved off for 70 years–but now redistribution as a saving strategy has reached its limits.


The other political-economic strategy that has been used to stave off the crisis is consumer credit: as labor’s share of the economy shrank, the middle class workforce was given massive quantities of credit, based on their earnings and on the equity of the family home.


The credit model of boosting consumption has also run its course, though the Keynesian cargo cult is still busily painting radio dials on rocks and hectoring the Economic Gods to unleash their magic “animal spirits.”


The third strategy to stave off advanced Capitalism’s crisis was to greatly expand the workforce to compensate for labor’s dwindling share of the economy. Simply put, Mom, Aunty and Sis entered the workforce en masse in the 1970s, and their earning power boosted household income enough to maintain consumption.


That gambit has run out of steam as the labor force is now shrinking for structural reasons. Though the system is eager to put Grandpa to work as a Wal-Mart greeter and Grandma to work as a retail clerk, the total number of jobs is declining, and so older workers are simply displacing younger workers. The gambit of expanding the workforce to keep finance-based Capitalism going has entered the final end-game. Moving the pawns of tax rates and fiscal stimulus around may be distracting, but neither will fix advanced finance-based Capitalism’s basic ills.


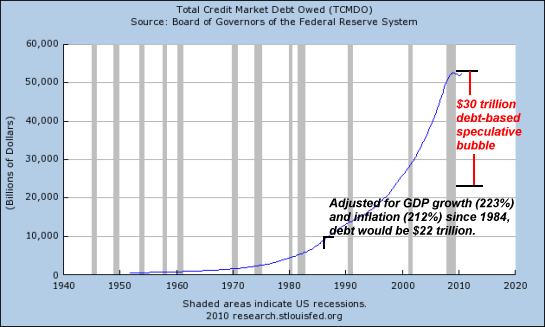
The fourth and final strategy was to exploit speculation’s ability to create phantom wealth. By unleashing the dogs of speculation via a vast expansion of credit, leverage and proxies for actual capital, i.e. derivatives, advanced finance-based Capitalism enabled the expansion of serial speculative bubbles, each of whcih created the illusion of systemically rising wealth, and each of which led to a rise in consumption as the “winners” in the speculative game spent some of their gains.


This strategy has also run its course, as the public at last grasps that bubbles must burst and the aftermath damages everyone, not just those who gambled and lost.


Two other essential conditions have also peaked: cheap energy and globalization, which opened vast new markets for both cheap labor and new consumption. As inflation explodes in China and its speculative credit-based bubbles burst, and as oil exporters increasingly consume their resources domestically, those drivers are now reversing.


Advanced Capitalism is broken for reasons conventional economics cannot dare recognize, because it would spell the end of its intellectual dominance and the end of the entire post-war political-economic paradigm that feeds it.


Let’s look at some charts to see what conventional economists must deny to keep their jobs.

Take a look at this chart. What reality does it reflect? A failure to cut taxes enough? A failure to print enough money or extend enough credit? No. What it reflects is labor’s dwindling share of the economy.

The structural reality is that employment is declining:

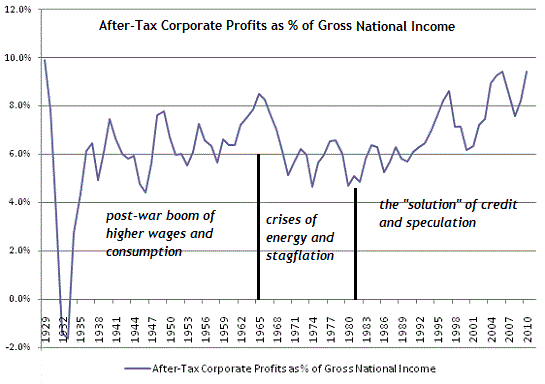
Meanwhile, after-tax corporate profits have steadily climbed to nearly 10% of the entire national income:

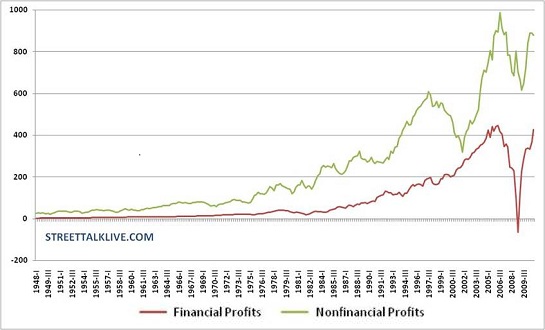
Note the recent rise of finance-based profits:

This chart leaves no doubt that the engines of the past 30 years “growth” and “prosperity” have been credit and credit-fueled speculation:

If we look at disposable income, we find that direct government transfers have masked the systemic erosion of labor’s earnings and employment:


By at least some measures, the top 1% are paying a greater share of total taxes than they were 20 years ago, which suggests that “tax the rich will solve everything” stopgaps have limited purchase on the deeper structural ills of advanced finance-based Capitalism.


Marx identified two critical drivers of advanced Capitalism’s final crisis:


1. Global Capital has the means and incentive to keep labor in surplus and capital scarce, which means that capital has pricing power and labor has none. The inevitable result of this is that wages, as measured in purchasing power, fall while the returns earned on capital rise.


This establishes a self-reinforcing, inevitably destructive dynamic: once labor’s share of the national income falls below a critical threshold, labor can no longer consume enough or borrow enough to keep the economy afloat with its cash and credit-based consumption.


We are at that point, but massive Federal borrowing and transfers are masking that reality for the time being.


2. The dual forces of competition and technology inevitably drive down the labor component of all manufactured goods and technology-based services. Mechanization, robotics and software have lowered the labor component of everything from running shoes to computer chips from $20 per item to $2 per item, and that process cannot be reversed. While the wage paid to the workforce designing and manufacturing the products and providing the services may actually rise, the slice of revenues given over to all labor continues shrinking.


This is what I have constantly referred to (using Jeremy Rifkin’s excellent phrase) as “the end of work.”

Put another way: the return on capital invested in techology greatly exceeds the return on labor. Industries and enterprises which fail to leverage capital invested in technology that lowers the labor component of their good/service eventually undergo rapid and inevitable creative destruction.


We are about to witness this creative destruction in the labor-heavy industries of government, education and healthcare.


Marx’s genius was to recognize the historical inevitability of these internal forces within advanced Capitalism. He also recognized the inevitability of finance-capital’s dominance of industrial capital–something we have witnessed in full flower over the past 30 years.


Finance capital now dominates not just industrial capital but the machinery of governance, rendering real reform impossible. Instead, the Status Quo delivers up simulacrum “reform” which change nothing but the packaging of the Central State/Cartel Capitalism’s exploitation and predation.


Add all this up and you have to conclude the final crisis of finance-based advanced Capitalism is finally at hand. All the “fixes” that extended its run over the past 70 years have run their course. Life will go on, of course, after the Status Quo devolves, and in my view, ridding the globe of financial predation and parasitism will be a positive step forward.


The real solution is to understand advanced finance-based global Capitalism will unravel as a result of the internal dynamics described above, and be replaced with an economic and political Localism that I describe in my new book An Unconventional Guide to Investing in Troubled Times.I don’t claim these ideas are unique to me; many others have described the same dynamics and historical trends.

Follow Us