by Greg Harmon
Last week’s review of the macro
market indicators looked like the unofficial last week of Summer would bring
Gold to bounce around in its uptrend while Crude Oil slowed at resistance and
turned lower. The US Dollar Index seemed content to move sideways while US
Treasuries were biased lower. The Shanghai Composite and Emerging Markets were
biased to the downside with risk of the Chinese market running a little higher
first. Volatility looked to remain elevated keeping the bias lower for the
equity index ETF’s SPY, IWM and QQQ, despite the moves higher the previous week,
with the QQQ looking to have the best chance to break the bear flags higher.
The week began with Gold meandering sideways and Crude Oil hitting the breaks
at resistance. The US Dollar Index was behaving as anticipated but US Treasuries
were finding some support. The Shanghai Composite drifted lower while Emerging
Markets caught a bid and moved higher. Volatility tailed off but only marginally
as the Equity Indexes SPY, IWM and QQQ rose. And then Friday happened pushing
Gold and Bonds higher and Crude Oil and Equities lower. What does this mean for
the coming week? Lets look at some charts.
As always you can see details of individual charts and more on my StockTwits feed and on chartly.)
Gold Weekly, $GC_F
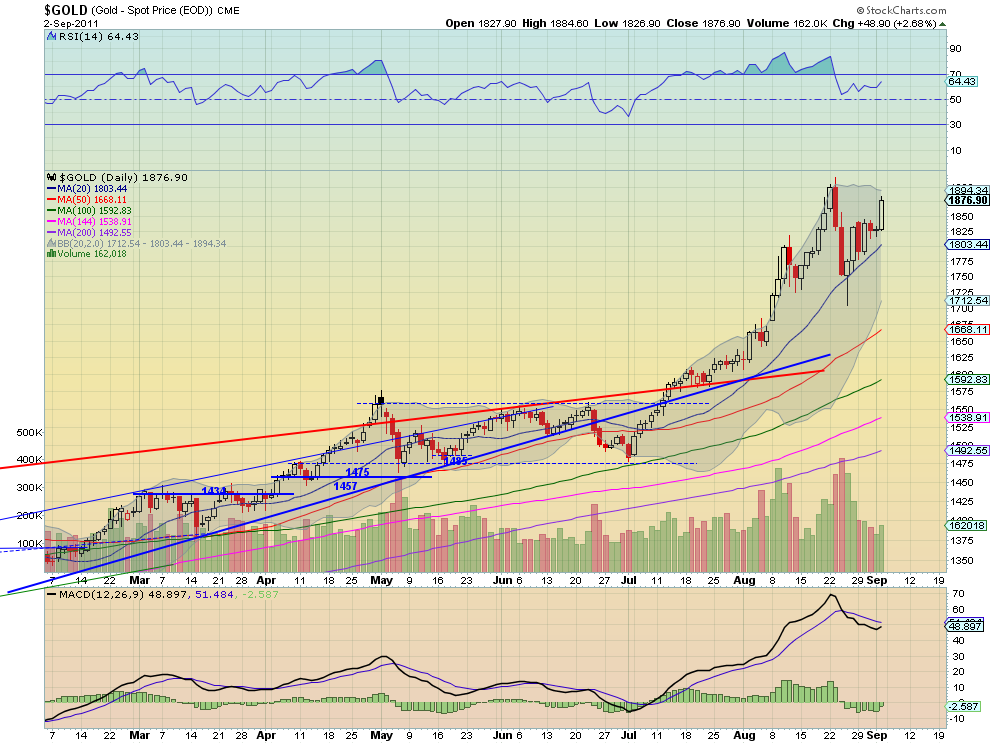
Gold spent most of the week building an ascending triangle under resistance
of 1840 before launching over it on Friday to resistance near 1875. The daily
chart shows a Relative Strength Index (RSI) that held well over the mid line and
is moving higher and a Moving Average Convergence Divergence (MACD) indicator
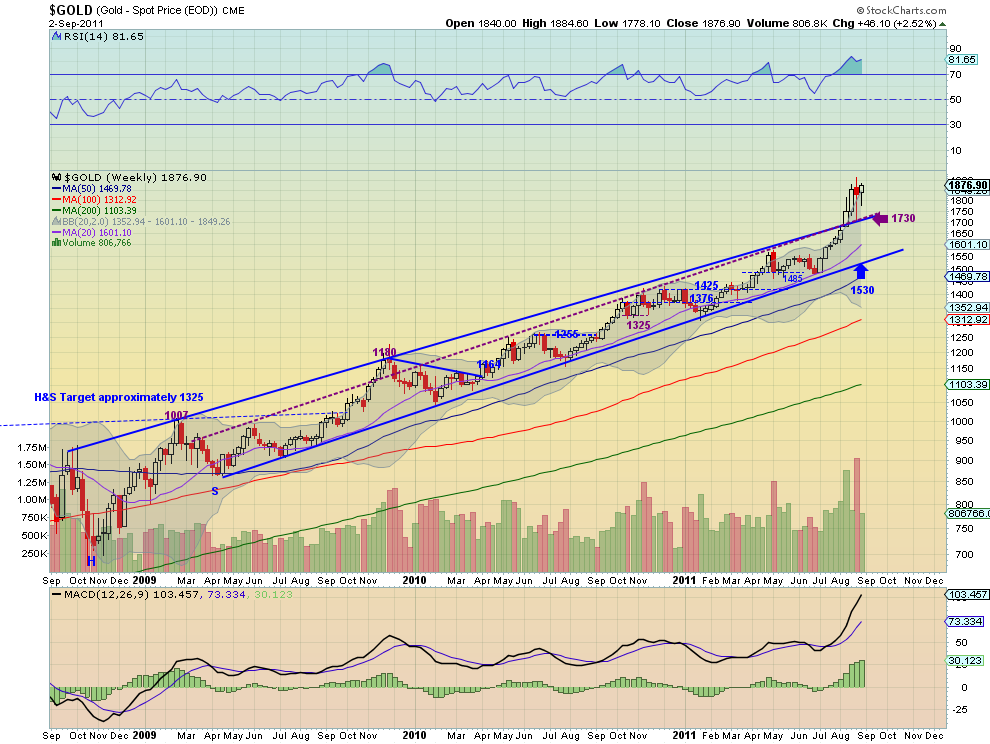
that is about to cross positive. The weekly chart remains bullish with upward
sloping Simple Moving Averages (SMA), a MACD that is increasing and a RSI that
remains high. The only concern about more upside in these charts is that the
weekly RSI is over 80, and volume has been decreasing, but not a reason to sell.
The triangle break has a target of 1930 with resistance at 1900 along the way.
Look for Gold to head toward that target and possibly beyond in the coming week
to the Measured Move (MM) of 2225 if it gets over 1940. Any pullback should find
support at 1840 and 1800 below that.
West Texas Intermediate Crude Weekly, $CL_F
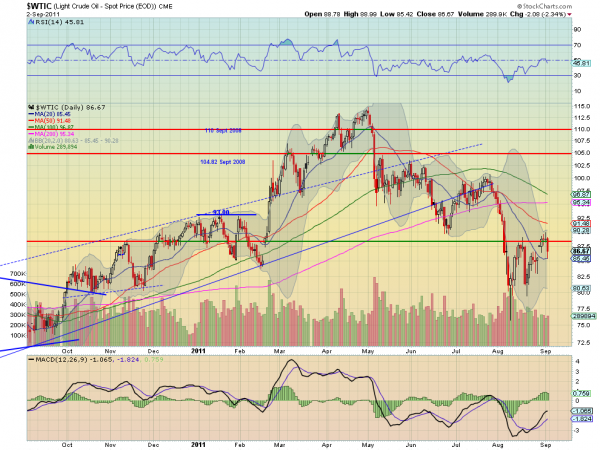
Crude Oil found resistance at the long term support/resistance line at 88.50
and fell back Friday. The RSI on the daily chart is now rolled lower and
pointing down and the MACD is starting to fade. The SMA’s have been successively
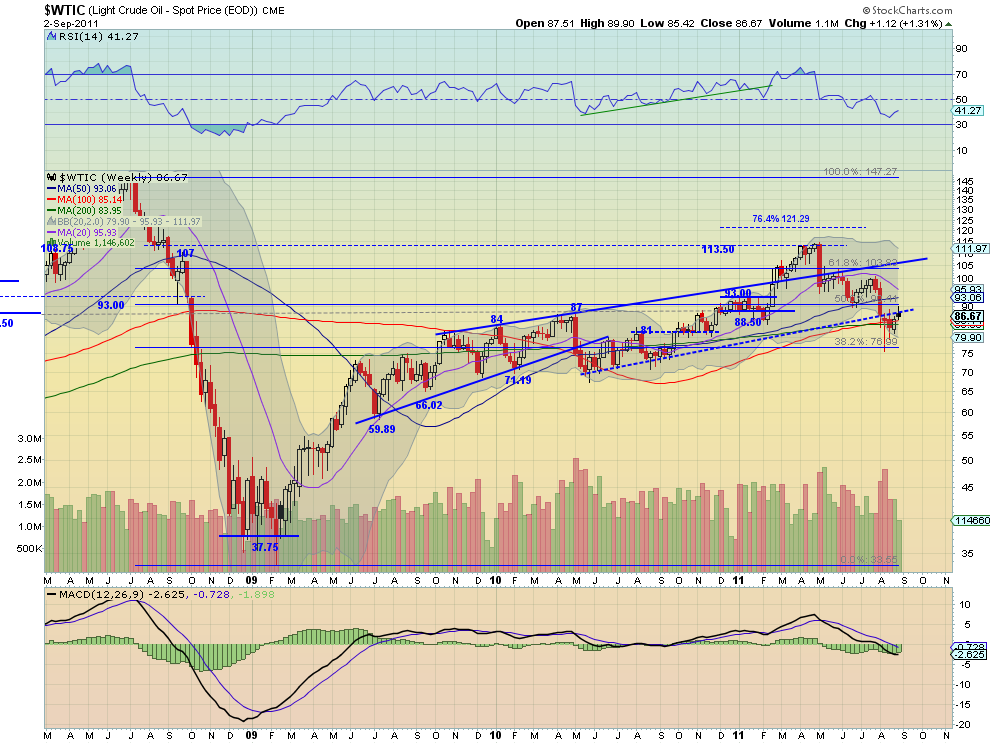
rolling lower also with only the 200 day SMA left. The weekly chart reinforces
the rejection with the rising resistance line, but shows both the 100 and 200
week SMA as support underneath. The RSI on this timeframe has been trending
lower but currently cricked higher, while the MACD is negative but has been
flat. Look for Crude to continue lower next week toward support at 84. A move
below 81 would trigger the next leg down with a target of 77. Any move above
88.5 will find resistance at 90.
US Dollar Index Weekly, $DX_F
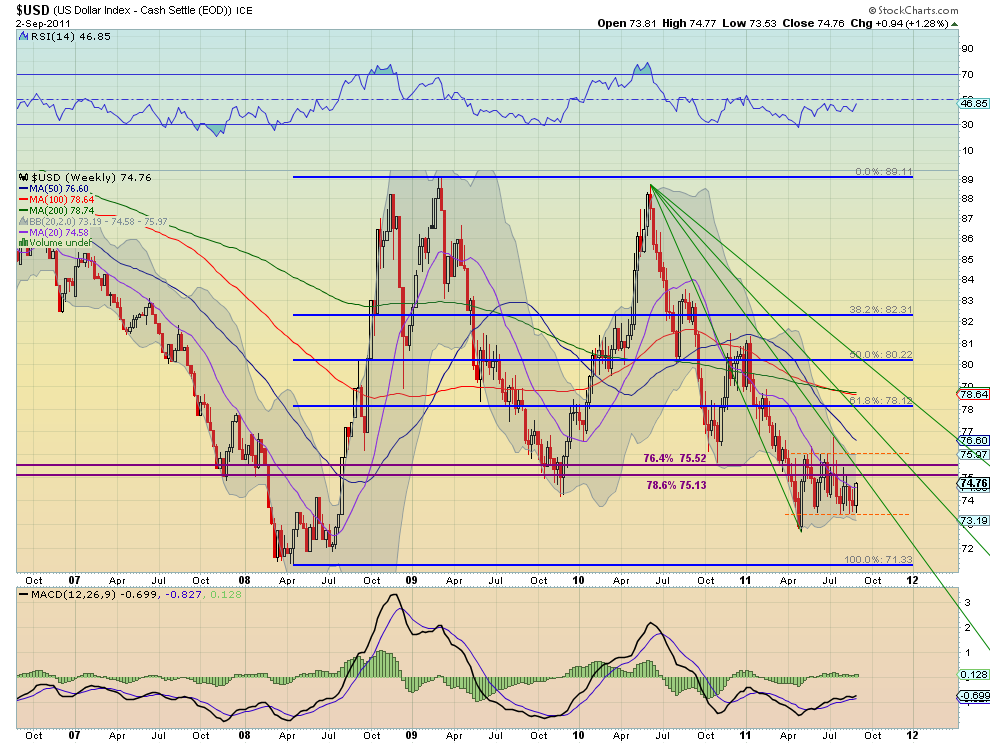
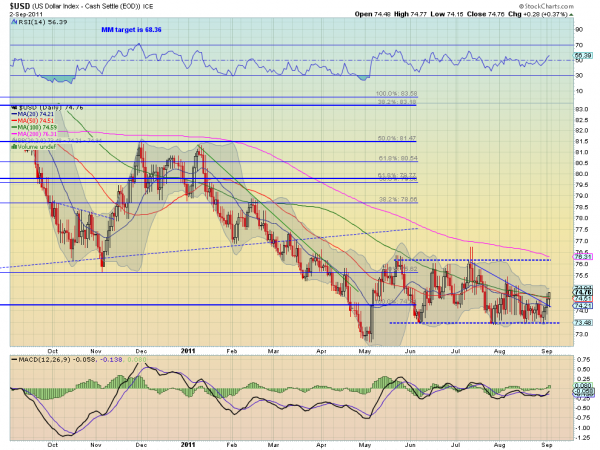
The US Dollar Index broke higher above the descending triangle with in the
73.50 to 76 channel this week. It has a RSI on the daily chart that is rising
and a MACD that has crossed positive, both suggesting more upside to come. The
weekly chart is more middle of the road looking with the range in tact and the
RSI shuffling along just below the mid line while the MACD stays near zero as it
moves one week closer to the first Fibonacci fan line. Look for the Index to
spend time in the top half of the channel next week. Any move over 76 should
find resistance at 77.50 and a move below 73.5 support at 73 and 72.
iShares Barclays 20+ Yr Treasury Bond Fund Weekly, $TLT
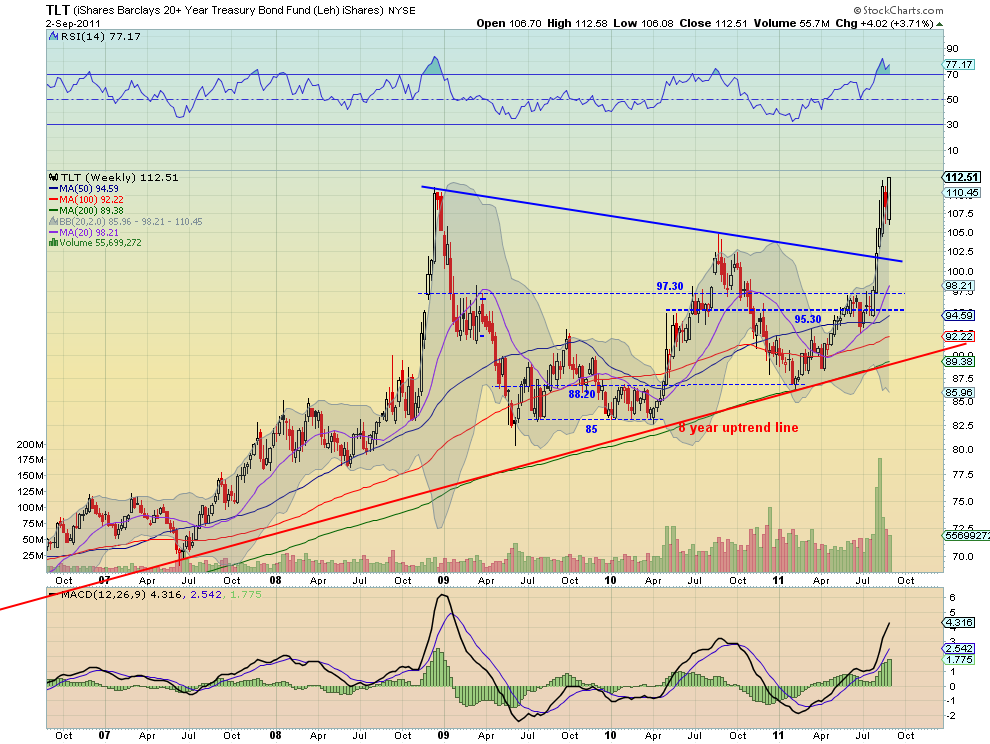
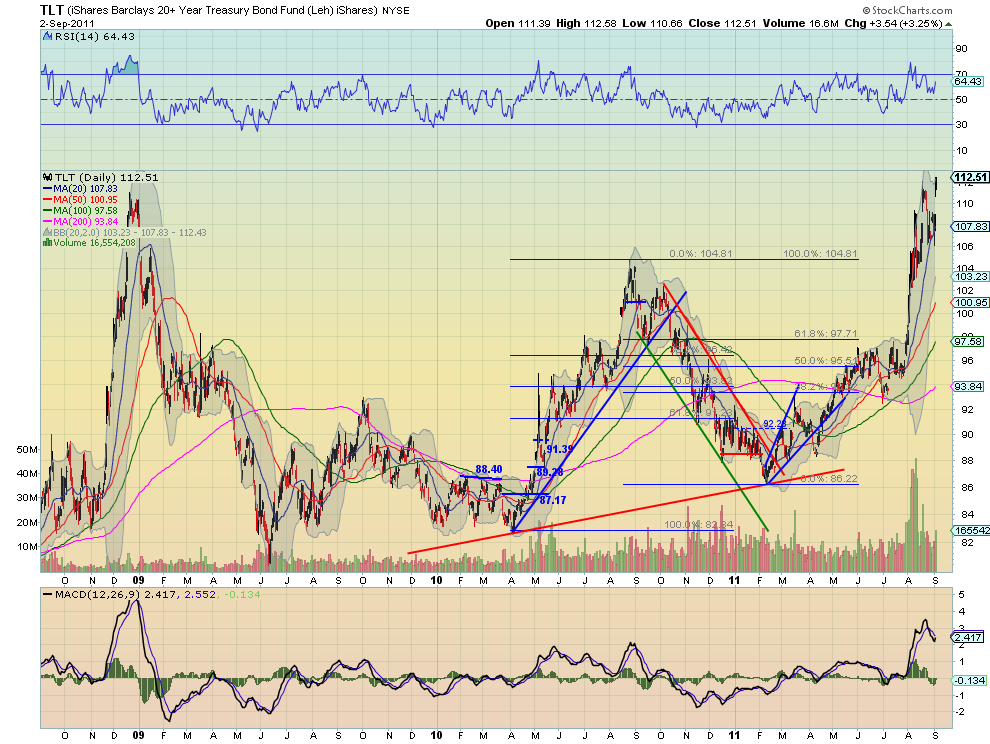
US Treasuries, as measured by the ETF $TLT,
consolidated higher for most of the week before breaking to new highs on Friday.
The RSI is in bullish territory and currently rising while the MACD has moved
back to the zero line and looks ready to cross higher, on the daily chart. The
weekly chart shows a strong white candle closing nearly on the high in a bull
flag. The RSI is elevated but not extreme at 77.17 and the MACD continues to
increase. Look for more upside in Treasuries next week with targets higher on a
MM to 120.70 and then 137 from the symmetrical triangle pattern breakout on the
weekly chart. Any downside move should find support before 104.80 at either 108
or 106.
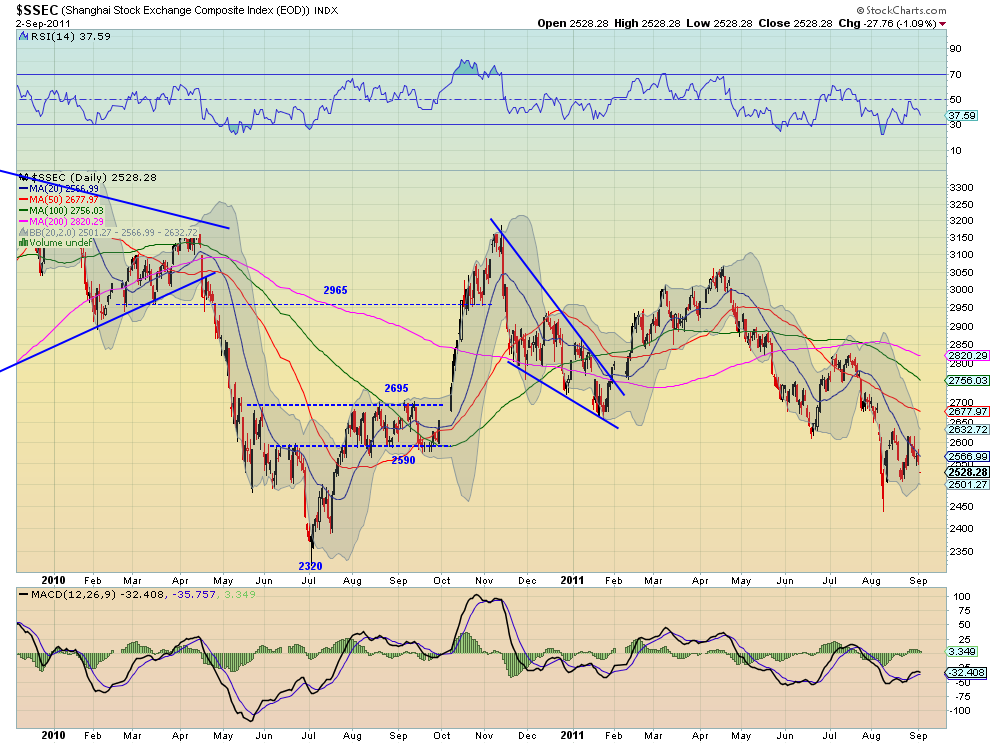
Shanghai Stock Exchange Composite Weekly, $SSEC
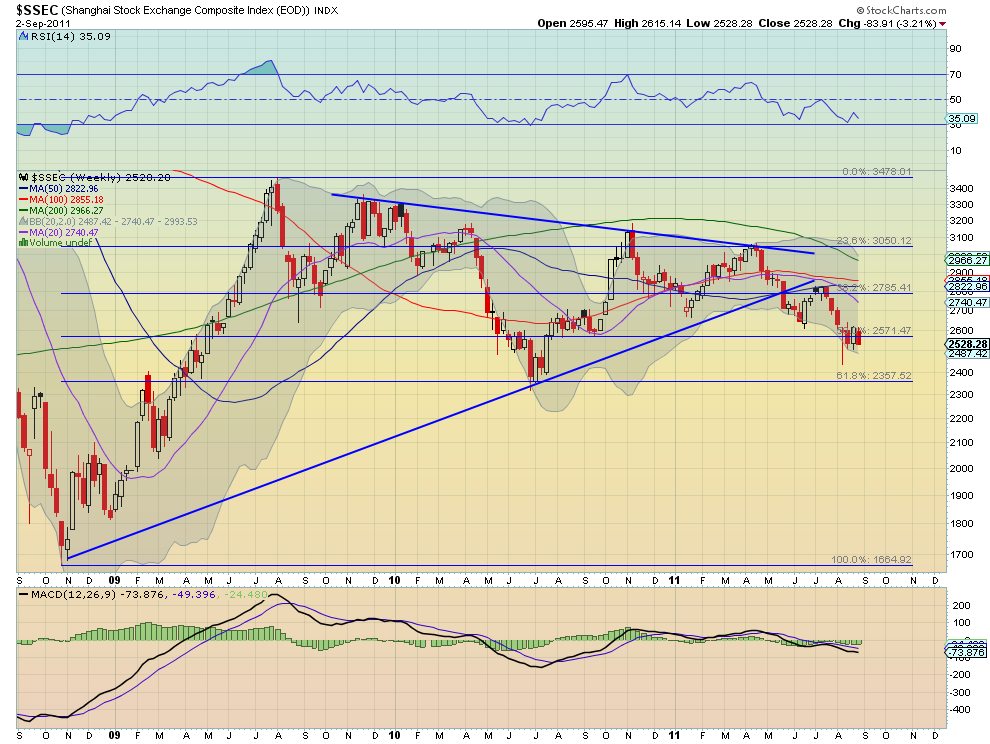
The Shanghai Composite is in a bear flag or continuation symmetrical triangle
and moved lower in it this week. The daily chart shows the RSI indicating for
more downside with a MACD that is rather flat. The weekly chart shows the flag
is right at the 50% Fibonacci level of 2571 form the move up from 2008 to 2009.
The RSI is heading lower and the MACD is flat on this timeframe. Look for more
downside in the coming week with support lower at 2500 and then 2450. A break
below that leads to a test of the 61.8% Fibonacci at 2357 and a target on the MM
lower at 2260. Any upside surprise should find resistance at 2590 and then
2695-2700.
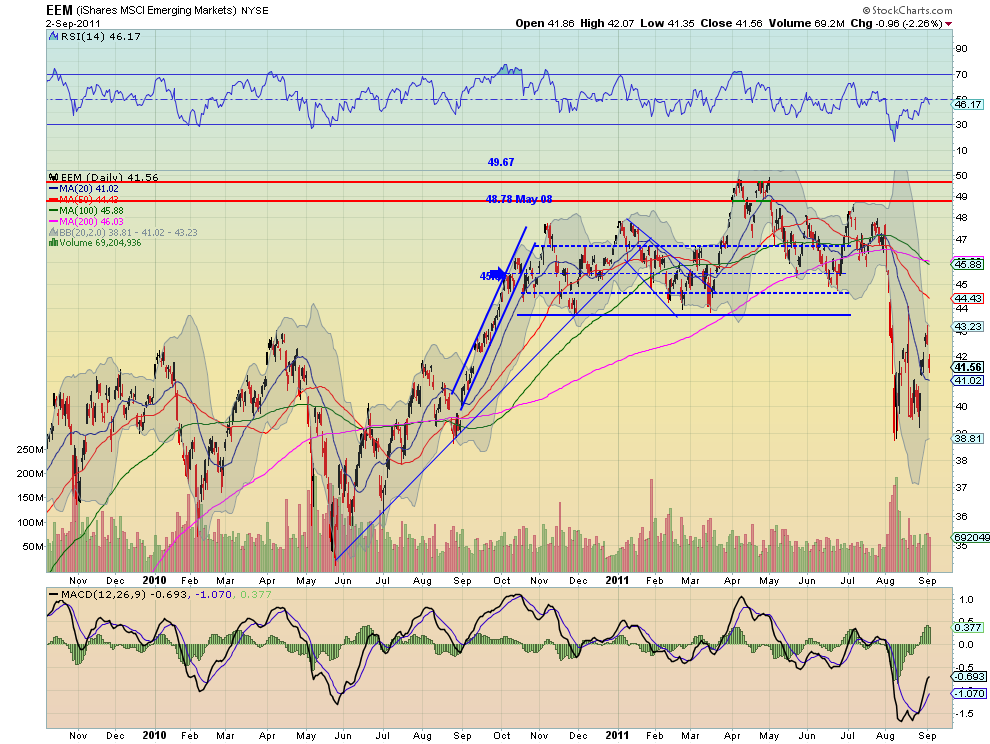
iShares MSCI Emerging Markets Index Weekly, $EEM

Emerging Markets, as measured by the ETF $EEM,
made a move higher early in the week only to be contained by what might be the
beginnings of a symmetrical triangle as resistance and close lower Friday. The
RSI met the mid line and rejected lower while the MACD peaked and is now waning
on the daily chart, with all of the SMA’s sloping lower. The weekly chart shows
the reach higher with the long shadowed candle but unable to hold over the 42.54
support/resistance level. The RSI is suggesting upside on this timeframe and the
MACD is starting to improve. The path in the short run looks lower with any
upside contained at 42.54 with a hold over that level leading to a shift in
thinking. Next week support comes at 39 and a break below that puts a move to to
support at 35.91 on the way to a MM at 32 into play.

VIX Weekly, $VIX
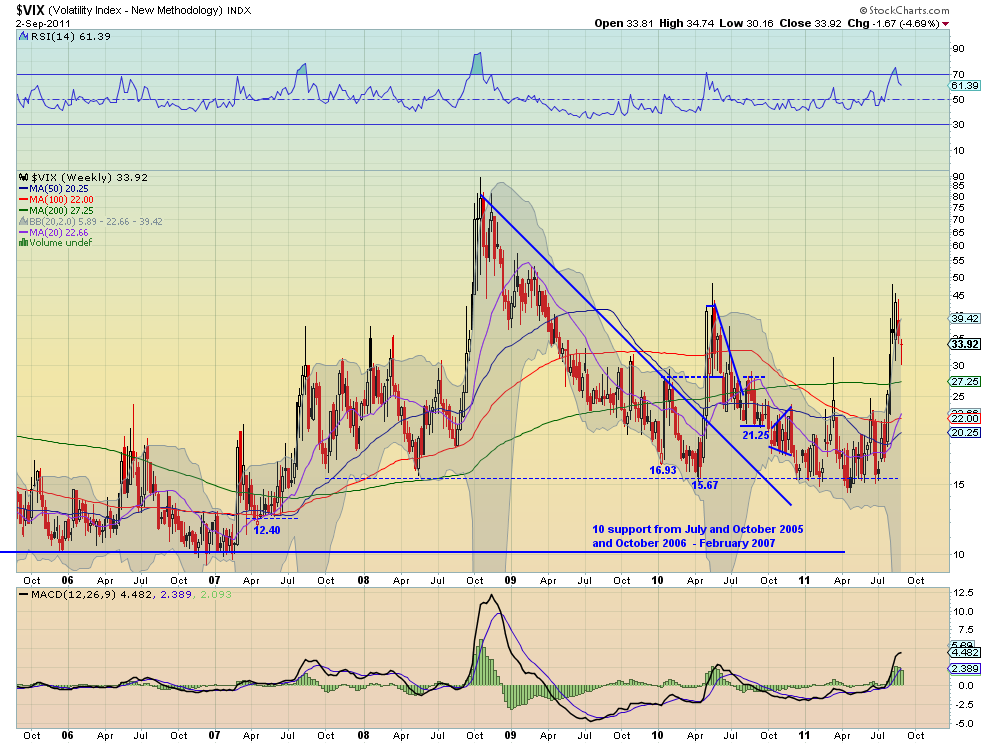
The Volatility Index pulled back but held support at 30 before rising to
close the week. The RSI on the daily chart bounced higher after hitting the mid
line and the MACD peaked negative and is now improving. The weekly chart has the
RSI falling and the MACD starting to move back toward zero. Divergence between
timeframes. Look for volatility to remain elevated relative to the first 7
months of the year but a move below 28 could change that quickly. Conversely a
move over 38 should lead to a retest of the 44 to 48 range. Look for more in the
28 – 38 range next week.
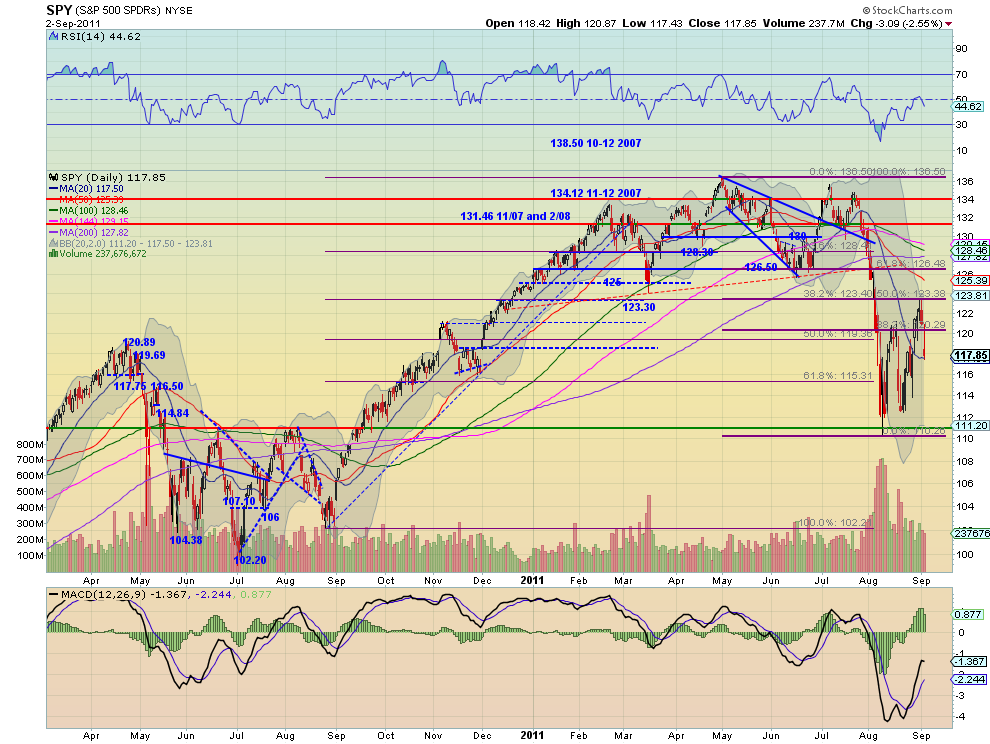
SPY Weekly, $SPY
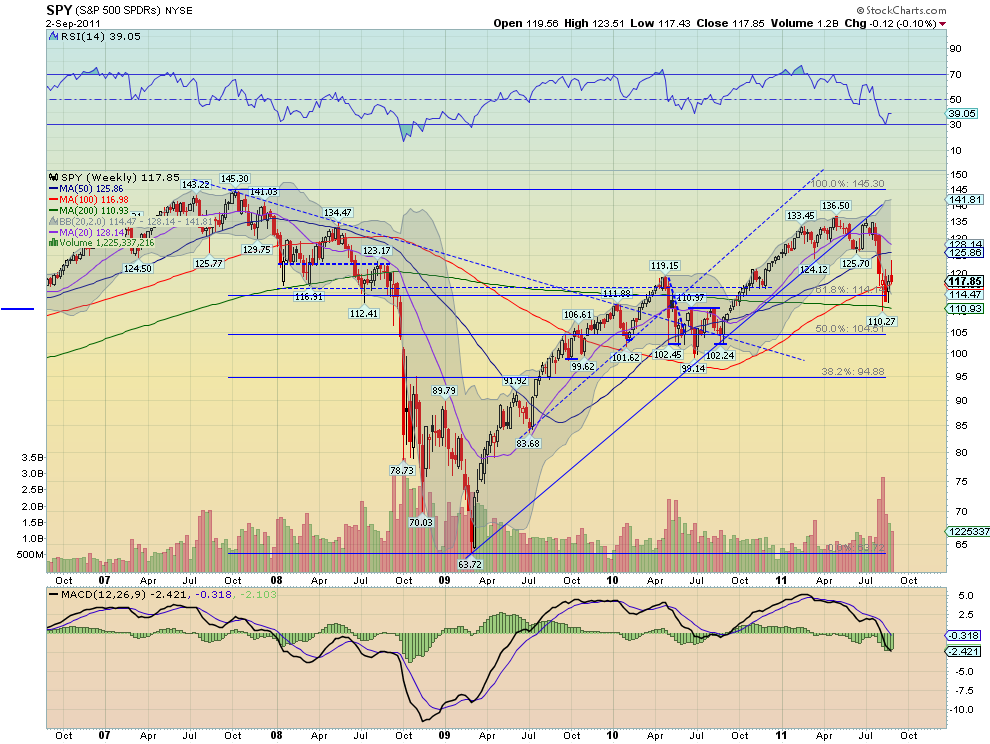
The SPY rose early in the week but fell hard Friday after printing a Tweezers
Top with topping tails halting at the 20 day SMA. The RSI on the daily chart
turned lower at the mid line and the MACD is waning. On the weekly chart the
long upper shadow may be foreshadowing more down side out of the bear flag. The
RSI however is rising off of the low and the MACD is improving on this time
frame. The trend is lower and look for that to continue next week with any
upside move held at 121.50 or 123.40 above that. Any more and the down trend is
in question. To the downside if support at 112.4 does not hold then the next
levels down for support come at 111.15 and 104 on the way to the MM target of
about 95.
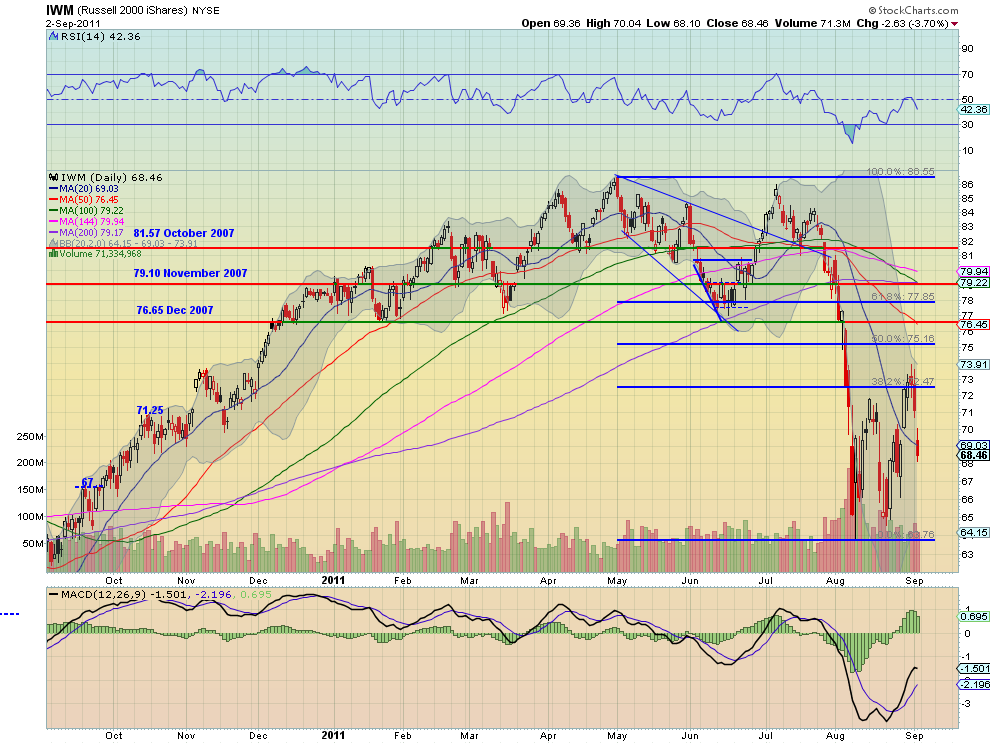
IWM Weekly, $IWM
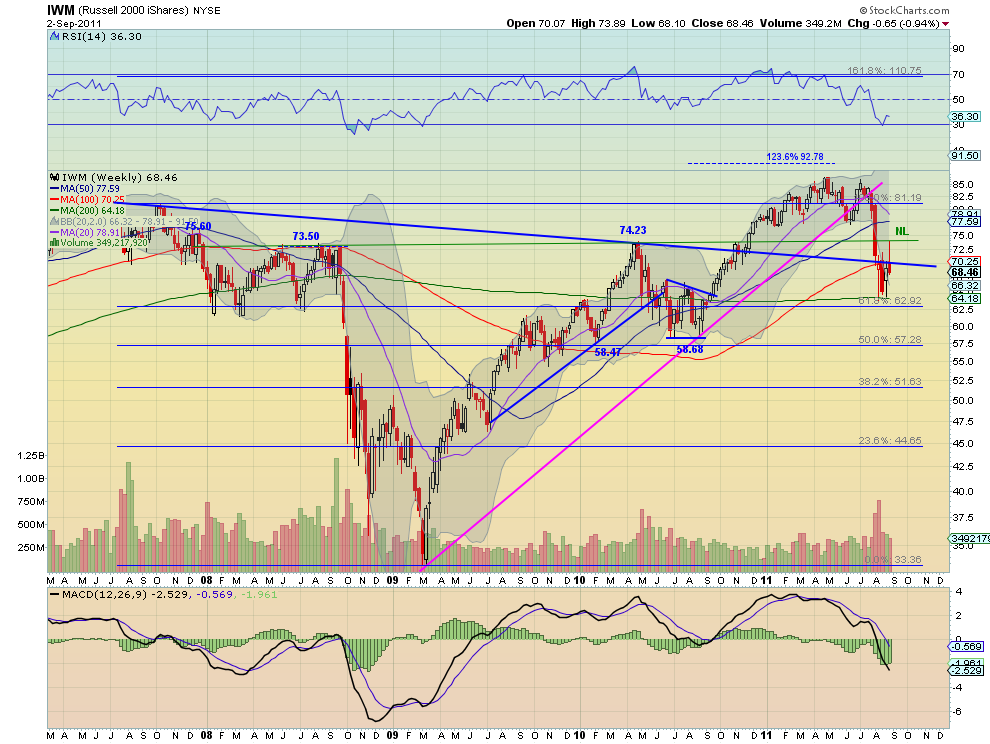
The IWM rose early in the week but also crashed Friday after printing a
topping tails at the 38.2% Fibonacci retracement of the move lower, halting
under the 20 day SMA. The RSI on the daily chart turned lower at the mid line
and the MACD is waning. On the weekly chart the long upper shadow at the
extended neckline of the previous inverse Head and Shoulders is showing more
down side out of the bear flag. The RSI is rising off of the low but cricking
back down and the MACD is improving on this time frame. The trend is lower for
next week with any upside move held at 71.60 or 73.60 above that. Any more and
the down trend is in question. If the downside support at 65 does not hold then
the next level down for support comes at 62.8 on the way to the MM target of
about 48.
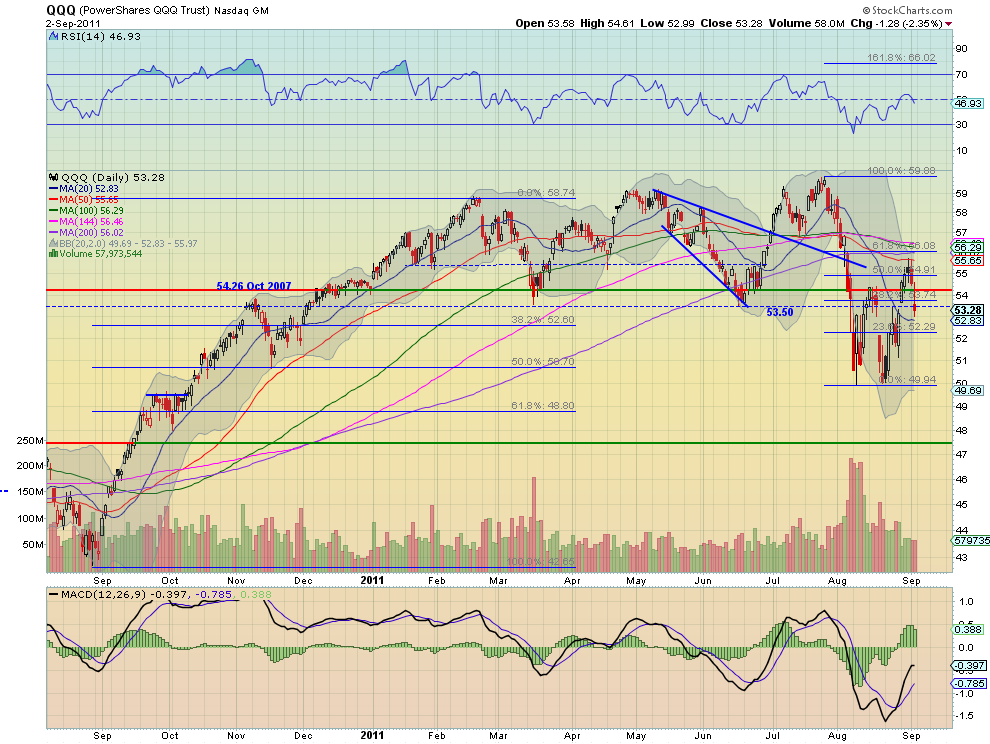
QQQ Weekly, $QQQ
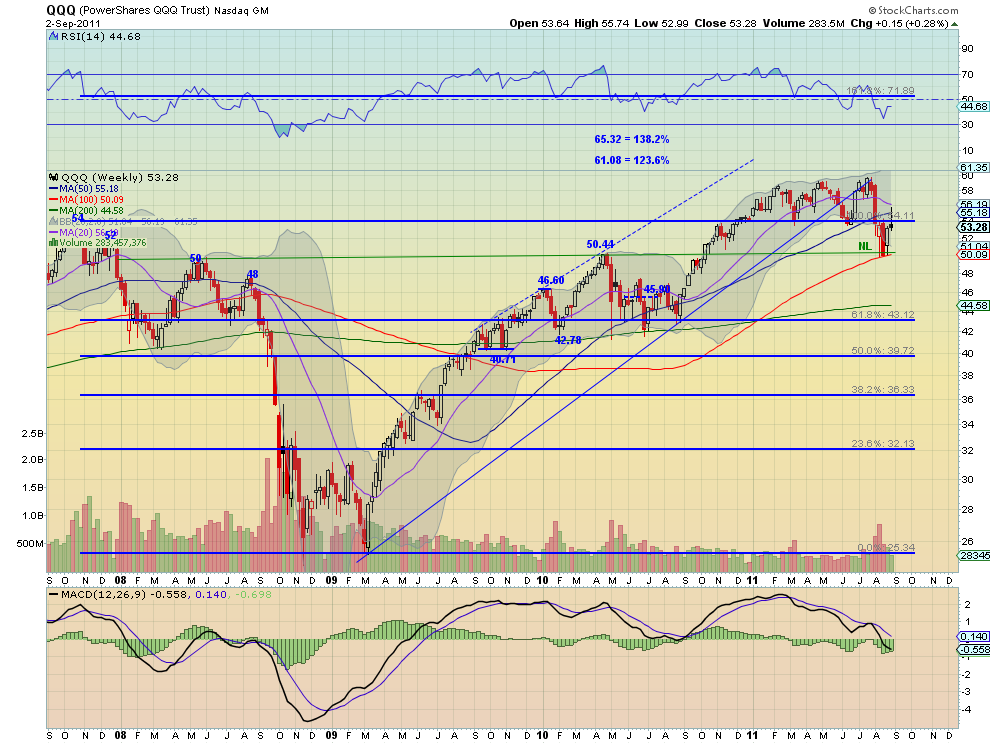
The QQQ also rose early and fell hard Friday after a Tweezers Top with
topping tails at the 50 day SMA halting just above the 20 day SMA. The RSI on
the daily chart turned lower under the mid line and the MACD is waning. On the
weekly chart the long upper shadow may be foreshadowing more down side out of
the bear flag. The RSI however is rising off of the low but cricking lower again
and the MACD is improving. The trend is lower for next week with any upside move
held at 54.26 or 55.50 above that. Any more and the down trend is in question.
if the downside support at 50.00 does not hold then the next levels down for
support come at 48 and 46 on the way to the MM target of about 40.
Next week looks like the moves that revealed themselves Friday will continue.
Gold and US Treasuries are ready to continue higher. Crude Oil looks poised to
drop further and the US Dollar Index to move sideways in the top of its range.
The Shanghai Composite and Emerging Markets look to continue lower. Volatility
looks to continue elevated with the US Equity Index ETF’s SPY, IWM and QQQ ready
to continue lower in their bear flags. US Treasuries breaking out and Gold
racing higher again could be the catalyst for a break of the bear flags lower.
Use this information as you prepare for the coming week and trade’m well.
No comments:
Post a Comment