Tuesday, July 2, 2013

Coffee higher as roasters show buying interest

By Jack Scoville

COFFEE

General Comments: Futures were higher in range trading.  The cash market remains very quiet.  However, roasters are showing more buying interest and it is possible to get some business done.  Sellers, including Brazil, are quiet and are waiting for futures to move higher.  Buyers are interested on cheap differentials, and might start to force the issue if prices hold and start to move higher in the short term on ideas that the market made a bottom.  Brazil weather is forecast to show dry conditions, but no cold weather.  There are some forecasts for cold weather to develop in Brazil early next week, but so far the market is not concerned.  Current crop development is still good this year in Brazil.  Central America crops are seeing good rains now.  Colombia is reported to have good conditions.

Overnight News:  Certified stocks are higher today and are about 2.747 million bags.  The ICO composite price is now 116.15 ct/lb.  Brazil should get dry weather except for some showers in the southwest.  Temperatures will average near to above normal.  Colombia should get scattered showers, and Central America and Mexico should get showers, and rains.  Temperatures should average near to above normal.  ICE said that 7 delivery notices was posted against July today and that total deliveries for the month are now 799 contracts.

Chart Trends:  Trends in New York are down with no objectives.  Support is at 117.00, 116.00, and 113.00 September, and resistance is at 123.00, 125.00, and 126.00 September.  Trends in London are mixed to up with objectives of 1835 and 1900 September.  Support is at 1755, 1720, and 1705 September, and resistance is at 1800, 1855, and 1870 September.  Trends in Sao Paulo are down with no objectives.  Support is at 140.00, 137.00, and 134.00 September, and resistance is at 148.00, 151.00, and 155.00 September.

COTTON

General Comments:  Futures were higher after holding support on the charts.  It was a low volume session with the holiday this week.  Futures held the short term range.  It is possible that futures can work lower again as demand has turned soft.  Ideas of better production conditions in the US caused some selling interest.  Texas is reporting light precipitation, mostly in southern areas.  Dry weather is being reported in the Delta and showers and storms are seen in the Southeast.  The weather should help support crop development in the Delta and Southeast, and could help in Texas.  Weather for Cotton appears good in India, Pakistan, and China.

Overnight News:  The Delta should be dry and Southeast will see showers and rains.  Temperatures will average near to below normal this week, but near to above normal this weekend.  Texas will get a few showers early this week, but will be mostly dry.  Temperatures will average near to below normal, but near normal this weekend.  The USDA spot price is now 82.55 ct/lb.  ICE said that certified Cotton stocks are now 0.623 million bales, from 0.623 million yesterday.  ICE said that 757 notices were posted today and that total deliveries are now 2,317 contracts.

Chart Trends:  Trends in Cotton are mixed.  Support is at 85.10, 84.00, and 82.80 October, with resistance of 86.40, 86.90, and 88.00 October.

FCOJ

General Comments:  Futures closed higher in recovery trading.  There has been little selling pressure on the market in the last week since the dramatic move lower.  Better weather in Florida seems to be the big problem for the bulls at this time.  Futures have been working generally lower as showers have been seen and conditions are said to have improved in almost the entire state.  Ideas are that the better precipitation will help trees fight the greening disease.  No tropical storms are in view to cause any potential damage.  Greening disease and what it might mean to production prospects continues to be a primary support item and will be for several years.  Temperatures are warm in the state, but there are showers reported.  The Valencia harvest is continuing but is almost over.  Brazil is seeing near to above normal temperatures and mostly dry weather, but showers are possible later this week.

Overnight News:  Florida weather forecasts call for showers.  Temperatures will average near to above normal.  ICE said that 0 delivery notices were posted today and that total deliveries for the month are now 0 contracts.

Chart Trends:  Trends in FCOJ are mixed to down with no objectives.  Support is at 125.00, 122.50, and 121.50 September, with resistance at 130.00, 131.50, and 132.50 September.

SUGAR         

General Comments:  Futures closed lower despite the smallest delivery in seven years against July contracts in New York.  Ideas are that mills had not had time to amass more Sugar due to a delayed harvest in Brazil because of rains and also because they are concentrating on producing ethanol.  Futures might try to work lower this week.  There is still talk that a low is forming or has formed for at least the short term, but there is still a lot of Sugar around, and not only from Brazil.  The Indian monsoon is off to a good start and this should help with Sugarcane production in the country.  But, everyone is more interested in Brazil and what the Sugar market is doing there.  Traders remain bearish on ideas of big supplies, especially from Brazil.  Traders in Brazil expect big production to continue as the weather is good.

Overnight News: Showers are expected in Brazil, mostly in the south and southwest.  Temperatures should average near to above normal.  ICE said that 2,835 lots were delivered against July Raw Sugar futures.

Chart Trends: Trends in New York are mixed to down with objectives of 1640 and 1580 October.  Support is at 1650, 1620, and 1600 October, and resistance is at 1690, 1715, and 1750 October.  Trends in London are mixed to down with objectives of 475.00, 465.00, and 448.00 October.  Support is at 478.00, 475.00, and 470.00 October, and resistance is at 490.00, 496.00, and 499.00 October.

COCOA        

General Comments:  Futures closed lower on ideas of good harvest weather and active movement of beans to ports in western Africa.  Internal prices are reported weak in much of Africa.  Ideas of weak demand after the recent big rally kept some selling interest around.  The weather is good in West Africa, with more moderate temperatures and some rains.  It is hotter and drier again in Ivory Coast this week, but the rest of the region is in good condition.  Ivory Coast is starting to see showers, but will need more rain soon.  The mid crop harvest is about over, and less than expected production along with smaller beans is reported.  Malaysia and Indonesia crops appear to be in good condition and weather is called favorable.

Overnight News:  Scattered showers are expected in West Africa.  Temperatures will average near to above normal.  Malaysia and Indonesia should see episodes of isolated showers.  Temperatures should average near normal.  Brazil will get mostly dry conditions and warm temperatures.  ICE certified stocks are lower today at 4.934 million bags.  ICE said that 22 delivery noticies were posted today and that total deliveries for the month are 294 contracts.

Chart Trends:  Trends in New York are mixed.  Support is at 2130, 2100, and 2080 September, with resistance at 2190, 2200, and 2230 September.  Trends in London are mixed.  Support is at 1440, 1420, and 1360 September, with resistance at 1470, 1490, and 1520 September.

See the original article >>

Active Money Managers run away from risk assets!

by Chris Kimble

CLICK ON CHART TO ENLARGE

The Power of the Pattern shared with Sector/Commodity Sentiment Extreme members last week that Active Money Managers were pairing back risk asset exposure quite a bit of late. This decline is reflecting a decent shift in sentiment among the active managers at the time the S&P 500 was on rising support. As you can see above, more often than not over the past few years, when risk managers pair back risk assets, the market was near a time that a rally took place!

CLICK ON CHART TO ENLARGE

The above chart of Apple was produced last Friday (see post here), reflecting a combo of.... potential double bottom and bullish falling wedge in Apple, with bullish sentiment currently at 39%. Apple was trading at $398 at the time of the posting, currently it is trading $19 higher since the Friday chart.

See the original article >>

Our Energy Slaves Are in Recession

by Charles Hugh Smith

Charts of energy consumption are screaming "recession."


To get a feel for how many energy slaves you have, imagine hiring 40 people to drag you and your car down the street at 3 miles per hour. Replacing the energy in a gallon of gasoline with human labor is imperfect, of course, because the people you hire to drag your vehicle down the street cannot run 70 miles an hour.

The gallon (or four liters) of petrol will push your car about 25 to 30 miles at high speeds at a market cost of about $4. Imagine how much it would cost to pay 40 people to drag your 1.5-ton car 25 miles--a lot more than $4. (Weight of 2012 Ford Fusion: 3,285 pounds. Weight of 2012 Honda Civic: 2,765 pounds.)

You get the idea: every bit of fossil fuel you consume is the equivalent of an energy slave. Correspondent David P. (Market Daily Briefing) describes the concept thusly: "Your personal standard of living is derived (largely) from the number of energy slaves you have working for you." Energy Slaves - 5 charts

David kindly shared three of his five charts of energy consumption per capita (i.e. per person). This first is total energy consumption in the U.S. per capita.

The key takeaway here is how closely energy consumption tracks recession: notice how energy consumption cratered in the deep 1980-82 recession, and how it fell off a cliff in 2009, and has continued to weaken despite the official return of "growth."

Clearly, improved efficiency of transport, furnaces, electrical appliances, etc. leads to lower consumption while delivering the same output (miles driven, refrigeration, etc.). Just as clearly, higher efficiency cannot possibly account for the steep declines in recessionary periods. People use less energy because they have less money and are feeling less wealthy:

Next up: energy consumption in the residential household sector of the economy.While the downtrend since 2000 (lower highs and lower lows) could be attributed to improved efficiency, that cannot be the reason behind energy consumption's waterfall decline in 2011. That says one thing: recession.

How about the lifeblood of American life, transportation? Once again, the sharp decline in consumption says "recession." Consumption rose slightly in post-recession 2010, but then resumed its dramatic plunge:

Here is David's commentary on his charts. (The charts for the commercial and industrial sectors also show recessionary declines.)

Concept: personal standard of living is derived (largely) from the number of energy slaves you have working for you. Likewise, increasing or decreasing activity can be tracked by energy (slave) consumption in each sector.
The series are produced monthly by EIA that totals the energy consumption in the US in 4 sectors (Industry, Transport, Commercial, Residential) from all energy sources. They are a very seasonal noisy series, so we use a 12-point moving average to smooth things out. We then divide this by population to arrive at - energy slaves per person per year for each sector in BTU. The MA makes it lag a bit, but the series are so noisy you would likely not see anything interesting if you didn't have some sort of adjustment.
Industrial: 40% (per capita) drop since 1975 points at long-term deindustrialization
Residential: 12% (per capita) drop since 2008 points at real losses in standard of living
Transport: 14% (per capita) drop since 2008 - more standard of living losses
Over a longer time period an argument might be made for decreasing energy use based on increased efficiency. Over shorter timeframes - not so much. And if you look at all the sectors, things are all still trending down except residential.

Thank you, David. Other than a decline in the standard of living (otherwise known asrecession), what other dynamics could be in play? There are at least three, though their effects are on the margins of consumption:

1. Telecommuting/working remotely. Working at home eliminates commuting and many business meetings.

2. The "Brown Truck Store": purchasing goods online and having them delivered by UPS, USPS, etc. saves energy by consolidating delivery to the end buyer.

3. Generational shift away from private auto ownership. Gen Y is far more comfortable with car-sharing (ZipCar, City Car Share, etc.), i.e. the access not ownership model: having access to a private vehicle no longer requires the immense expense of owning a vehicle.

This generational shift may be one reason miles driven per person has been declining: (via Doug Short): Vehicle Miles Driven: Population-Adjusted Fractionally Off the Post-Crisis Low. Adjusting for population growth, total miles driven in the U.S. is back to the levels of 1995, almost two decades ago.

While there are many positives to declining energy consumption, the question is:does this reflect a better standard of living or a lesser standard of living? In terms of replacing the ownership model with the access model and replacing long commutes with remote work, the answer is "better." In terms of overall economic activity, these charts scream recession, i.e. a declining standard of living.

See the original article >>

China's oilseeds crop to fall to 'multi-year low'

by Agrimoney.com

Oil World offered support to sagging hopes for Chinese soybean imports, warning of a decline in the country's domestic oilseeds harvest which will whet its appetite for purchases of foreign supplies.

Many investors, both in Beijing and abroad, are dubious over a US Department of Agriculture estimate that China's soybean imports, the world's biggest, will surge some 10m tonnes to a record 69m tonnes in 2013-14.

One major European commodities house said at the weekend that "the trade is unconvinced" by the USDA forecast, which has gained particular scepticism amid signs of a slowdown in China's important manufacturing sector, and with concerns over bank lending too.

"Although they expect them to rise to 62m-65m tonnes," a figure at this level, in falling short of USDA forecasts, "could add volume back to global ending stocks", implying lower price potential.

'Multi-year low'

However, Oil World said on Tuesday that China's imports of oilseeds overall faced pressure from a harvest set to fall to a "multi-year low" of 48m tonnes, "down 2m tonnes from a year earlier and down 3.8m tonnes from two years earlier".

Parts of China have been unduly dry, including the southern North China Plain where weather service MDA warned that "some dryness continues to develop", although recent rains – which have hurt the quality of the wheat harvest – have improved conditions in many areas.

The fall in domestic oilseeds production, "along with the comparatively low Chinese soybean stocks at the start of the new season, will result in a pronounced increase of total Chinese oilseed imports in 2013-14", the analysis group, referring to an August-to-July crop year.

Indeed, China looks set for a strong finish to 2012-13 too, with the country seen importing 8.0m tonnes of soybeans last month, a rise of 57% month on month and 43% year on year.

The country has also been raising imports of rapeseed, which hit a record 1.66m tonnes in the first five months of 2013, Oil World said.

See the original article >>

U.S. dollar looks strong with rising U.S. rates

By Anthony Lazzara

The Commerce Department reported a 2.1% gain in factory orders following a revised 1.3% advance the prior month. New York Fed President William C. Dudley speaks on the economy at 12:30 p.m. in Connecticut. Key jobs reports come tomorrow morning with the ADP release and then the important monthly non-farm payrolls report with the unemployment %.

Equities: The SEP13 E-mini S&P 500 is up 9.25 points today, trading at 1616.25. We are still focused on our 1643 key target level. The market has made a convincing rally from last Monday’s opening sell-off down to the 1550′s. It seems as though investors still want to be long stocks and furthermore may be looking at these levels in the high 1500s and the low 1600s as good spots to load up again on the long side. The U.S. economic numbers have continued to impress as of late, and even though that could convince the Fed to indeed lower the stimulus, overall the market seems to think the economy can handle a lowered stimulus and still perform. 1607 is our key line in the sand.

Bonds: The Bond market is up slightly today, with the SEP13 30yr futures up 10 ticks to 136’01. Our key high volume support/pivot level is 135’27. The short term structure of the market profile looks bullish with an upside target of 137’02. Of course the upcoming employment #’s will likely play a key part in determining the next move in the bond futures. If the #’s on Wednesday and Friday come in weak, we would not be surprised to see a short covering rally to 137. If the #’s continue the recent trend of strong economic performance and surprise to the upside, we could see the 30yr futures go quickly below the key 135’27 level and head lower.

Commodities: The AUG13 gold futures are back down a bit today, after a very big short-covering rally from $1,179 all the way to the high $1,260s. Now, gold is down $6 to $1,250. We believe gold could head lower as the U.S. dollar potentially keeps rallying. We have a key support level for gold in the short term at $1,231. $1,224 and then $1,214 are also key market profile support levels. Crude oil continues to trend upwards, and today the AUG13 crude oil futures are trading up $0.88 to $98.88. We have our next upside target at $99.70, but we actually believe crude oil will head over $100 soon with the issues in the Middle East likely causing the “fear premium” to cause upward price bias.

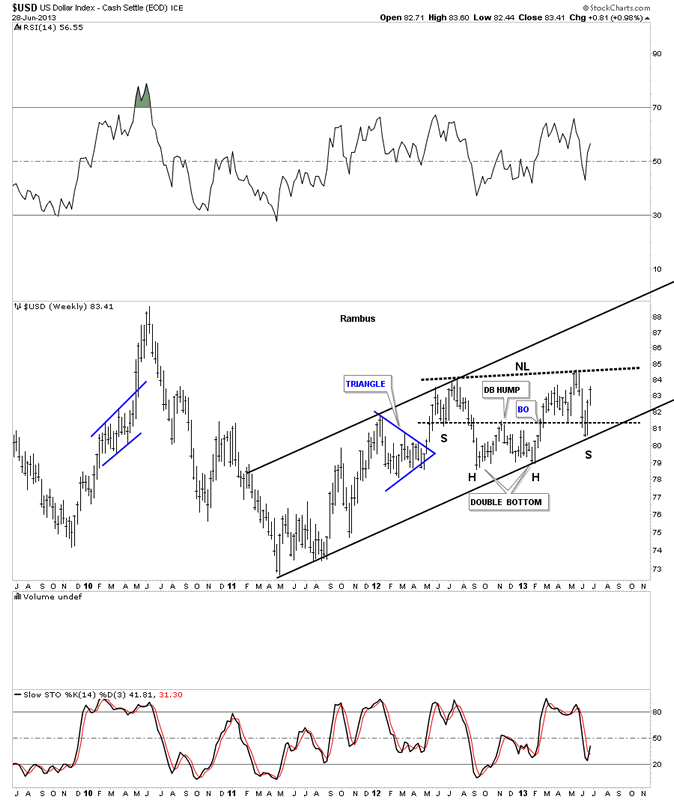
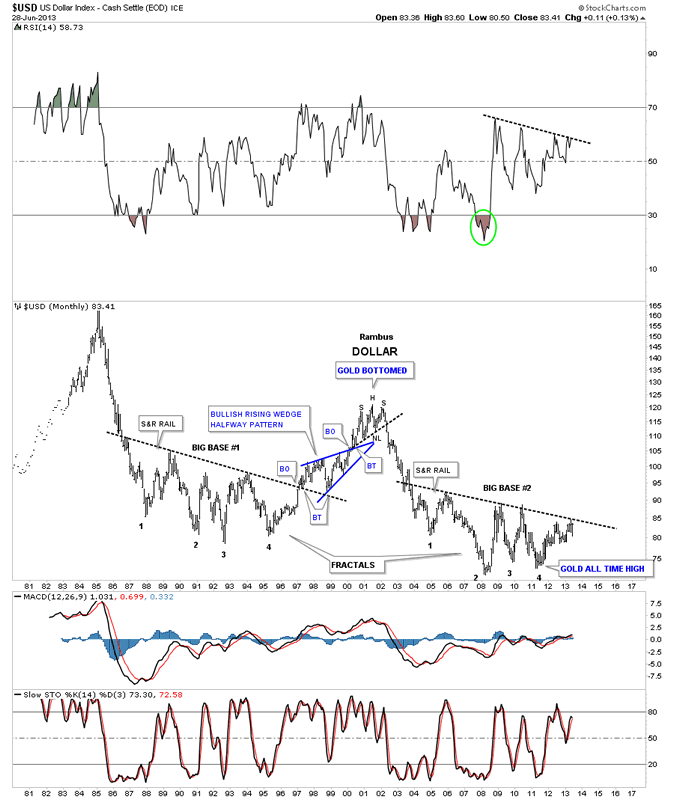
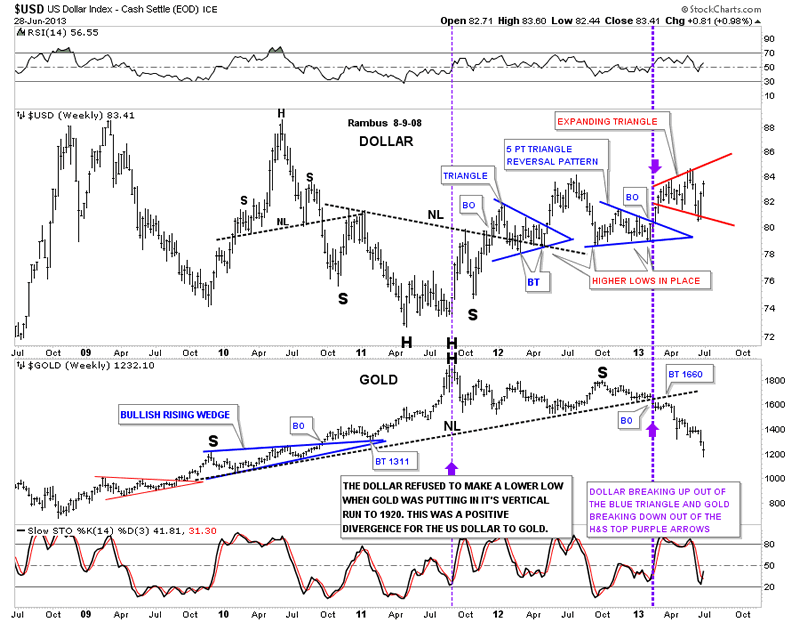
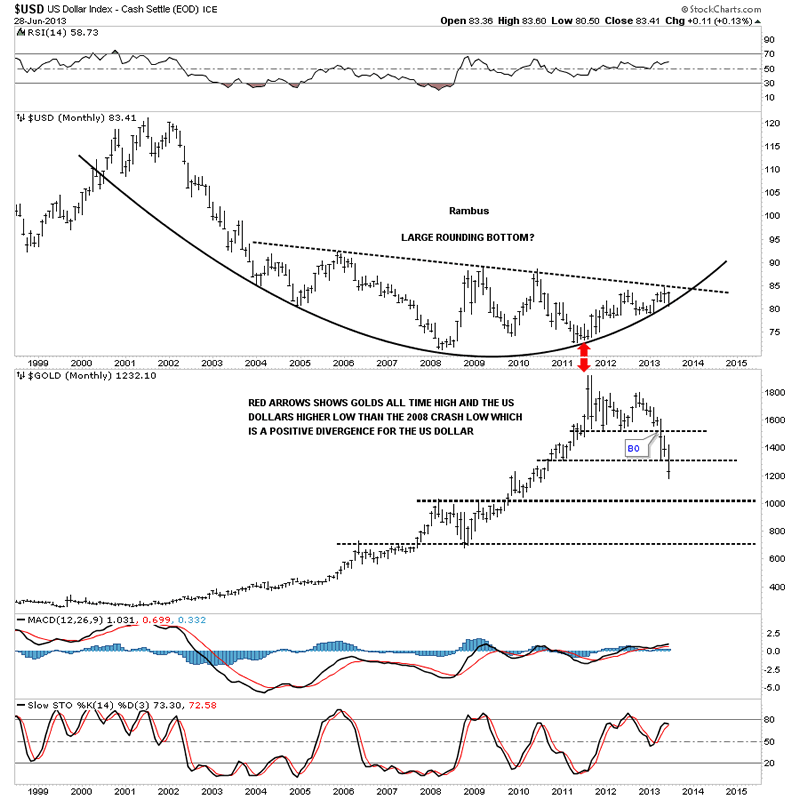
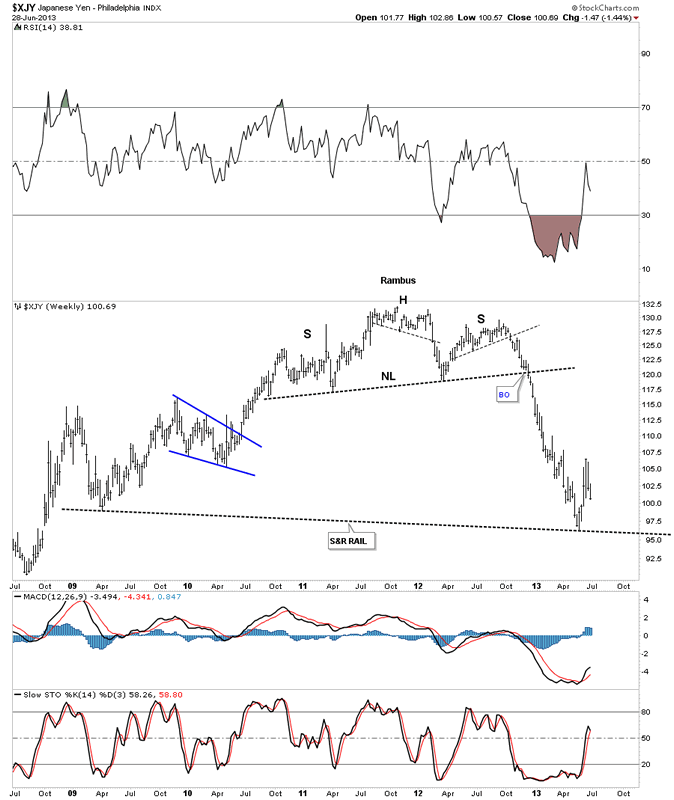
Currencies: The Japanese Yen has been trending down recently, and today is at a new low for June and July. The Yen is down 64 ticks to 99.67. 99.30 is a near term downside target, and 100.30 is a short term resistance level. If the Yen picks up steam to the downside, it could surprise people with making new lows. However, the #’s out of Japan recently have been better than expected, so perhaps the Yen will stop before making new 2013 lows on this move down. We focus more on the U.S. dollar index. The USD is trading up 26 ticks to 83.52, and has been in an uptrend ever since the most recent FOMC meeting. Ever since the beginning of 2012, the USD has been making higher highs and higher lows, thus indicating an uptrend in that time frame. We believe this trend could continue throughout this year. We look to the key 87-89 region as a potential first target, as the overall trend of higher US interest rates could very well continue.

See the original article >>

Why Those Hoping For More QE Now Are In For a Rough Surprise

by Graham Summers

Yesterday was another day of bad economic data with the ISM report showing the worst employment figure since September 2009.

The bulls believe that bad economic data means more QE. The problem with this is that they’re ignoring the fact that this current spat of bad data is coming out while QE 3 and QE 4 are occurring.

At any other time in the last four years, bad news could open the door to more QE as every QE plan had a fixed timeline in place. So there was always the possibility of more QE coming if economic data worsened once a particular program came to an end.

However, today the Fed is already running two QE programs that are correctively pumping $85+ billion into the system per month. So the fact that bad economic data is coming out now indicates QE is losing is effect.

This does NOT open the door to more QE now. If the Fed tapers QE in the future then yes, it might engage in more QE later down the road. But the idea that the Fed will increase QE when it’s already running $85 billion a month is misguided.

Copper, the commodity with a PhD in economics, gets this. Stocks do not.

See the original article >>

US heatwave damages some crops, but Midwest spared

by Agrimoney.com

The heatwave which has brought record heat to the south western US has damaged pasture condition and crops, but the milder warming in the Midwest has helped crops in the most important corn and soybean states.

Crops in many southern and western areas of the US wilted in heat which has reached record levels in some areas, besides causing wildfires which 19 firefighters in Arizona died attempting to extinguish.

US Department of Agriculture scouts reported a "high" danger of fire in California too, which saw "extremely hot conditions by the end of the week", with temperatures above 100 degrees Fahrenheit "common across the state".

Just 2% of California's pasture was rated in "fair" condition as of Sunday, with the rest seen as "poor" or "very poor".

While field crops, largely irrigated, fared better, the proportion of cotton rated in "good" or "excellent" health tumbled 10 points, albeit still remaining at 80%.

'Dry conditions and above-normal temperatures'

In Colorado, high temperatures took their toll too, with the proportion of corn rated good or excellent falling eight points to 44%, with a one-point drop to 10% in the equivalent rating for winter wheat.

The proportion of sorghum making the top two grades fell 11 points to 46%, driving a decline in the rating of the national crop by five points to 49% good or excellent.

Heat affected crops further north too, in Montana, where spring wheat deteriorated by seven points to 63% good or excellent,

In South Dakota, which saw "dry conditions and above-normal temperatures across most of the state", the proportion of the crop making the top two grades dropped five points to 56%.

Thanks to the declines, the overall US spring wheat crop was rated 68% good or excellent, a drop of two points week on week, and down on the 71% a year ago.

Midwest thrives

However, crops in the key Midwest growing states further east generally thrived on conditions which provided a mixture of benign warmth to broadly damp soils – if too wet in some areas for growers to undertake fieldwork.

"Farmers were unable to continue working in the field due to the rain," USDA crop scouts in Illinois said.

"Corn and soybean growth, however, has improved" and crops "appear to be looking much better".

In Iowa, the top soybean and corn producing state, "warmer and mostly drier conditions" enabled farmers to "near completion of corn and soybean sowings", with 99% of corn seeded.

Both the national corn and soybean crops were rated 67% in good or excellent health, rises of two points apiece on the week.

'Issues with rot'

One alarm bell rung by scouts was that the humid turn in Midwest weather may encourage pests and weeds.

"The big concern this past week was all of the weeds that have rapidly grown and been spotted in soybean fields," Illinois scouts said.

In Ohio, USDA scouts said that "most wheat is looking mature and will be ready for the harvest to begin once the weather permits.

"If there are significant delays in harvesting due to rain in the coming weeks, issues with rot and sprouting may arise."

See the original article >>

The Market Has Never Been More Reliant On The Fed, Or About That "Catch-22" Taper

by Tyler Durden

As has been made clear previously, the primary reason the Fed is concerned with reducing the amount of monthly liquidity Flow (i.e., the Taper) has nothing to do with the economy, or concerns related to the prevention of asset bubbles, and everything to do with the fear that as it extracts ever more collateral out of the market, and transfers increasingly more Treasurys out of private hands and into its infinite "pseudo-public" balance sheet, the liquidity of the Treasury market will get increasingly more distorted and fragile. After all, recall that the Fed is currently monetizing 10% of all outstanding marketable debt stock in 10 year equivalent terms each year which also happens to be the hard ceiling on duration monetization. But as market events in the past two weeks reminded us, there is a flip side to that: now that the Fed is into its 5 year of explicit market support and rate stabilization, the market simply has no clue how to operate should the Fed no longer be the core source of duration end-demand in a world in which deficit spending is now in its terminal exponential phase.

If there is one chart that shows just how addicted the market has become to the Fed's soothing monthly bond bid come hell or high water, it is the following. It shows that on a rolling 6 month average, the Fed is now responsible for monetizing a record 70% of all net supply measured in 10 year equivalents. This represents a reliance on the Fed that is greater than ever before in history!

It is somehow in this environment - when the Fed is monetizing more duration than ever on a relative basis - that the Fed believes it can wean the market off its support: a market that has never been more reliant on the Fed than it is now.

And, hence, the Fed's Catch-22: damned if you taper, damned if you don't.

See the original article >>

Don't Get Carried Away By The Shale Oil Boom

by Tyler Durden

North American crude oil has been in the news on several fronts this week, including some rapid price moves and an unexpected intervention by President Obama. Despite the publication of a new report projecting a much more rapid rate of tight oil supply growth than is generally expected and the entire Buffet-Railroad-Traffic-Pipeline meme relying on increasingly exponential dreams of the Bakken et al. saving us from our excess-energy-consuming selves, Barclays questions just how realistic these forecasts are, noting "it is perhaps wise to exercise a degree of caution over longer-term shale oil forecasts... partly because of the steepness of decline rates for shale oil wells, a lot of the very big productivity gains have already been made, and finally, skepticism around some of the more ambitious projections of US shale output due to the existence of numerous logistical barriers."

Authored by Barclays' Kevin Norrish,

...

There has been a distinct theme of North American oil running through much of the commodity news flow this week. Weather disruptions to Canadian crude and the return of several US mid-west refineries have helped push WTI prices up relative to Brent, pressuring the front-month spread between the two to its lowest for 18 months. President Obama’s surprise intervention in the Keystone XL pipeline debate has raised fresh concerns about its viability by placing a heavy emphasis on environmental criteria in its approval process. Related to this we also take a look this week at how Canadian oil producers have been rapidly adapting to pipeline capacity shortages by making intensive use of other options such as rail. Finally, the Kennedy School of Government at Harvard has released what appears to be the most bullish shale oil report yet, projecting that US output of shale oil could reach 5mbpd by 2017 making the US the world’s largest oil producer.

But how realistic are forecasts such as these? It is certainly true that the sharp increase in US shale oil production has taken many in the oil market by surprise over the past couple of years and that includes even those oil analysts and forecasters that are watching the sector most closely. Current rates of growth are exceeding expectations and bring in to question some of the more conservative assumptions made by the major oil forecasting groups.

As little as 18 months ago the US Department of Energy was forecasting a flat profile for domestic oil production and that US oil liquids output would grow this year by a very modest net 100k b/d.

Taking the latest figures from the DOE’s Short-Term Energy Outlook, that figure has now risen roughly nine-fold as it has for most other major forecasters (including ourselves). Although big upward revisions to the outlook for US crude oil supply were implemented by the DOE through 2012, the data so far this year suggest that reality is running a long way ahead and that even its latest forecasts are looking far too modest.

Growth in US crude oil production is running at almost 1.2m bpd above year-ago levels, according to weekly oil supply data, exceeding both the DOE and IEA’s latest full-year 2013 growth forecasts by almost 50% and OPEC’s by almost 100%. This rate of growth is almost solely down to shale and has been achieved despite the poor performance of producers in the Gulf of Mexico. Unplanned maintenance and a shut-in currently underway at Shell’s Mars B project where a new platform is being installed have forced some downward revisions to project GOM crude output, which is now expected to decline this year.

There is also an offset to the strong growth in crude oil output from the other components of US liquid fuels output. Natural gas liquids growth in the year to March at just 50k bpd is relatively sluggish at just half the level expected this year by the DOE and ethanol production has actually fallen by 100k bpd. However, these figures are modest alongside the pace of growth in US lower 48 crude oil output, the biggest driver of which is rapid growth in tight oil output.

Although the rate of drilling has slowed in shale plays such as the Bakken and Eagle Ford this year, output is still going up due to ongoing and rapid productivity improvements. Moreover in the Permian, where development started relatively late, drilling is still rising rapidly and increases here are likely to be the big driver of US oil production growth over the next few years. With domestic US oil prices (as represented by WTI) trading at well above $90/barrel and well-head discounts having contracted (eg, the discount that Bakken oil producers have to live with has shrunk to just -$3/barrel from -$28 in early 2012), prices are at a level that will continue to incentivise investments in new output.

The short-term implications of these trends are clear. It is likely that big upward revisions to forecasts of 2013 growth in US output by the major forecasters will need to be implemented soon. For now we are raising our US oil production forecast to 1.1m bpd from the previous level of 710k bpd and expect others to soon follow suit.

But what are the implications of this rapid growth for the longer term? The current EIA forecast from its Short-Term Energy Outlook report is that by December 2014 the US will be producing over 12m bpd of liquid fuels. That figure suggests there may be something of a mis-match opening up between medium- and long-term projections and perhaps not just for the DOE. The DOE’s own long-term reference or base-case forecast as published in its Annual Energy Outlook (May 2013), projects domestic production of liquids topping out at 11.8m bpd in 2019 and declining thereafter, implying growth of around 3m bpd in total domestic liquid fuels output over the 2011-2020 period (Figure 3) with tight oil contributing around half that growth. Both the IEA and ourselves see growth of a similar order of magnitude (apart from the widely circulated forecast made in March 2012 by another investment bank, and which was a “best possible case” scenario).

However, it is perhaps wise to exercise a degree of caution over longer-term shale oil forecasts and for now we are sticking with our 2020 projections which imply a sharp slowdown in tight oil production compared with current levels. This is partly because of the steepness of decline rates for shale oil wells. For example, after two years a typical well in the Bakken-Three Forks drilled in 2012 is likely to be producing at less than 30% of its initial production rate. It also reflects the likelihood that many of the best plays for crude oil extraction are being developed early (recent disappointing performance relative to expectations at the newer Utica shale play in the north-east US and Canada backs this up) and that a lot of the very big productivity gains (shortened well drilling times, increased initial production rates and better rig efficiency) have already been made.

A final very good reason for scepticism around some of the more ambitious projections of US shale output is the existence of numerous logistical barriers. These include a lack of pipeline capacity, which despite recent expansions, is still a major constraint forcing regional producers to accept discounts that can often be wide and volatile in order to get their oil to market. A sustained acceleration in shale output growth would likely stretch the US distribution system for crude oil to breaking point.

The associated uncertainty over price levels and take-away options would create a very difficult climate to invest in the intensive and costly drilling programs necessary to keep shale output growing.

See the original article >>

Trade Stocks Based Solely on Candle Size?

by Greg Harmon

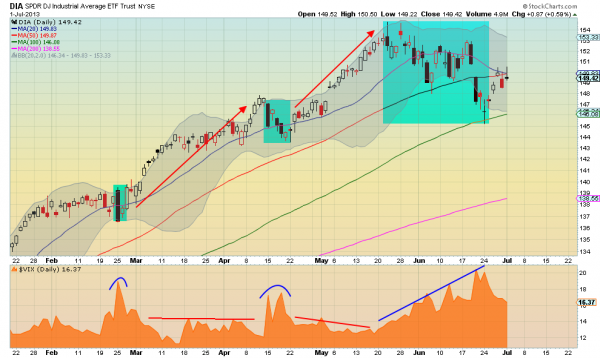
Sounds crazy doesn’t it? But not really. You already look at spikes in volatility as a bearish event in a rising trend. And how is a spike in volatility measured? The Volatility Index ($VIX) is used by most to measure volatility. The default measure. It is a direct measure of the near strike options activity on the SPX options. But this is not the only way to measure volatility. Volatility itself could be defined as a wider range day. In the chart below I have highlighted the wide range days over the last 4 months. They coincide with spikes in the VIX. So it fits on that basis. But take this picture a bit further. Cover the bottom panel now. If you were to look only at the candlesticks and sell when the the candles got bigger and then bought

dia

back when they got smaller again how would you have done over this timeframe? Pretty well it turns out. You would have pockets 22 points in the SPDR DJ Industrials ETF, $DIA, from February 28 through July 1st. The DIA itself is up only 11 points. Pay attention to changes in the range. Is the range shrinking again?

See the original article >>

Treasuries in tightest range in 2 weeks as factory jobs decline

By Susanne Walker

Treasuries traded in the narrowest range in almost two weeks as a measure of U.S. factory employment dropped last month to the lowest in almost four years, even as manufacturing rebounded.

Benchmark 10-year note yields erased an earlier gain after an Institute for Supply Management report showed factory employment dropped to 48.7, the lowest since September 2009, from 50.1. U.S. government securities handed investors a loss of 2.5% in the first six months of 2013, the biggest decline since the first half of 2009, according to Bank of America Merrill Lynch data. A Labor Department report July 5 is forecast to show the U.S. added 165,000 jobs.

“People are risk averse right now,” said Tom Porcelli, chief U.S. economist at Royal Bank of Canada’s RBC Capital Markets unit, one of 21 primary dealers that trade with the Federal Reserve. “If you look at this report in its entirety, you come away with the conclusion that it’s a mixed report -- employment slipped.”

The benchmark 10-year yield was little changed at 2.49% at 2:29 p.m. New York time, according to Bloomberg Bond Trader prices. It earlier rose six basis points, or 0.06 percentage point. The price of the 1.75% note due in May 2023 was 93 1/2.

The yield traded in a 7.8 basis-point range, the narrowest since June 18.

Even after recent increases, the Treasury 10-year yield is still about a percentage point below its decade average of 3.56%.

Treasury Volatility

Volatility in Treasuries as measured by the Merrill Lynch Option Volatility Estimate MOVE Index closed at 97.13 on June 27, down from 110.98 on June 24, the highest since November 2011.

The Fed is buying $85 billion of Treasuries and mortgage- backed securities each month to support the economy by putting downward pressure on borrowing costs, including $3.14 billion in Treasuries today maturing between August 2020 and May 2023, according to the New York Fed’s Website.

Bernanke said on June 19 the central bank could reduce its monthly purchases if the employment outlook shows sustained improvement. U.S. employers added workers last month, a survey showed before the Labor Department data this week, after hiring 175,000 in May.

Bond Outflows

“Friday’s data will be the apex of this week,” said Larry Milstein, managing director in New York of government-debt trading at R.W. Pressprich & Co. “The economic numbers are still not amazingly strong.”

The ISM’s manufacturing index climbed to a three-month high of 50.9 from 49 in May, the Tempe, Arizona-based group said today. The median forecast of 85 economists surveyed by Bloomberg called for the measure to rise to 50.5. A reading of 50 is the dividing line between expansion and contraction.

Investors who poured $1.26 trillion into bond funds in the past six years pulled out record amounts of cash last month, leaving the world’s biggest fixed-income managers struggling to stem the flow.

The funds saw $61.7 billion of withdrawals as money market mutual-fund assets rose $8.17 billion in the week ended June 25, according to TrimTabs Investment Research and the Money Fund Report.

Bank of America Merrill Lynch’s Global Broad Market Index dropped 2.9% in the past two months, the most since the inception of the daily gauge in 1996, as Bernanke laid out possibilities for reducing the $85 billion in monthly bond purchases supporting the economy.

‘Inflection Point’

Market bears say losses are just getting started because yields barely exceed inflation, leaving little relative value in bonds as the global economy improves. Pacific Investment Management Co., BlackRock Inc. and DoubleLine Capital LP, which together oversee about $6 trillion in assets, said the worst is already over because the securities are fairly valued.

“We are at a definite inflection point,” Richard Schlanger, who helps invest $20 billion in fixed-income securities as a vice president at Pioneer Investments in Boston, said in an interview on June 28. “If this thing continues in this vein, people are going to throw in the towel and you’re going to get this pain trade. And the markets can’t take it. They’d rather see a gradual rise in short-term rates versus a precipitous rise.”

See the original article >>

Great Graphic: Italy's Surprise

by Marc to Market

This Great Graphic depicts the manufacturing PMI for Germany (white), Italy (yellow) and France (green), which are the three largest economic in the euro area.  The chart was made on Bloomberg. 

Not one in a hundred observers would have guessed that the June manufacturing PMI was higher for Italy than Germany and France.  Germany in fact is flat to lower in recent months, while France and Italy are seeing a cyclical recovery.  Incidentally, while Bloomberg's data base does not appear to track Spain's PMI, it was even higher than Italy (50 vs 49.1). 

This does not mean that the contraction in Italy (and Spain) is over, or that Germany is once again the "sick man" in Europe.  It simply means that there is a cyclical recovery under way in the manufacturing sector in Italy and Spain.  This can only serve to reinforce the sense that the bar to additional dramatic action at this juncture by the ECB is quite high.  Yes, access to credit for small businesses and unemployment remains intolerably high, but the policies to address these are not a cut in the refi rate or a negative deposit rate.  

We do suspect that the external sector is playing an important role and in this regard, a weaker euro is part of the solution for the euro area.    There has been dramatic improvement in the current account balances of the European periphery, including Italy and Spain over the last couple of years.  Part of this is a function of the compression of domestic demand, but exports are also improving. 

See the original article >>

Gold Daily and Silver Weekly Charts - Non-Farm Payrolls on Friday

by Jesse

Intraday commentary on the precious metals market is here.
As a reminder this is a holiday week in the US as the markets will be closed on Thursday, July 4 for Independence Day.
And a Happy Canada Day for my many friends and acquaintances in that most decent and honorable of countries. 
I remember,  about twenty years ago, landing in Ottawa. As I came up to passport control, I handed over my paper driver's license with no picture.
"Have you no passport? Is this how you come into a foreign country?" the official asked, holding up my piece of paper with an obvious disdain. "Yes sir I do, and I am very sorry for this. But I did not think to bring it, because since my earliest days growing up not all that far from the Niagara border, I have always considered Canada like a second home."
And with an incredulous laugh at my cheek, and a sweeping wave of his hand, he let me through. That would probably not work so well these days, but this is a true story.
For years when we crossed the border at Niagara we only had to state where we were born and were waved through. I had never once thought of Canada as a foreign land. My wife and I have spent many happy days on vacation and on business in Toronto, Niagara, Montreal, Ottawa, and Québec City.   I have been to Vancouver several times, but never on holiday. Alas, those days are no more.
I think we can expect some interesting things in the precious metals this week.
Typically the more senior people on Wall Street will leave on Tuesday evening for their holiday in the Hamptons.
So trading will be light. Interestingly enough a fairly important Jobs Report is due on Friday morning, and they do not seem to be delaying this until next week. Expected is +175,000 jobs.  As you may recall the financiers like to raid the metals on a Non-Farm Payrolls day.
Tomorrow is 'rally day' on the equity exchange so let's see if the bulls can pull themselves together for one last market operation before their begin their festivities.
I do not think most realize the shocking nature of this excessive move downward in gold and silver.
The manipulation in the paper markets is there for all to see. I cannot help but laugh quietly every time I hear the Lord Haw Haws and the spokesmodels on the financial networks talking about how gold and silver have fallen into disfavor, and how low the volume of physical purchasing has been. They desire what they do not have!
One can keep doubling down on a bluff for too long, and eventually they will be called, and their cards must be shown.
Nothing is more clear to me that the paper gold and silver that has been shorted cannot possibly be covered. It has gone entirely too far. And further price declines to free up bullion from the ETFs, as I have pointed out, is very counter-productive because it is now just stimulating more physical buying in size.
We are entering a new phase of the currency wars, and the metals bears and financiers are worried, despite their bluff and bravado. Their arrogance is so typical as they reach the end of their game.
Yes they are still dangerous in the short term, but they must feel the fear creeping up their spines.  One after another their control frauds and schemes are being exposed.  Their perfidy is there for all to see.
They have been weighed, and are found wanting.

See the original article >>

Dollar Stores are Rising With the Dollar

by Greg Harmon

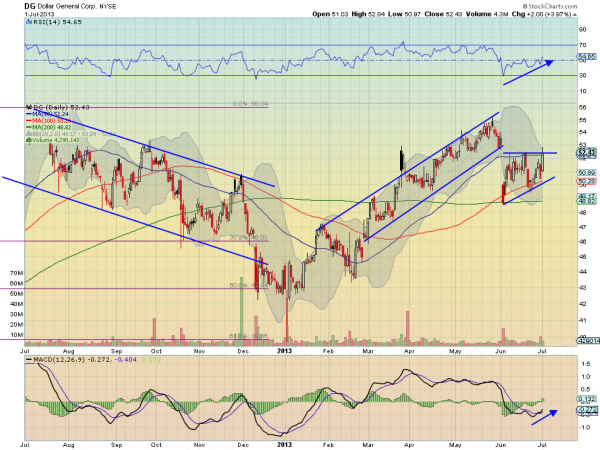
The dollar stores rebounded significantly from their November through March Base, but recently have been either stalled or pulling back. That is now changing. Take a look at Dollar General, $DG. After pulling back to the 200 day Simple Moving Average (SMA) to start June, it has been building an ascending triangle since. Monday it tried to peek over the top but failed. But it looks to have some support to get there. The Relative Strength Index (RSI) is trending higher and the Moving Average Convergence Divergence indicator (MACD) is also turning up and crossed to positive. The Measured Move on the break higher takes it to 56.40.

dg

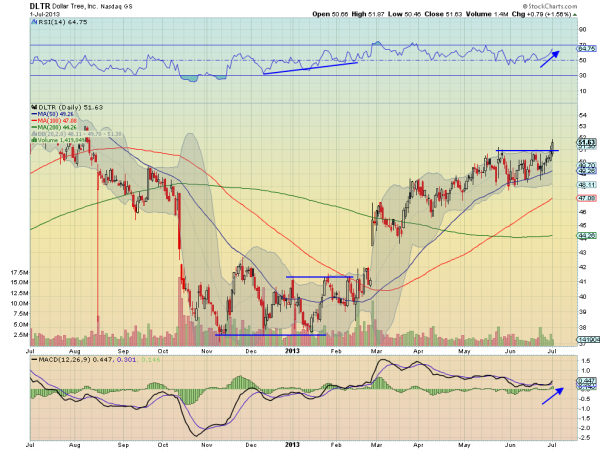
And Dollar Tree, $DLTR, is just as good. In fact it is breaking resistance of an ascending triangle that formed with the 50 day SMA as the base Monday. The Measured Move takes it higher to 55. The RSI is running higher and bullish and the MACD is turning up.

dltr

See the original article >>

Net Bullish Sentiment Drops Sharply

by Lance Roberts

The recent sell off in the markets during the month of June sent the "bulls-a-runnin" with investor sentiment dropping sharply as market prices fell and volatility increased.  However, the plunge in bullish psychology has come with only a mild decline in actual stock market prices as the Fed's liquidity interventions have kept a bid under the markets in recent weeks.  The two charts below are a combined index of weekly survey's of both individual and professional investors.

The first chart shows the "bullish/bearish ratio" which is simply the difference between the sum of the bulls divided by the sum of the bears.  When the index is above 2.0 the markets are generally very overbought and close to a correction. The recent peak at 2.5 was one of the highest levels on this index since 2005 so the subsequent correction was not much of a surprise.  A reading at 1.0, or below, is normally consistent with a greatly oversold market.  While the market has not reached historically oversold levels in terms of sentiment as of yet - it will likely not take too much more of a decline in asset prices, or a rise in volatility, to push investors further into the negative camp.

AAII-IINV-Bull-Bear-Ratio-070113

The second chart shows the data a little differently.  This is the "net bullish ratio" which is simply the number of bullish investors less the negative ones and compared to the S&P 500 index.  Currently, at 5.85, the net bullish ratio has declined to much lower levels of bullish sentiment after reaching a historically high level above 30.  As with the bull/bear ratio above it will likely not take much more of a decline in asset prices, or rise in volatility, to push the number of bullishly biased investors into negative territory.

AAII-NetBullRatio-070113

As a contrarian investor these  indicators suggest that a short term bottom to this recent could be close by.  While bullish and bearish sentiment can give us some short term clues about investor extremes it is important to note that at turning points this data can be somewhat deceiving.  During positive trending markets low bull/bear ratios, and net bearish indications, are typically short term bottoms in a rising trend creating opportune levels to increase equity exposure.  However, in negatively trending markets, such low bullish biases are typically setups for a rally that should be sold into.  During the middle of market trends these actions are somewhat easy to determine:  Bullish trends - buy dips; Bearish trends - sell rallies.  However, it is much more difficult to determine such actions at market inflection points when the market is changing trends.

Currently, it is far too early to tell if the current market action is a topping process or simply just a "rest stop" on its way to further highs.  While the Fed's ongoing liquidity actions certainly suggest higher highs to come; slower profit growth, China/Euro-zone weakness, upcoming fiscal debates and a potential exit from QE could lead to a change in trend ahead.

Regardless, the increasingly negative sentiment of both professional and individual investors does indicate that the markets have begun to reduce some of the overly optimistic sentiment in the market.   Where the next rally takes the markets will tell us much about whether we have seen the peak of this market as of yet - or not.

See the original article >>

‘Total Surveillance’ Officially Brushed Off In Germany

by AuthorWolf Richter
German Chancellor Angela Merkel and her coalition are likely to emerge victoriously from the elections on September 22 – unless a major debacle blows up the equation. So all debacles have been deferred until after the election. The Eurozone debt crisis, Greece or Cyprus, collapsing banks and bailouts, whatever might happen in Italy or Spain, ECB shenanigans – no debacle is allowed to occur until after the election. But just then, over the weekend, a major debacle did happen.

The Spiegel, the largest magazine in Germany, had been able to “see and analyze” some of the documents Edward Snowden had purloined from the NSA. And now the whole world knows that the US intelligence community treated Germany, along with the European Union, France, and other countries, like Cold-War opponents.

Even French President François Hollande tried to slam his fist on the table when he said too softly into the uproar ensuing to his right and left, “we demand that this stop immediately.”

Not Merkel. She’s working furiously on deferring this debacle until after the election. When President Obama was in Berlin, she echoed his words that the then revealed portions of the spy programs had prevented a classified number of terrorist attacks in undisclosed locations on German soil. These programs were necessary to defend Americans as well as Germans against terrorism. Alas, the new revelations show that terrorism is only part of it – that in fact, the NSA has targeted everyone and everything, including companies, bureaucrats, diplomats, and elected politicians.

The NSA collected data on about 500 million phone calls, emails, and text messages per month in Germany alone, the Spiegel reported (article behind paywall) – by far the most of any country on the continent. In France, it was a measly 60 million communications per month.

It confirmed what has long been suspected in Berlin: with White House approval, US intelligence agencies assiduously spy on Germans, German companies, and the German federal government all the way to the top. What’s new is the extent of it – and the possibility, as the Spiegel calls it, of “total surveillance.”

Most intelligence agencies in Western countries are not allowed to spy on their own citizens in their own countries without judicial procedures. That includes the NSA in the US, the Bundesnachrichtendienst (BND) in Germany, and the Government Communications Headquarters (GCHQ) in the UK. But the BND and the GCHQ can spy on US citizens, just like the NSA can spy on German and UK citizens. The logical next step?

The documents show that the agencies work together, that the BND and the GCHQ “assist” the NSA in the surveillance of the internet and telecommunications and that they share data – that is, the BND and the GCHQ might share data on US citizens with the NSA, and the NSA might share data with the BND and the GCHQ on citizens of their countries. Thus, the agencies can get around the limitations on spying on their own citizens. In this manner, all citizens anywhere could be under surveillance by any government, including their own, beyond any kind of effective control and oversight. Hence total surveillance.

While the Spiegel decided not to publish details of operations that could threaten the lives of NSA employees, it wasn’t shy about disclosing how the system worked. Turns out the NSA has bugged the offices of the EU diplomatic representation on K Street in Washington DC and infiltrated its internal computer network, according to a 2010 document. This gave the NSA access to emails, discussions, and internal documents. Total infiltration!

The EU Mission to the United Nations in New York was infiltrated in a similar manner. Documents also showed that the NSA had attacked the telephone system of a building in Brussels that housed the Council of Ministers and the European Council. Those attacks originated from the NSA’s section of the NATO headquarters in Brussels.

Another document explained that the NSA has formed alliances with 80 global companies that support the two missions – defending US networks and spying on other networks. They included telecommunication companies, manufactures of networking equipment, software companies, and security firms, all of them identified only by codename. Which could get a bit tricky for these companies. They assured their clients that their data was secure while simultaneously handing it over to the NSA.

Europeans were outraged. Particularly Germans. They didn’t like being called “targets,” as one of the documents had done, remembering all too well Obama’s and Merkel’s protestations in Berlin that the targets of all this spying were terrorists.

“Reminiscent of methods used by enemies during the Cold War,” is what Justice Minister Sabine Leutheusser-Schnarrenberger, member of Merkel’s junior coalition partner FDP, called it. She has been jumping up and down about the spying scandals ever since the Prism program was revealed.

“The spying has reached dimensions that I didn’t think were possible for a democratic country,” said Elmar Brok, member of Merkel’s CDU and chairman of the Foreign Affairs Committee in the European Parliament. The US, once the land of the free, was “suffering from a security syndrome,” he said. “George Orwell is nothing by comparison.”

“A democratic state that uses Stasi methods sacrifices all its credibility as a moral authority,” Markus Ferber, member of Merkel’s CDU and member of the European Parliament told the Welt.

German and European officials far and wide called the media to get their sound bites in. But Merkel, who started her political career in East Germany under these “Stasi methods” and who is phenomenally popular, remained silent. The consummate political animal has no time for outrage. She’s trying to figure out how to defer that entire debacle until after the election.

But the opposition is trying to drag it by its hair into the election campaign. Peer Steinbrück, the SPD’s chancellor candidate and Merkel’s main challenger, demanded that she start an investigation. SPD Chairman Sigmar Gabriel raised the suspicion that Merkel had known about it all along and had tolerated it – and demanded that she explain herself. Merkel brushed them off with silence.

Meanwhile, a mad scramble has erupted in EU offices around the world to scour buildings for bugs and networks for infestations. The German Foreign Service wants to bring its communication technologies up to date. The Interior Ministry is checking its internal networks. And Merkel’s spokesman had the harshest official words so far: “Monitoring of friends is unacceptable,” he said. “We are no longer in the Cold War.”

That was it, as far as Merkel was concerned. She’d sail right through it, unscathed. And in the German media, the debacle is already moving on to Russia, where Snowden has apparently asked for asylum.

Surveillance goes beyond the internet and communications. A technology that surreptitiously captures data of people out on the street, combines it with other data, and mines it ad infinitum? In the US, local and federal government agencies love it. It’s increasingly sophisticated and cheap. It’s spreading. And it led a professor at the US Military Academy at West Point to warn: “We don’t have a police state in this country, but we have the technology.” Read…. Perfecting The Surveillance Society: If You Drive, You Get Tracked.

See the original article >>

Crude trades near one-week high as stockpiles seen falling

By Ben Sharples

West Texas Intermediate traded near the highest level in more than a week on speculation U.S. crude stockpiles shrank for the first time in a month, signaling increased demand in the world’s largest oil consumer.

Futures were little changed in New York after rising 1.5 percent yesterday amid signs of U.S. economic growth and concern that unrest in Egypt may spread and disrupt Middle East oil supplies. Crude inventories probably fell by 2.63 million barrels last week, a Bloomberg News survey showed before a government report tomorrow. The American Petroleum Institute is scheduled to release separate supply data today.

“It does seem to be a demand-side response from the market,” said Michael McCarthy, a chief market strategist at CMC Markets in Sydney who predicts traders may sell WTI contracts at about $98.50 a barrel. “We’re on alert for a shift to the downside move but given that this is demand-driven and there is potential for supply disruption it’s not impossible this time to see oil go through the top of the range.”

WTI for August delivery was at $97.89 a barrel, down 10 cents, in electronic trading on the New York Mercantile Exchange at 11:55 a.m. Sydney time. The volume of all futures traded was 57 percent below the 100-day average. The contract climbed $1.43 to $97.99 yesterday, the highest close since June 19.

Brent for August settlement declined 2 cents to $102.98 a barrel on the London-based ICE Futures Europe exchange. The European benchmark grade was at a premium of $5.09 to WTI. The spread was $5.01 yesterday, the narrowest based on closing prices since Jan. 4, 2011. It slid below $5 in intraday trading.

Goldman Bet

Goldman Sachs Group Inc. has forecast since February 2012 that the spread would shrink. The bank reiterated in May this year that it would narrow to $5 in the third quarter as new pipeline capacity to move oil out of Cushing expands. The oil- storage hub in Oklahoma is the delivery point for WTI contracts traded in New York.

U.S. gasoline stockpiles probably rose by 600,000 barrels in the week ended June 28, according to the median estimate of 10 analysts surveyed by Bloomberg before tomorrow’s data from the Energy Information Administration. Distillate inventories, including heating oiland diesel, increased by 1 million barrels, the survey shows.

The industry-funded API in Washington collects supply information on a voluntary basis from operators of refineries, bulk terminals and pipelines. The government requires that reports be filed with the EIA, the Energy Department’s statistical arm, for its weekly survey.

Manufacturing Expansion

U.S. factory output rebounded in June as orders picked up. The Institute for Supply Management’s manufacturing index climbed to a three-month high of 50.9 in June from 49 in May, the Tempe, Arizona-based group said yesterday. A reading of 50 is the dividing line between expansion and contraction.

The U.S. accounted for 21 percent of global oil demand last year, according to BP Plc’s Statistical Review of World Energy.

Egypt’s army yesterday gave President Mohamed Mursi 48 hours to respond to the demands of protesters and end a political impasse. The armed forces said the deadline was a “last chance” for everyone and that it would impose its own plans for the future if demands weren’t met. Hours later, it downplayed talk of a military coup, saying it only wants to push for a quick resolution to the current crisis.

Brent’s advance may stall because of technical resistance, according to data compiled by Bloomberg. Futures have traded higher than the 50-day moving average the past three days without settling above it. This indicator is at about $103.25 a barrel today. Investors typically sell contracts when prices fail to breach chart-resistance levels.

See the original article >>

One reason for recent Brent-WTI spread narrowing originated outside the US

by SoberLook

For the first time in some 2.5 years Brent-WTI spread (discussed here) has traded around $5/barrel. The two types of crude oil represent nearly the same product but have been trading at a wide spread due to difficulties of transporting sufficient amounts of North American crude from Cushing Oklahoma, where WTI is settled, to the Gulf of Mexico where it could be delivered to major US refineries or shipped elsewhere as a replacement for the more expensive Brent crude. These delivery challenges have been significantly reduced in the past couple of years. At the same time some technical issues in the North Sea have been resolved to stabilize Brent pricing.

Bloomberg: - The drop in the gap between Brent, a gauge for more than half the world’s oil, and WTI shows how improved pipeline networks and the use of rail links have helped to unlock a glut at America’s oil-storage hub at Cushing, Oklahoma, in line with a prediction made by Goldman Sachs Group Inc. as long ago as February 2012. WTI rose 5.2 percent in the first half of this year. Brent dropped by 8.1 percent as North Sea supplies have stabilized following oilfield maintenance.
“The spread is coming in on anticipation that we’re going to see pipelines get built and more rail capacity put in place,” said Bill O’Grady, chief market strategist at Confluence Investment Management in St. Louis, which oversees $1.4 billion. “There is now a likelihood that not only will U.S. imports drop further, but that the country will be exporting before long.”
But there is one question that still remains unanswered. A major portion of the spread compression to $5 has taken place just in the past few weeks. Moreover, the volatility of the spread has fallen dramatically.

It is highly unlikely that the market just came to a realization in mid-June that "improved pipeline networks and the use of rail links have helped to unlock a glut at America’s oil-storage hub at Cushing". The transport dynamics in the US have been improving for some time - so why should the spread collapse now?
Something else happened in mid-June that started this steady decline. It was the Iranian elections.

CNN: - Iranian centrist candidate Hassan Rouhani won the Islamic republic's presidential election Saturday after campaigning on a "hope and prudence" platform in which he appealed to traditional conservatives and reform-minded voters alike.
Rouhani spoke of reforms without threatening Iran's supreme leader or its institutions, of which he is a product. The former national security council chief promised an environment with greater personal freedoms and even indicated he would free political prisoners and jailed journalists.

The outcome of this election greatly reduced the risk of a major conflict with Iran, thus lowering the "Iran premium" priced in Brent-WTI spread. This premium existed because a military clash with Iran would impact Brent (and similar regional blends) supply and pricing to a far greater extent than WTI. This change also opens the door for a potential lifting of the sanctions against Iran, making supply disruption risks even lower. Given Iran's nuclear work, the risks are clearly still there, but the market is perceiving them to be materially reduced.
While the transport fundamentals in the US have definitely driven the spread lower over the past year, it was the elections results in Iran that precipitated the rapid collapse in this widely watched spread.

See the original article >>

Another Stock Market Pop-n-drop?

By: Anthony_Cherniawski

The commercials are doing it again. You may have noticed that there is a pretty regular ramp in the Pre-Market, then the market goes quiet during the day. At 3:00 or 3:30 the selling begins, with a huge red volume spike into the close. This is a distribution pattern that has continued for over a month, with a few exceptions. Through this method, stocks are being distributed to weak (retail) hands.

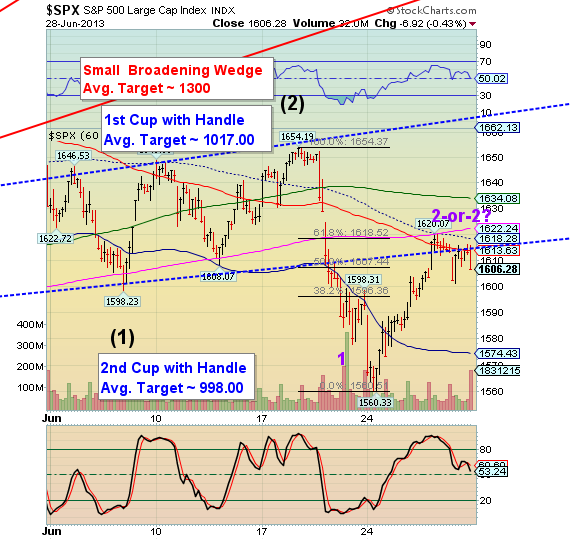
The Pre-Market shows a 6-7 point spike higher this morning, challenging the Lip of the Cup with Handle formation near 1614.00. Chances are good that the spike may stop there, but it could progress back to the declining hourly mid-Cycle resistance at 1618.28. In either event, I expect to see the decline resume today, possibly with some catalyst to break the 1560.33 low.

See the original article >>

U.S. 30 Year Treasury Bonds – A Rally To Sell?

By: Michael_Noonan

Trading opportunities arise every day, however, quality trades that offer an edge do not. We use developing market activity, as depicted in charts, to find trade potentials with a defined limited risk and greater reward potential. 30 Year Bonds appear to be advertising weakness and a shorting opportunity.

When seeking trades, we use the “If, Then,” approach. IF the market does this, THEN we do that. The latter is acted upon only if the former requirements are met. Following this scenario, there is no guesswork or predicting involved, and the emotional element is not in play, either. Discipline is required, but it leads to more profitable trading potentials, so it is worth the effort.

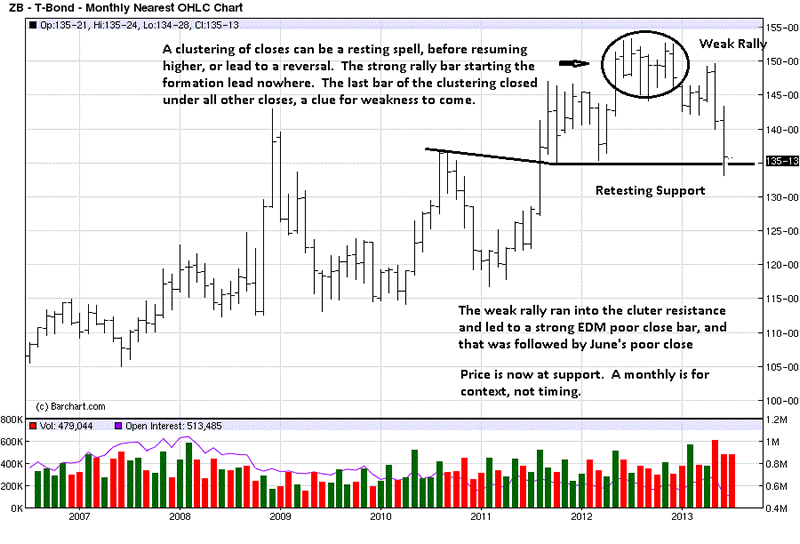
The first step is to put the market into a context, and that comes from assessing the higher, more controlling time frames. We start with the monthly..

The most important first step is to always identify the trend within the time frame under consideration. We look for synergy amongst all time frames to increase the odds of accomplishing a successful trade. From the clustering of closes top formation, a low was established in March, 4th bar from right, a lower swing high two bars later, in May, and another lower low, at the end of June. This is the simplest definition of a downtrend.

Chart comments explain the weakened structure for Bonds since the high. June, the last bar, retested support from 2011 and 2012 lows. The weekly is used to refine the bars.

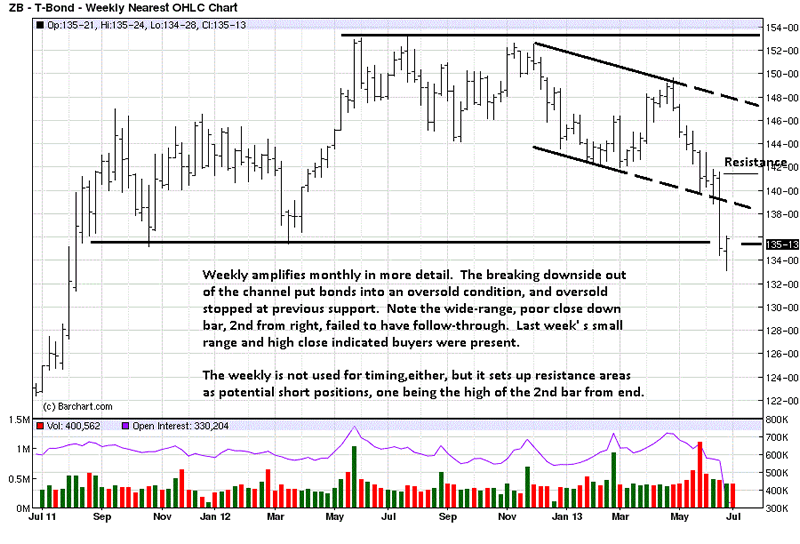
The weekly shows more of a trading range, and the second to last week was a strong move down with a poor close, the market telling us sellers are in charge. But were they? Price declined into support, and leaving the channel put price into an oversold condition. As a consequence, there was no further downside follow-through, as the last weekly bar shows.

The last bar gives added confirmation that support is likely to hold, at least initially. Why? Note how small the range was and the position of the close. The smaller range tells us that buyers were present, not only preventing sellers from extending the market lower, but the high-end close lets us know buyers overwhelmed sellers’ efforts. That is important to know. If short, it would be a good reason to cover and stand aside. This is how to use the information from the market as the best and most reliable guide.

With the trend down, within a larger trading range, it becomes a personal choice of one’s trading skill[s] whether to trade from the long side at this support. We choose not to, and instead look for a weak rally to sell.

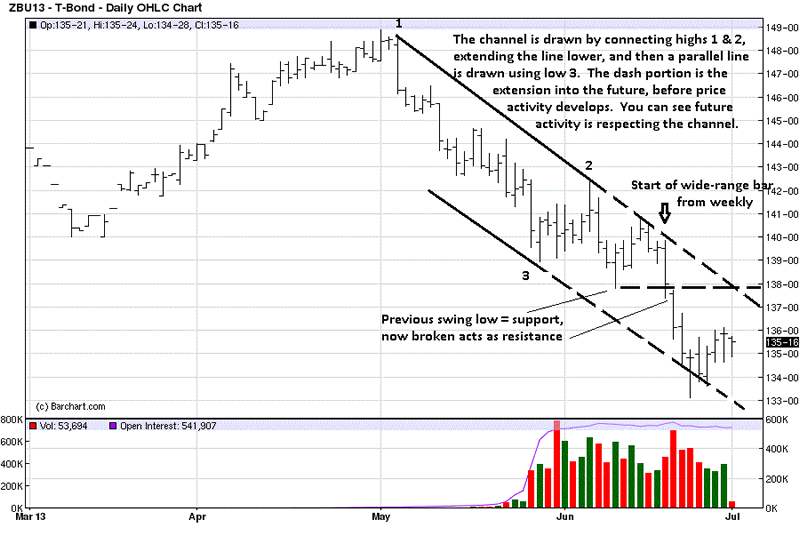
The last five bars on the daily comprise the last small bar from the weekly. While it looked like buyers were stopping sellers, it was more in the form of short-covering, after such a large drop in the weeks preceding. Short-covering is not the same as net new buying. In fact, the last five bars are relatively weak in an ability to rally higher, and that is what can be expected in a downtrend.

A rally against a wide-range down bar can meet resistance anywhere along the bar, from the low up to the high. The down arrow shows the high. However, bonds may run into resistance at where the mid-June swing low support was broken by that wide range bar. The dashed horizontal line from that swing low becomes future potential resistance.

What to look for, right now, is a weak rally. Small ranges up and less volume, relative to larger ranges down on stronger volume constitutes a weak rally, and they typically fail at an area of identified resistance.

If, then.

See the original article >>

Stock Market Forecast - Major Bull Market Cycle Top?

By: Chris_Vermeulen

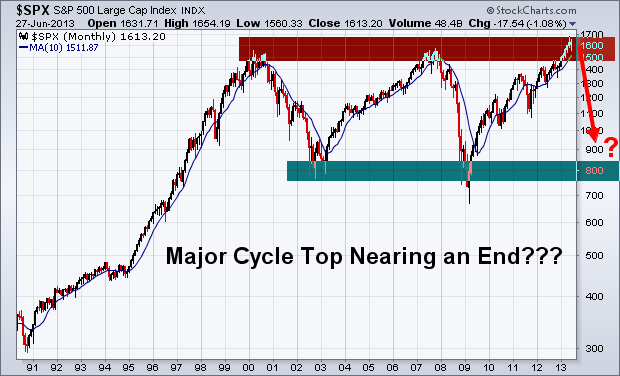
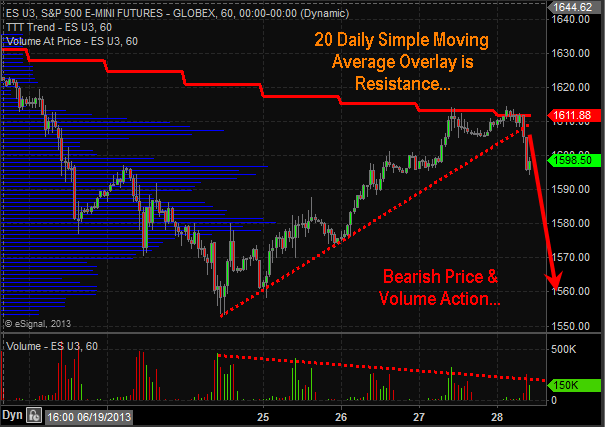
Stocks managed their third session higher as of Thursday June 27th and its too late to jump onto that move. Major indexes and leading stocks have rebounded into resistance along with a few key moving averages. The next 1-3 days favor a pause or pullback at the least simply because of the selling momentum and multiple resistance levels being tested. It is only natural for traders and investors to pull some money off the table or short at these levels.

Stepping back seven days and looking at the overall stock market we have seen a substantial drop in prices across the board. A Ton of stocks have formed their first impulse thrust to the downside which is typically what happens when a stock market is in a topping process (Stage 3 Distribution). The type of damage we had cannot be fixed overnight. This will be a process if it is to resolve to the upside and price action will remain wild (volatile).

The odds from a technical analysis stand point using Price, Momentum, Cycles, Volume and Moving Averages point to lower prices still to come. Actually they point to another 5% drop from the current level.

Major Points to Be Aware Of:

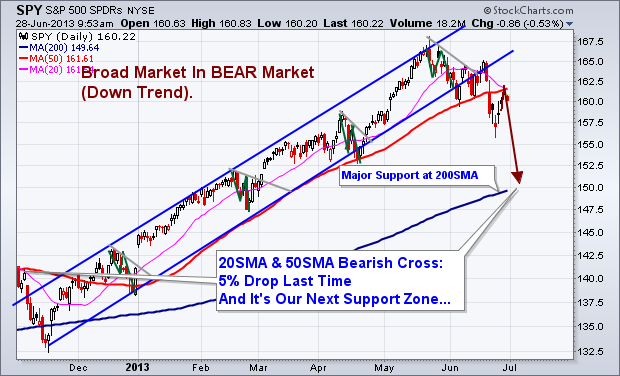
1. 20 Simple Moving Average is crossing below the 50SMA. Last time this took place it triggered a 5% drop in the SP500.

2. Price has bounced for three consecutive days. This typically puts the odds in favor for a pullback.

3. Price bounced and hit it’s head on the 20 and 50 moving averages on Thursday (RESISTANCE).

4. Market Time Cycles are in a decline phase meaning there will be a negative bias and seller will be actively pulling price lower on bounces.

5. Major Long Term Chart looks favorable for a bear market to start which may last 12 months. If so this is just the beginning of some scary yet highly profitable potential trades in the coming year. Stocks fall 3-7 times faster than they rise…

Daily SP500 Trend & Analysis Chart:

Long Term SP500 Trend Chart:

BEARISH SP500 Price & Volume – 60 Minute Intraday Chart:

Looking at these charts from a long term, intermediate and short term basis the odds are favoring lower prices. Being short stocks or buying inverse ETF’s is the current play for the market. But analysis and trends are subject to change depending on price and volume action each week. Do not get your heart set on the BIG picture outlook of a yearlong selloff. That could prove to be dangerous. We take this market one bar or candlestick at a time and trade based on current short term analysis.

See the original article >>

Why I Remain Bullish on Gold Even While Negativity Surges

By: Profit_Confidential

Michael Lombardi writes: Gold bullion prices are taking a hard hit. Headlines are blaring with negativity, and bears continue to say the precious metal is useless. Dear reader, they may have done a good job driving the gold bullion prices lower, but they haven’t changed my opinion on gold one bit. I continue to believe that gold bullion has a shining future ahead.
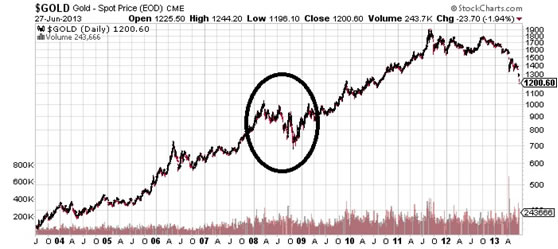
Regardless of the gold bullion prices declining on the paper market, I see demand for the precious metal increasing. It’s giving the average investor another buying opportunity just like they had back in 2008.

Look at the chart below and pay close attention to the circled area. In 2008, gold bullion prices went from above $1,000 an ounce in early 2008, to below $700.00 by end of the year. If I recall correctly, the sentiment from many notable economists was very similar to what we’re hearing today.

Chart courtesy of www.StockCharts.com

But smart investors are buying.
The demand for gold bullion at the U.S. Mint is higher than what it was in 2011, when the precious metal prices were at their peak. So far this year, until June 27, the U.S. Mint has sold 619,000 ounces of gold bullion in coins. This figure is almost 7.5% higher than the same period in 2011, when the Mint sold 576, 000 ounces in gold bullion coins. (Source: U.S. Mint web site, last accessed June 27, 2013.)
Demand from gold bullion–consuming nations like India is robust in spite of the Indian government imposing higher import taxes and its central bank telling Indian banks not to sell gold bullion coins.
The premium paid on the precious metal by Indian consumers doubled on Wednesday, June 26 as suppliers could not meet the demand. Harshad Ajmera, proprietor of wholesaler JJ Gold House in Kolkata, said, “We are unable to supply, though there is demand … we give deliveries after two to three days.” (Source: “Gold premiums jump as physical demand outstrips supply,” Reuters, June 26, 2013.)
On top of this, I see more central banks buying gold bullion than selling. According to data from the International Monetary Fund (IMF), central banks from Russia and Kazakhstan bought the precious metal for the seventh straight month in April. Central banks from nations like Turkey, Belarus, Azerbaijan, and even Greece joined Russia and Kazakhstan on their buying spree that month as well. (Source: Bloomberg, May 27, 2013.)
You need to keep in mind that central banks were net sellers of gold bullion not too long ago, and now they are buying.
So how low can the precious metal’s prices actually go with all the negativity?
It is certainly tough to be a gold bull these days, but what I know is that the greatest opportunities come in times of greatest uncertainty. Currently, gold bullion prices have come under scrutiny and even some of the most well-known gold bullion bugs are turning against the precious metal.
But I believe they’re wrong. While it can still go lower in the short term, the long-term trend still holds.
Michael’s Personal Notes:
A report from the National Institute of Retirement Security (NIRS) found that American households have a shortfall of anywhere between $6.8 trillion to $14.0 trillion when it comes to their retirement savings.
Looking at their assets only in their retirement accounts, 92% of working households in the U.S. economy don’t have enough savings to meet their retirement target. (Source: “The Retirement Savings Crisis: Is It Worse Than We Think?,” National Institute of Retirement Security, June 2013.)
Sadly, that’s just one part of the problem. The report also pointed out that as many as 38 million working-age households in the U.S. economy don’t have any retirement savings. In addition, for all working households, the median retirement savings is just $3,000. For those who are near their retirement, their median retirement savings are just $12,000.
About 67% of working households between the ages of 55 and 64 and with a minimum of one person involved in the jobs market earning income have saved less than the amount of one annual income. (Source: Ibid.)
How will this phenomenon impact the U.S. economy? The effects of a major shortfall in retirement savings can be many, but one of its main victims may just be the already struggling jobs market.
What we already know from the most recent jobs market report is there are almost 12 million unemployed Americans. Most of those who were lucky enough to find a job are working low-wage jobs, like those in the retail sector, or are working part-time.
According to the U.S. Department of Labor, in 2012, there were 284,000 college graduates who were working for minimum wage in the jobs market—a figure that has doubled since 2007, and has increased 70% from 10 years ago. (Source: Wall Street Journal, March 30, 2013.)
As the report cites, there is a significant number of Americans without sufficient savings who are closing in on retirement age. It’s likely that they will stay in the jobs market longer, because they don’t really have any other option.
The jobs market will feel a ripple effect as those who are already looking for work or those who are looking to enter the workforce find fewer openings.
Consider the college graduates working for minimum wage in the jobs market. If they have student debt, they will have troubles paying it off—which will lead to a higher delinquency rate on the already $1.0-trillion student debt load.
And those with lesser skills in the jobs market will have even more difficulties finding work compared to what they see now.
Dear reader, food stamp usage in the U.S. economy is at a dangerous level; and I can see it going even higher as more Americans are unable to find work due to those staying in the jobs market longer rather than retiring.
As we have learned, and similar to Japan’s mishap, printing more paper money helps the stock market and big banks—not the little guy. About two-thirds of U.S. gross domestic product (GDP) is dependent on consumer spending. If consumers are not spending, we have no GDP growth. If consumers pull back on spending, we have negative GDP growth. That’s why I’ve slowly been preparing my readers for another recession. And no stock market I know has ever risen during a recession.

See the original article >>

Egypt's return underpins world wheat trade hopes

by Agrimoney.com

World wheat trade prospects received a boost as Egypt, historically the top importer, returned to tender for the first time in four months, as second-ranked Indonesia was seen buying far more than has been expected.

Egypt's Gasc grain authority - which has historically tendered for wheat twice a month or so - on Monday revealed its first tender since mid-February after a hiatus attributed to the country's financial crisis, which has left it with little cash for foreign purchases.

The tender, for wheat for shipment between August 10-20, surprised investors, coming indeed only minutes after one broker, Brian Henry at Benson Quinn Commodities, said that "given the current situation in Egypt, I have to question just what wheat demand is going to be like from that country going forward.

"Ultimately they don't have many options to feed their people, but they're going to need plenty of help."

Stocks run down

The country has avoided imports by running down inventories and through purchases from the domestic harvest, which has proven a strong one, as in other North African importing countries such as Morocco and Tunisia.

The International Grains Council on Monday lifted by 400,000 tonnes to 9.4m tonnes its estimate for this year's Egyptian wheat harvest, representing a rise of 10.6% year on year.

Egypt's government, which a week ago said it had purchased 3.7m tonnes of wheat from local farmers so far from this harvest, has downplayed its need for imminent imports although Bassem Ouda, minister of supplies, two weeks ago did suggest that purchases might be needed before the end of June.

US Department of Agriculture staff in Cairo have cautioned over the thinness of wheat stocks, with the IGC on Monday forecasting a rise of 200,000 tonnes, to 9.0m tonnes, in Egypt's import needs in 2013-14 despite the bigger harvest.

Indonesia boost

The Gasc announcement follows a, small, victory for feed wheat exporters, after Morocco, a large importer of milling grain, confirmed that it had lifted restrictions on purchases of feed supplies too, although this market is only estimated at some 60,000 tonnes a year.

On a larger scale, Australia & New Zealand Bank on Tuesday flagged the potential for rising wheat imports by Indonesia, the second-ranked buyer after Egypt, driven by the soaring prices of other foods, including rice.

"High food inflation in Indonesia favours higher wheat consumption," Paul Deane, ANZ senior ag economist, said, noting that consumer price inflation is running at 11%, "driven by rising fruit, vegetable, fish and meat prices".

"With higher fuel prices and non-cereal food inflation sweeping through the Indonesian economy, consumers are likely to be particularly cost conscious, favouring consumption of wheat noodle at the expense of other items."

Rice vs wheat

This extends to a preference too for wheat over rice, which is some $425 a tonne more expensive - a gap the bank forecast increasing to some $500 a tonne as pressure from the northern hemisphere harvest lowers wheat prices.

"Seasonal factors should keep Indonesia rice prices supported while wheat prices are expected to still fall further," Mr Deane said.

As an extra boost to wheat import prospects, there is talk that Indonesia may extend a duty hike on flour imports in favour of protecting the domestic milling industry, whose capacity is expected to top 10.0m tonnes this year with the opening of two new mills.

Indonesia's imports will rise by 15% year on year, or some 1m tonnes, over the next 12 months.

The IGC forecasts Indonesian imports in 2013-14 of 6.8m tonnes, a rise of 200,000 tonnes.

See the original article >>

Developing Deflationary Major Forex, Stocks, and Commodity Market Tops

By: Rambus_Chartology

In this report I would like to show you some different currencies that are completing major reversal patterns that should be positive for the US dollar. By the looks of some of the base metals miners BHP, RIO and FCX they seem to be saying that deflation is on the horizon. These big miners look like the HUI before it broke down from its major H&S top pattern.

Lets start with the US dollar that has been rallying back after hitting its long term resistance rail last month in a sharp sell off. I think that was the shake out before the breakout. This first chart of the US dollar shows a nice H&S consolidation that is getting close to breaking the neckline to the upside. A break above the neckline will put the US dollar at a 3 year or so high.

This next chart is a long term look at the dollar that shows the two fractal bottoms. After selling off in June the dollar is now approaching that all important top rail. Remember this is a monthly chart so things change very slowly compared to the minute charts.

This next chart is a comparison chart with the US dollar on top and gold on the bottom. Note the heavy purple dashed vertical line where gold broke below its long term neckline and the dollar broke above its 5 point triangle reversal pattern. As the dollar has been trading sideways, in what is beginning to look like an expanding triangle, gold had been selling off.

This last chart for the US dollar shows the nice rounding bottom with the price action now trading between the top rail and the bottom of the parabolic arc. The sell off we had in June found support just where we needed to see it come in, right at the parabolic arc. So far so good. Nothing is broken.

Lets now look at a few currencies that look like they are putting in some big topping patterns that are just now starting to breakdown. This weekly chart for the Canadian dollar looks an awful lot like the HUI before it broke down. Note the neckline symmetry rail that shows the top for the right shoulder.

The Australian dollar shows a beautiful blue 5 point triangle reversal pattern with a 7 point rectangle reversal pattern that formed out toward the apex. After breaking out through the bottom rail of the blue triangle you can see one quick little backtest before prices started to fall in earnest.

The British Pound has broken down from a triangle consolidation pattern and has had two backtest with the second one completing two weeks ago by the looks of it.

The Yen had a nice big H&S top before it broke down.

The XEU has been holding up pretty well compared to some of the other currencies. You can see the nice H&S top that has been forming for sometime now with the neckline symmetry rail holding resistance at the top of the right shoulder.

The Euro is the Last Component (and the largest) of the US Dollar Index to hold out . When / If this chart breaks, the deflation scenario will be baked into the Charts

…………………….

PART 2 :

In the second part of the Weekend Report I AM going to show you some charts for the risk off trade where commodities show weakness in a deflationary type setting. This generally happens with a strong dollar as I showed you in part 1 , with the strong dollar and weak currencies charts.

The first chart I would like to show you is the CCI commodities index that topped out in 2011 and has been in a slow downtrend that has taken on the shape of an expanding downtrend channel. Note the black dashed horizontal trendline labeled the S&R rail, support and resistance rail. Above is support and below it becomes resistance. As you can see by last weeks price action the CCI traded below that important S&R rail for the first time in a long time.

The old CRB index has been much weaker than the newer version of the CCI as it failed to make a new all time high back in 2011 and actually made a much lower high. You can see the H&S consolidation pattern that has formed on the right side of the chart that is now starting to breakdown after doing the breakout and backtesting move. It to is in an expanding downtrend channel.

I mentioned last night that some of the big base metals miners are showing some big H&S topping patterns. BHP has a very similar looking H&S top that the HUI has, only the HUI has led the way lower by breaking its neckline back in February of this year a good 4 1/2 months ago. There could now be a backtest to the underside of the the neckline before the real move begins lower.

The monthly chart for BHP looks extremely bearish as that H&S top is sitting right at the end of the 2008 crash low rally. Remember this is a monthly chart that takes a lot of time to build out a big topping pattern, but when it is finally complete there will be a big impulse move down. Right now it’s all about patience to see if it does a backtest to the underside of the neckline.

RIO is another big miner that shows a similar big H&S topping pattern with the breakout and now the possible backtest underway. Again, look at a 6 year weekly chart of at any of the precious metals stock indexes to see what awaits the completion of this big H&S topping pattern.

RIO monthly.

FCX has created a complex topping pattern that consists of an unbalanced H&S top with a 5 point triangle reversal pattern. It has been taking its sweet ole time breaking out and backtesting. There is a good chance it has finished the backtesting process. We won’t know for sure until the impulse move down starts in earnest.

FCX monthly.

Lets take a look at copper as that commodity really crashed during the 2008 deflationary episode. As the weekly chart shows copper made a H&S top back in 2011 which broke to the downside followed by the 6 point blue triangle consolidation pattern which also has broken down.

Notice the last bar on this monthly copper chart that shows it’s really close to making a multi year low with just a little more weakness. As you can see on the left side of the chart, impulse moves start when these big patterns finish building out. Chop chop chop and then bang.

KOL is a coal etf that is now starting to move lower after a long drawn out breakout and backtest.

SLX is a steel etf that just recently has broken down from a triangle consolidation pattern.

The GASO, gasoline chart, is still trading at the center dashed rail of a very large rectangle pattern. Many times a failure at the center of a rectangle will led to the breakout move.

The oil chart shows a potential large H&S top pattern. The blue triangle on the right side of the chart that is trying to form the right shoulder and has done a little morphing lately breaking slightly above and below the top and bottom blue rails. So we wait for further developments.

This last chart I’ve overlaid gold on top of the US dollar so you can see the inverse relationship between the two. It’s not always perfect but they tend to run opposite of each other. Notice the price action back in 2001 when the US dollar topped out and gold bottomed out. Now fast forward to our most recent price action where just the opposite is happening right now where gold is topping and the US dollar is bottoming. I’ve circled the area in 2006 where gold and the dollar crossed paths on their way to gold’s top and the dollar bottom. Is gold and the US dollar going to cross paths again in the not to distance future? Time will tell. It always does. All the best…Rambus

PS

These long term charts that I’ve been posting on the US dollar, currencies, and commodities are painting a picture of deflation IMHO. These are huge topping patterns that aren’t going to play out in weeks or months but possibly several years. I think the precious metals complex has been leading the way down with the currencies and commodities playing catch up at some point. We have to get the main trend right so we’ll know how to play this deflationary episode. That is 75% of the game. Trade with the big trend whenever possible. I think once the deflation period ends that is when we’ll see the real inflation picture take hold. We will know when the time comes by the bases that will have to be built just as these topping patterns are showing us the way lower now. Big trends don’t change on a dime, it’s like turning the Titanic around. At some point the US dollar and gold may cross each others path again. Maybe they will kiss each other and reverse back the way they came. We just have to watch the price action for clues. All the best…Rambus

See the original article >>

Follow Us