by Greg Harmon
Sounds crazy doesn’t it? But not really. You already look at spikes in volatility as a bearish event in a rising trend. And how is a spike in volatility measured? The Volatility Index ($VIX) is used by most to measure volatility. The default measure. It is a direct measure of the near strike options activity on the SPX options. But this is not the only way to measure volatility. Volatility itself could be defined as a wider range day. In the chart below I have highlighted the wide range days over the last 4 months. They coincide with spikes in the VIX. So it fits on that basis. But take this picture a bit further. Cover the bottom panel now. If you were to look only at the candlesticks and sell when the the candles got bigger and then bought
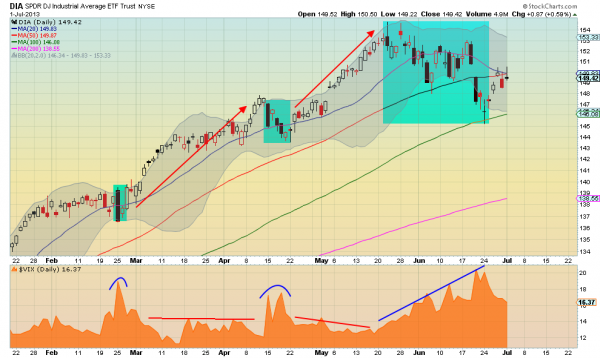
back when they got smaller again how would you have done over this timeframe? Pretty well it turns out. You would have pockets 22 points in the SPDR DJ Industrials ETF, $DIA, from February 28 through July 1st. The DIA itself is up only 11 points. Pay attention to changes in the range. Is the range shrinking again?
No comments:
Post a Comment