Sunday, April 24, 2011

World Sugar Update: Strong Production Numbers From Brazil and India

by Michael Ferrari

Following the run up to nearly 33 cents, world sugar futures have retreated and stayed in the 22-24 cent range for much of the week. The market is expecting strong production numbers from Brazil and India, the two largest producers, and there seems to be optimism among analysts that the global S-D balance will finally shift to the surplus side in the coming months.

In the USDA Foreign Agriculture Service (FAS) April attache report, their outlook stated that Brazil cane production will increase 2% (to 631 mmt) in the 2011/12 marketing year (MY), with 569 mmt of this volume coming from the Centre-South; the 569 mmt projection is +12mmt over the 2010/11 MY and largely the result of an expansion of hectares for sugarcane, rather than a favorable weather pattern.

See the table below taken from the attache report for harvested hectares over the last 6 seasons. This is confirmed by the relatively flat total reducing sugar (TRS, or industrial yield) when analyzed Y/Y. Readers should note that a drier pattern in key mid/late crop months actually serves to boost yields, and tends not to be an inhibiting factor.

[Click to enlarge]

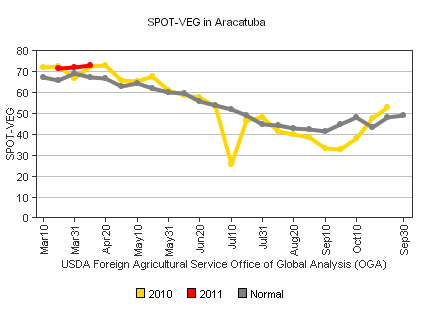
While the Weather Trends view is also for an increase in Y/Y production for BR (between +1.3% and +1.6%), we feel that the USDA estimate may be too optimistic. Further, even with higher production numbers out of Brazil, domestic ethanol demand for flex-fuel cars coupled with high crude prices will still keep a premium built into the #11 price, so the downside price potential remains limited between now and October. Satellite derived vegetation indices for many of the Centre-South cane growing regions are on par with last year which was considered an average weather year for cane in BR.

Other FAS estimates carrying significance include their view for Indian sugar production to increase 10% for the 2011/12 marketing year (Oct/Sep) to 28.3 mmt raw value as a function of higher total cane production.

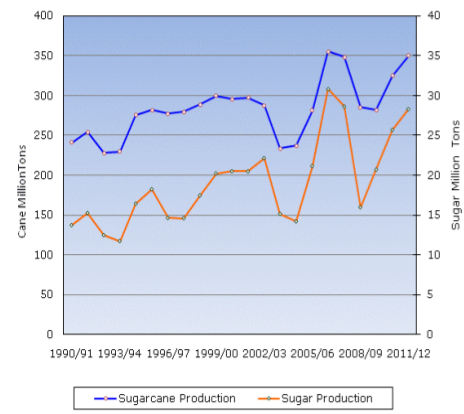
The April FAS attache report fort India includes the illustrative chart below from the India Ministry of Agriculture, which shows total cane production and sugar production since the 1990/91 MY. This shows how in recent years, technological advances as well as the increased demand for raw sugar is allowing growers to extract more sugar per metric ton.

Last year’s gain was also in part due to higher plantings following the Monsoon failure during the previous 2009 season, so the first year in the new retune crop will provide the strongest Y/Y lift; we will still look for a similar increase this year as projected plantings are up again, but as with Brazil, the numbers may be slightly lower than the FAS expectation.

So what does this mean for price? The onset and the seasonal behavior of the 2011 Indian Monsoon will therefore become a key factor in assessing yield potential this year, and this will be a key variable towards ultimately translating what the crop potential means for the global supply balance sheet into 2012. Further, while Brazil is looking at a favorable supply scenario, ethanol demand, crude oil prices and the relative strength of the BR real will be equally important in assessing price risk and potential.

Happy Easter From Trading Weeks

The Global Stocks Bull Market


Wild week for most equity markets worldwide. Entering monday’s US opening foreign markets were lower, and then made a bigger drop when S&P downgraded US debt to negative watch. No comment. The US market gapped down at the opening to new pullback lows. By 11:00, however, the selling was over and the market rallied into the end of the week. For the week the SPX/DOW were +1.3%, and the NDX/NAZ were +2.3%. Asian markets gained 0.6%, European markets added 0.7%, the Commodity equity group rose 0.8%, and the DJ World index rallied 1.7%. Bonds were +0.1%, Crude gained 2.1%, Gold made new all time highs +1.2%, and the USD lost 1.1%.

The economic calendar was quite light. Positives outgained negatives by 7:4. On the negative side: the NAHB/FHFA housing indices declined, along with the Philly FED and the M1-multiplier. On the positive side: housing starts, building permits, existing home sales all improved, along with, weekly jobless claims, leading indicators, the WLEI, and the monetary base made a new all time high. This week we have a tue/wed FOMC meeting and Q1 GDP.

LONG TERM: bull market

In global markets bull and bear equity stock markets rarely occur in isolation. Growth in some countries is usually not enough to drive equity prices higher in those countries unless there is a worldwide growing optimism. In example, China and India’s economies continued to grow throughout the 2007 to 2009 worldwide bear market. Their economic growth certainly did not prevent major declines in their stock markets. Therefore, for one to take a bullish or bearish stance in one equity market generally requires the observation of the same activity in many equity markets worldwide.


The Dow Jones World index provides a view of the entire global equity market by tracking the highest capitalization stocks in the world. Observe the bear market from 2007 – 2009. Then the current bull market from the March 2009 low at 130 in the index. Recently Major wave 3 of Primary III kicked off, and this index is now making new bull market highs.

In our daily review of the overnight market activity we refer to Asia, Europe, and then the US. We track several markets in each region and many indices in the US. However, our bellwether indices for each region are the following. In Asia, Hong Kong’s HSI:


In Europe England’s FTSE, and in the US the DOW.


Notice the wave patterns of all three of these bellwether indices were decidedly bearish during the bear market, and are decidedly bullish now. The DOW, in fact, has the same exact wave structure as the DJW. Bull and bear equity markets rarely occur in isolation.

MEDIUM TERM: uptrend high SPX 1339

Remaining with our global theme. In our weekend update, and sometimes during the week, we note the trend confirmations in the various worldwide indices we track. A few indices may take the lead during one trend, while others lead during another. Generally, it’s the overall trend movement that we track. Currently 11 of the 15 world indices we track are in confirmed uptrends. This is bullish worldwide.


The current uptrend started at the Major wave 2 low of SPX 1249 in March. This uptrend, Major wave 3, should unfold in five Intermediate waves. Intermediate wave one ended at SPX 1339 in early April, and Intermediate wave two appears to have completed this past monday at SPX 1295. Nearly a perfect 50% retracement. Intermediate wave three should be underway now. Overall, we’re expecting this uptrend to end in June between SPX 1440 and 1462. The SPX closed at 1337 this week.

SHORT TERM


Support for the SPX remains at 1313 and then 1303, with resistance at 1363 and then 1372. Short term momentum ended the week quite overbought. Last weekend it appeared that Intermediate wave two had completed at SPX 1302 and the market was rallying. On monday the entire rally was wiped out on a gap down, the SPX made a new pullback low at 1295, and then the market rallied again. The final pattern looks a bit more complex, but still an ABC down from SPX 1339. Nevertheless, the action off monday’s low has been quite constructive with two gap up openings and a 42 spx point, (3.2%), rally in just three trading days. Short term support is at SPX 1324 and then the 1313 and 1303 pivots. Resistance is at 1339/1344 and then the 1363 and 1372 pivots. Expecting new bull market highs next week. Best to your trading!

FOREIGN MARKETS

Asian markets were mostly higher on the week for a net gain of 0.6%. Only Japan’s NIKK has not confirmed an uptrend.

European markets were all higher on the week for a net gain of 0.7%. The Swiss SMI and the STOX 50 remain unconfirmed as well.

The Commodity equity group were all higher on the week for a net gain of 0.8%. Brazil’s BVSP confirmed a downtrend during the recent pullback.

The DJ World index remains uptrending and gained 1.7% on the week.

COMMODITIES

Bonds remain in their 3+ year trading range and were +0.1% on the week. Since 2008 10YR yields have remained between 2.04% and 4.32%. We do not see this changing for several more years.

Crude gained 2.1% on the week as its uptrend continues.

Gold gained 1.2% for the week, hitting $1500, as its uptrend continues. Silver’s (+8.4%) weekly chart looks parabolic, but it’s daily chart look fine.

The USD made a new yearly low losing 1.1% on the week and dropping below 74.0 DXY. Next support is at 71.31.

See the original article >>

Why Bank and Debt Crises are Helping the Gold and Silver Prices


Some months back we pointed out that in their present form, banks had become the arteries and veins of the financial worlds with central banks the heart. Unfortunately, banks are driven solely by the profit motive. As they grew into every aspect of people's financial lives, they failed to take on the corresponding social responsibilities that they came with it.

The result is that when their greed went too far and the banking system was threatened with collapse, they had to be bailed out by their customers at the retail level, the taxpayers. Since then, they have recovered but are not vibrantly underpinning the economies in which their customers are based to promote a recovery. Still, their total thrust is for profits, meaning that there is just not enough banking support to invigorate developed world economies. Worse still, the public perception of bankers has been eroded so far, it's common to hear them described as 'banksters.'

The battle begins

The British government has just received a banking report on the reforms needed for its banking industry. In it, they have ring-fenced retail banking to ensure taxpayers will not need to bail out the banks and will avoid the most profitable risks banks take. That investment side will be separated so that should it fail then it will be allowed to collapse without impacting the nation's economy.

But have no doubt that this is not an amicable reform because it limits banks' profit opportunities and ensures they face the risks of their own actions.

But most big banks can move out of the country and minimize their overall adherence to such regulatory reforms. It is in fact a war situation, profits versus responsibilities. If they move, which makes sense from the shareholders point of view, then they will in effect have refused to face their responsibilities. If they accept these changes, they will have been forced to change by government.

Which way will this battle go? We have no doubt that bankers have to seek maximum profits in any legal way they can. It would be anti-shareholder to bow to government regulations if they don't have to. We see this battle becoming global as is the interlinked web of banking. Ireland is what happens when banks chase profits irrespective of the impact of their actions, leaving the Irish taxpayer as collateral damage. In the face of greater regulation and control from government aimed at bringing stability and lowering risks, are the banks cooperating? To date the banks have acted as follows: -
  • Germany's biggest lender plans to alter the status of its main U.S. subsidiary in response to capital rules being imposed under a U.S. regulatory overhaul. The restructuring will help the subsidiary, known as Taunus Corp. shed its status as a bank holding company, which would have subjected it to the capital rules. Instead, the firm will move a U.S. banking unit out of Taunus and link it to the Frankfurt-based parent. Deutsche Bank estimated last year it might need to inject almost $20 billion into Taunus to comply with the rules.
  • Overseas lenders, including Barclays Plc., are altering their U.S. holding subsidiaries because the Dodd-Frank Act of 2010 would otherwise force the divisions to comply with the same capital rules as domestic banks. Barclays said it de-registered Barclays Group U.S. as a bank-holding company, partly to sidestep the capital requirements. Non-U.S. banks were previously exempt as long as their foreign parents were regulated by a government-recognized watchdog. The U.S. bank unit holds $45.5 billion in assets and $17.7 billion in U.S. deposits. The unit counts the Federal Reserve as its primary regulator, according to the FDIC.
Why does this concern the Gold Forecaster? Because this is yet another fundamental structural reason why the gold price is rising and will continue to rise.

The loss of reputation through greed and dishonesty

But bankers are not simply ducking reformation; by their actions they are ensuring the continuous decay of trust in banking and the banking system. This 'battle' has and will continue to breed distrust in banks as they do not usually work for the advantage of their clients and depositors. The pages of the media have been replete with tales of conflict of interest, settlements out of court, of depositors being taken advantage of by their banks, by making profits out of their own customer's bank-backed ventures even when they failed. The attrition of trust in the banks has alarmed many, who are slowly becoming gold and silver investors and will continue to do so.

In the States, while we have seen a public grilling of leading bank executives, what changes have taken place to ensure it does not happen again? Has the housing market recovered from the games the bank's played with mortgages? [We have persistently said from 2007 onwards that unless the consumer/homeowners is thriving again, there is little prospect of there being a long lasting fundamentally sound recovery in the U.S.] Has the banking industry acted in concert with government to re-invigorate the economy - no! Have they made every effort to find ways to stimulate the housing market to resuscitate the consumer and get the economy back on track? No! So long as banking structures remains solely profit orientated, they will encourage investors to turn to gold and silver.

Have the criminal actions of bankers been prosecuted? Congress has issued a long-awaited report that is in the process of shocking the public and undermining even further the credibility of the banking system. Here are some comments from that report:

Lawmaker Levin, when commenting on the report at its release, accused Goldman Sachs, one of the largest U.S. banks, "of profiting at clients' expense as the mortgage market crashed in 2007. In my judgment, Goldman clearly misled their clients and they misled Congress," he said. Add this to other comments, "Blame for this mess lies everywhere -- from federal regulators who cast a blind eye, Wall Street bankers who let greed run wild and members of Congress who failed to provide oversight. It shows without a doubt the lack of ethics in some of our financial institutions who embraced known conflicts of interest to accomplish wealth for themselves, not caring about the outcome for their customers." The report pulls back the curtain on shoddy, risky, deceptive practices on the part of a lot of major financial institutions," Mr. Levin said. The report also asks federal regulators to examine its findings for violations of laws.

Now here's the shocker that came out last week; The Federal Reserve said it has taken enforcement action against 10 banks over "a pattern of misconduct and negligence related to deficient practices in residential mortgage loan servicing and foreclosure processing. These deficiencies represent significant and pervasive compliance failures and unsafe and unsound practices at these institutions." The banks are Bank of America, Citigroup, Ally Financial, the HSBC North America unit of HSBC Holdings, J.P. Morgan Chase, MetLife, PNC Financial Services, SunTrust Banks, U.S. Bancorp and Wells Fargo.

In addition to the actions against the banking organizations, the Federal Reserve announced formal enforcement actions against Lender Processing Services, Inc., a domestic provider of default-management services and other services related to foreclosures, and against MERSCORP, Inc., which provides services related to tracking and registering residential mortgage ownership and servicing, acts as mortgagee of record on behalf of lenders and servicers, and initiates foreclosure actions.

We are of the opinion that there is little chance of bankers moving away from the profit motive or of lawmakers enforcing social responsibility on bankers.

What is remarkable in the last few years has been the increasing visibility of the actions of bankers and the very public loss of reputation. How long will it take for developed world investors to turn away from their financial systems as Indian investors have done for so many decades and use cash and gold and property in an 'alternative' financial system? Or are they too locked-in to escape?

Gold and silver cannot be dishonest

Yes, they are both metals that in so many cases are mined to be put back underground and earn no income, but they are instruments that have avoided the investment warfare that is common in the banking system and monetary system as we are seeing from the Levin report. Let's not say this is just the U.S., --it's global, wherever there is a banking system.

Note what income depositors receive after bank charges and deduct inflation to see 'real' interest rates. The saver is losing hands down, yet the bank can use his money up to sixteen times in ventures of their choosing that will usually make hefty profits. The realization of the paucity of bank deposits as investments has not caught on and banks have ways to ensure that even passing temporary deposits are available for their use. Perhaps Abraham Lincoln was wrong in that you can 'fool all the people, all of the time.' If investors had, had gold, it would be somewhere north of $10,000 by now.

In India, cash and gold yield income in the hands of its owners. Their activities escape corrupt bankers and government officials and corrupt lawmakers. They must laugh when they read reports such as the above and say, 'haven't you learned yet?' Not only does gold provide for private commercial deals of many kinds, it increases in price. Their total return on gold has been nearly 500% in the last 11 years. What's been the return on the broad spectrum of developed world investments, including bank deposits? Who cares that there is no annual income on gold and silver, there's an incredible total return? They would laugh at the concept of getting small 'real interest' returns from their investment in banks.

Most importantly, gold and silver bullion, by itself, are places to escape dishonesty and all the common, unethical, core practices of the financial system. Precious metals don't lie, cannot be unethical, do not have conflicts of interest but are respected by all their investors, whatever the state of these investor's own morality.

So long as this situation persists in the banking world, gold and silver will be bought as long-term money and honest investments.

See the original article >>

Where Next for Gold,Silver and the Stock Market SP500 Index?


The market action in both the precious metals complex and the equities markets has been moving in clearly defined Fibonacci and Elliott Wave patterns for quite some time now. All of the recent peaks and valleys in both areas can be clearly demarcated with Fibonacci retracements and crowd behavioral patterns both in advance and in hindsight. I’ve written about this phenomenon numerous times publicly and every week for my subscribers as well.

The Gold and Silver movements I outlined a few months ago well in advance of the current bull moves. I had suggested we would see 1525-1550 on Gold at the next interim peak back in late January from the 1310 lows. So far we have hit $1508 and near term $1518 is likely before a pullback to the 1480 ranges. Silver has run up to my 45-47 window that I forecasted back when Silver was in the mid $26 ranges. The question is then, what happens next?

Back in August of 2009 I forecasted that we were about to enter a very bullish five year window for the precious metals, and this is based on my theory of a 13 fibonacci year bull market that began in 2001. Crowds move in reliable patterns and my opinion is the movement we are seeing now is the biggest of the 13 year bull because there is “Crowd recognition”. Recall the huge bull market in tech stocks that began in 1986 and ended 13 years later in 1999 with a massive spike to 5000 on the NASDAQ. The final five years were the best for investors before the crash.

Looking at the current precious metals bull market, we are in year 10 now and it’s like 1997 in the Tech stocks. The best is still yet to come, but there will be peaks and valleys along the way as the Bull knocks everyone off the whole way up. Most recently at $1310 in January and only a few weeks ago at $1382 for instance. When I wrote the August 2009 article, gold was around $900 per ounce, and now it’s $1508. In August of 2010 I then forecasted that Silver was about to start a massive run from $19 per ounce, and since then we have rallied to near $47 in just 8-9 months. Silver is poor man’s gold, and my theory really was simply that investors as a herd would view Silver as “cheap” and rush to buy it relative to Gold which would be viewed as “expensive”. The bottom line is intermediately we are getting close to short term tops in both Silver and Gold, and corrections will ensue… but those will again be buying opportunities.


Below are my latest views on Gold and the near term direction:

The Equities markets are also in a multi-year bull market and in the most bullish of the phase as well. We began in March of 2009 and ran up for 13 Fibonacci months to April 2010 where I forecasted an interim top. Since then, we bottomed in July of 2010 in a wave 2 correction that was a 38% Fibonacci retracement of the 13 month rally. The rally to the 1343 highs was only wave 1 of a new 5 wave structure to the upside. The recent correction that surrounded the Japanese Earthquake was another wave 2 down in sentiment, only to be followed by a powerful rally of almost 100 points on the SP 500 index. This type of “shrugging off of bad news” reaction is typical of powerful major 3rd waves in Elliott Wave terms.

The most recent action bottomed at 1295 on the SP 500 and that was minor 2 down, and now what you will see if I’m right is a huge move to over 1400 on the SP 500 as the 3rd wave of this recent structure off the 1240 futures lows of March, begins to take hold. Strap on your seatbelts because this market is going to blast past 1400 and on to 1500 this year. You will also see the NASDAQ lead the charge and make a power move into the 3000’s as well.


Below is my latest chart on the SP 500 Index:

See the original article >>

The “Miracle” of Compound Inflation

By John Mauldin

What the CBO Assumes
Scylla and Charybdis – The Federal Reserve and the FDIC
La Jolla, Toronto, and Cleveland

Albert Einstein is famously quoted as saying, “Compound interest is the eighth wonder of the world.” And compounding is indeed the topic of this week’s shorter than usual letter, but compounding not of interest but of inflation. As you might expect, I am giving a great deal of thought as to how we get out of our current financial dilemma of too much debt and deficits that are far too high. While I will use US data for our illustration, the principles are the same for any country.

Let’s start with a few graphs from the St. Louis Fed database (a true treasure trove of numbers). First, let’s look at nominal GDP over the last 11 years, from the beginning of 2000. The data only goes through the third quarter of last year, so sometime this year it is quite likely that GDP will top $15 trillion.

So, the economy has grown by roughly 50%, right? Give or take, that’s close to 4% growth (back of the napkin calculation). And in dollar terms that is correct. But what if we took out all the growth that was due to inflation? The economy would only have grown to $12.5 trillion. And in fact, “real” or inflation-adjusted GDP growth was just 1.9% on an annualized basis for the last decade, the lowest growth rate since the ’30s. What cost on average $1,000 in 2000 is now $1,250.

Now, to see this in an interesting graph, the Fed has real GDP based on 2005 dollars. You can see that we are about back to where we were in 2008, prior to the crisis, and growing well below trend. But if we adjust for inflation, growth has not been close to what it was in nominal terms.

Now let’s run through a few “what-if” scenarios. What if the next 11 years look more or less like the last, with 4% nominal GDP growth? That would mean that in 2022 nominal GDP would be 50% larger than now, right at $22.5 trillion. But that is with only 2% inflation.

What if inflation were 4%, with the same growth? Then nominal GDP would be $30 trillion! What a roaring economy, except that gas would $8 a gallon (assuming current levels of supply and demand). In essence, you would need $2 to buy what $1 buys today. Don’t even ask about health-care costs. If your pay/income did not double, you would be in much worse shape in terms of lifestyle. That is the insidious nature of inflation.

But let’s think about that from a federal budget perspective. Let’s assume we get 20% of GDP in federal tax revenues, which is roughly a little higher than the historical average. That means total tax revenues would be in the range of $6 trillion. With 2% inflation, revenues would be just $4.5 trillion. If the federal government froze its spending at current levels for 12 years (no inflation adjustment), we would be running large surpluses under either scenario.

Higher inflation means US debt is easier to pay back, as nominal GDP is what we pay taxes on, not inflation-adjusted. Inflation is a tried and true method of dealing with too much debt. Inflation is also just another word for default, but it sounds so much better to the ear.

What the CBO Assumes

The Congressional Budget Office makes projections, based on various Congressional tax bills, as to what future income and expenses might be. But to do that they have to make assumptions about the growth of the economy and inflation. You can go to their website and see their economic forecasting. The data I will be discussing is on page 7, in http://www.cbo.gov/ftpdocs/120xx/doc12039/EconomicTables%5B1%5D.pdf.

Let’s look at one of the tables. Note that they have nominal GDP at $24 trillion in ten years (not far from my 2% inflation scenario above), but they assume rather robust economic growth for the next five years (beginning with 2012) of well over 3% and inflation down around 1.5%. Not a bad world if we could get it.

That’s a growth in nominal GDP of about 4.5%. Interestingly, they make those upbeat growth projections assuming that ALL the Bush tax cuts go away, but that’s a story for another day. They do compare their projections for the next few years with the “Blue Chip” economists, and they are not quite as optimistic as the economists, so this is not outside of mainstream economic thinking.

Look at this table. Think about what it might look like with 2-3-4% average inflation and lower growth. What if we don’t get robust growth? That means higher unemployment for longer periods. And what if (God forbid!) we had a recession? Let’s me see how many in the audience think we can go another ten years without another recession. Especially if we actually do start to cut spending in a manner that might get the deficits under control? I’m not seeing many hands. But it would mean that the debt-to-GDP level might not look as bad, which might just be the plan, in some circles. But not one I want to be included in.

Let’s think about what less-robust growth, more inflation, or a recession would do to budget projections. These are not nice thoughts for what is in Texas a beautiful spring day.

I was asked several times this week if we will see QE3. My answer is, not for some time; but if we had a recession, what would the Fed do? They only have one lever now, as rates are already low. They are likely to print again. Which is inflationary. Which could give us rising inflation with low growth. What’s a Fed to do?
And as it is beautiful outside and I want to find a place to dine al fresco, I will close here and finish this line of thought next week. But I leave you with this wonderful essay by my friend and fishing partner David Kotok, who ponders the very problems the Fed is faced with, while in Italy for a Global Interdependence Center event. Does the Federal Reserve face its own version of Scylla and Charybdis? We are all thinking about what happens when QE goes away, at least for a while.

Scylla and Charybdis – The Federal Reserve and the FDIC

By David Kotok

The Strait of Messina separates the eastern coast of Sicily from the southern tip, or “boot,” of Italy. This passage, three kilometers wide at its narrowest, is known for its strong tidal currents. Here is where Greek mythology recounted the tales of Scylla and Charybdis. These two monsters were believed to reside in the Strait of Messina, threatening ships and their crews as they transited through the strait from the Ionian Sea in the Mediterranean to the Tyrrhenian Sea, which lies off the western coast of Italy.

The Greeks described Charybdis as a monster who manifested herself as a whirlpool, gulping and spitting out huge amounts of water several times a day, creating the treacherous currents. Scylla was a six-headed and twelve-armed monster, who would consume everything that crossed her path. It was by the presence of these two monsters Greek legend explained the shipwrecks and destruction that took place in these perilous waters.

Gazing out at the Strait of Messina from the city of Taormina, I have fulfilled a lifelong dream. I remember, over half a century ago, being struck by the stories of Scylla and Charybdis in the course of studying antiquity and reading Greek mythology. A question within me: What led the Greeks to create these two mythological characters?

The answer was clarified by our tour guide. He described how the tidal rise and fall of the Ionian Sea level was substantial. He then explained that the Greeks were completely unaware of how the tides were created. They did not conceive of the power of the moon to pull on water gravitationally. Because they lacked this knowledge, they created mythological explanations for the geographical phenomenon they witnessed.

At peak velocity, the currents flow in the Strait of Messina at nine knots. This is a fierce current with which to contend, especially in such a narrow body of water. Such a force would easily overwhelm sailing vessels of the types used in ancient times.

It is now understandable how Greek legend brought forth the myths of Scylla and Charybdis. What else could possibly explain the deadly surges ships and their crews had to fight against? Had the sailors known about the tides, would they have operated differently? Would they have timed the tides? How much of history would have changed if the epistemological questions were answered, not with mythological characters but with facts and experience?

In addition to touring in Sicily, the GIC meetings in Italy afforded conversations with economists, financial advisors, investors, and colleagues. They lead me to a difficult and intricate question. Does the Federal Reserve face its own version of Scylla and Charybdis?

The Fed is completing its program of asset purchases, called by many “QE2.” As this program reaches its completion this summer, many participants expect the Fed to call it quits on additional purchases. The current market expectation is that the Fed will then go into a mode of preserving the then-existing size of its balance sheet. As maturities occur or paydowns take place in the mortgage-related portfolio, the Fed will replace those maturities and paydowns with purchases of treasuries. Essentially, the Fed will go into a holding pattern and await “incoming data.”

Meanwhile, the Federal Deposit Insurance Corporation (FDIC) has just introduced a new factor. We have written about it in the past. Since April 1, the FDIC now costs a bank an additional between and ten and forty-five basis points as a fee on its assets. That is a payment the bank must make – any American bank – to the FDIC.

In making monetary policy decisions, the Fed did not have to contend with this cost prior to April 1. Now the FDIC has interfered in a way that adds a cost to the banking system at the very time the Fed is engaged in easing. The mechanics of the FDIC fee act as a form of a tightening. We estimate that the impact is the nearly the same as if the Fed were to have raised interest rates about 15 basis points. By some “guess”timates, the FDIC has taken back all the easing provided by all of QE2.

In the last day or two, we have seen the Federal Funds rate trade under ten basis points. Nine basis points is the price of a transaction between two banks, in which one takes excess or additional reserves and sells it to the other. It is also the price at which the government-sponsored enterprises (GSEs), Fannie Mae and Freddie Mac, take their incoming cash flows and sell them to the banking system. GSEs are not permitted to deposit monies with the Federal Reserve, so they have no choice but to sell into the Federal Funds market and get whatever they can, or otherwise earn nothing. Clearly, the selling pressure from the GSEs is driving the Federal Funds rate down. At the same time, the FDIC fee means that it is costing more for banks that would buy the Fed Funds, so we have a double-edged sword at work. Is this interfering with the Fed’s monetary policy intentions? Is it setting the Fed or the markets up for a shock when the policy changes?

Epistemological questions may be answered with facts, examination, research, and experience. However, the United States has never engaged in monetary policies of the type presently underway. We have no experience to guide us. Has that led us to the error of the Greeks?

The alternative to relying on legend would be to see if anything can illuminate our present circumstances. Then we can build models for guidance. Our assertions may be right or wrong. That remains to be seen, but what we do now know is that we have a construction in which the Federal Reserve pays banks 25 basis points for its excess reserves, which are deposited at the Fed.

At the same time, the pricing of overnight reserves traded between banks is now down to nine basis points and has been falling erratically. Simultaneously, there is a fee structure that costs banks 10 to 45 basis points, depending on the size and characteristics of the bank, and therefore that pricing is acting as a “wedge” and altering the composition of monetary policy.

Think of it in the following way: a basis point on one million dollars is one hundred dollars. As stated before, the overnight interest rate on Federal Funds is nine basis points. Nine basis points are 900 dollars per year on one million dollars of reserves traded between two banks. If you divide 900 dollars by 365 days, you can see that for a smaller bank to do an overnight, million-dollar transaction in Federal Funds is to gain that bank about two and a half dollars.
It is simply too much trouble for the bank to go through for such little result.

Add three zeros and think in terms of one billion instead of one million. You can see that for a large bank it is still not substantial, and so the intention of Federal Reserve policy making is being altered by this present combination of pricing. We are already seeing banks reorganize themselves to qualify for the lower FDIC fee schedule.

What does the pricing indicate? Does it tell us that the value of excess reserves has reached zero? There are indications that affirm this. When you look at the repo market and the pricing of the collateral used in the repo market, you have an indication of how repo is priced. It is currently near zero. One has to ask oneself why this is so. Is there such weak demand as to price the value of overnight liquidity at zero? The alternative question is: has the FDIC effect driven that overnight liquidity pricing to zero? In fact, is there so much excess liquidity that we now face the true confrontation of the “zero bound” in monetary policy?

The epistemological question is as classic as Greek mythology: how do we know, and how can we arrive at an answer? The second derivative of that question is what happens when the Fed finally changes this policy. Furthermore, is this FDIC-altered policy the policy that the Fed wants? The home-mortgage interest rate is higher than when the Fed started QE2. The housing market continues to be in doubt and prices in many regions are falling. The economy got an initial burst after the financial crash of Lehman and AIG, but subsequently, economic growth rates are falling. We see revisions of growth rates ratcheting downward. The policy has clearly weakened the US dollar, as allocations of dollars are going elsewhere. What is not clear is whether that reallocation is taking place because of choices made by holders of dollars, like state sovereign oil funds, or being made by investors, or both.

Epistemological questions face the Federal Reserve, investors, the US economy, and the world. The true origins of tidal forces were not apparent to the Greeks as they transited the Strait of Messina. They thought they understood; they held strongly to their belief system. The Greeks described their theories through mythological figures, and even deified them. 2500 years later, we understand how some epistemology failings misled the Greeks. As for the US and its policy at the Federal Reserve, we are operating on legend and uncertainty.

As investors, we confront the likelihood that the short-term interest rate will remain near zero for the rest of this year. The gulping and spitting of excess reserves is coming from the modern Charybdis. The FDIC fee is the modern-day Scylla.

Investors will face the “zero bound” in interest rates for a while longer. They can sit on their cash and earn nothing. They can fret and wring their hands about a ramp-up in inflation, but the evidence so far does not support it. They can stay in the US dollar, in which case they can watch their dollars weaken relative to the rest of the world. Travelling in Sicily or Rome validates how strong the euro is relative to the dollar. All you have to do is buy a dinner or hotel room.

We are back in our office. It has been an enlightening trip. We have been able to examine some history while discussing monetary policy and financial affairs. This writer, finally, and after nearly 60 years, was able to witness Scylla, Charybdis, and the Strait of Messina.

Lastly, we return during the Christian Holy Week and during the Jewish Passover festival. We celebrate faith and freedom. We do not actually burn a sacrificial animal. We invoke it as a symbol of the past.

This year we do so after being reminded that those ruins of temples and amphitheaters, those paths and stone quarries, are evidence of slavery. The Trojan, Carthaginian, Greek, Roman, Arab, Norman, Spanish, and other conquerors of Sicily all used slaves.

To a human being, legend and deification can be a dangerous thing. Freedom is as fragile as a weakened monetary and political system will make it. Modern mythology resides in the temples in Washington, not in the Messina.

La Jolla, Toronto, and Cleveland
Dice Have No Memory

This Thursday I head for La Jolla to be with my partners at Altegris Investments for our 8th annual Strategic Investment Conference. So many old and new friends will be there, as it is again sold out. It is something I really look forward to. Then Sunday I fly to Toronto, where I will be with host Adam Felesky of Horizon Exchange Traded Funds and speak at noon on Monday. I will be in Cleveland on Wednesday, speaking in Elyria in the evening.

Let me commend to you a new book by my great friend Bill Bonner, of Daily Reckoning fame. It is called Dice Have No Memory. It is a collection of the best of his essays. I once said that when I read Bill I feel like a house painter standing before a Rembrandt. He is one of the really great writers I know, and can tell a tale with a point like few other writers. He is just so gifted. You can read him in short pleasurable bursts in the evening, or of an afternoon with a nice glass of wine. www.amazon.com/dice (http://www.amazon.com/Dice-Have-No-Memory-Economics/dp/0470640049/ref=ntt_at_ep_dpi_1/187-9612289-7401766)
And finally, a fun close. I got a note from old friend James Altucher. It seems he had 105,000 unopened emails in his gmail account. For some reason he went to the oldest and it was my forecast for 2005. “Looks like you were right,” he noted. Quoting from his blog:

“Here’s the critical piece of the email:

“‘When the next recession comes in 2007, the stock market will drop. Average drops during a recession are 43%. The Baby Boomer generation will realize that the stock market is not going to bail out their retirement hopes.’

“Dear John, why didn’t I read that email? It would’ve saved me some grief (assuming I would’ve then paid attention to it). Should I read your latest book that came out? Or will I wake up in the middle of the night screaming?”

I had forgotten that little piece of lucky prognostication. I may have to go back and read to figure out why I came to that conclusion. Maybe it could help me out of my own current state of confusion. (Altucher’s whole rather funny piece is at http://www.jamesaltucher.com/2011/04/105633-unread-emails/. And where did he find that picture of me with Tiffani and Peter and Barbara Bernstein? Wow. An old friend sorely missed.)

See the original article >>

Number of the Week: Americans Buy More Stuff They Don’t Need

By Mark Whitehouse

$1.2 trillion: How much Americans spend annually on goods and services they don’t absolutely need.

This Easter weekend, Americans will spend a lot of money on items such as marshmallow peeps, plush bunnies and fake hay, begging a question: How much does the U.S. economy depend on purchases of goods and services people don’t absolutely need?

As it turns out, quite a lot. A non-scientific study of Commerce Department data suggests that in February, U.S. consumers spent an annualized $1.2 trillion on non-essential stuff including pleasure boats, jewelry, booze, gambling and candy. That’s 11.2% of total consumer spending, up from 9.3% a decade earlier and only 4% in 1959, adjusted for inflation. In February, spending on non-essential stuff was up an inflation-adjusted 3.3% from a year earlier, compared to 2.4% for essential stuff such as food, housing and medicine.

To be sure, different people can have different ideas of what should be considered essential. Still, the estimate is probably low. It doesn’t, for example, account for the added cost of certain luxury items such as superfast cars and big houses.

Interestingly, people who spend more on luxuries have experienced less inflation. As of February, the weighted average price of non-essential goods and services was up only 0.2% from a year earlier and 82% from January 1959, according to the Commerce Department. By contrast, the cost of all consumer goods was up 1.6% from a year earlier and 520% from January 1959.

The sheer volume of non-essential spending offers fodder for various conclusions. For one, it could be seen as evidence of the triumph of modern capitalism in raising living standards. We enjoy so much leisure and consume so much extra stuff that even a deep depression wouldn’t – in aggregate — cut into the basics.

Alternately, it could be read as a sign that U.S. economic growth relies too heavily on stimulating demand for stuff people don’t really need, to the detriment of public goods such as health and education. By that logic, a consumption tax – like the value-added taxes common throughout Europe—could go a long way toward restoring balance.

VISUALIZING THE GOLD-SILVER RELATIONSHIP

By Tom McClellan
Scatterplot of gold prices versus silver prices
April 22, 2011

The financial media have been getting really excited about gold and silver lately. Gold has seen postings above $1500 for the first time, and silver is closing in on the $50 mark last seen when the Hunt brothers tried to corner the silver market in 1980.

Silver is a lot more volatile on a daily basis than gold is. Silver seems to attract the hottest of the hot money, and moves around a lot more as a result of that speculative intensity.

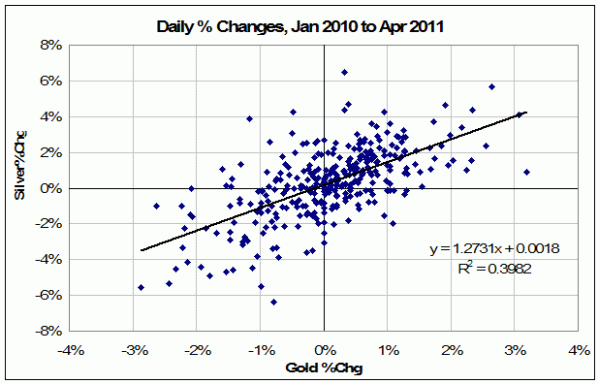
This week’s chart shows a comparison of the daily percent changes in gold and silver prices each day since the beginning of 2010. It is helpful in terms of visualizing the relationship between these two metals. Each dot represents one day’s value for the percent change in cash gold and cash silver. If we instead looked at gold and silver futures, it would look slightly different due to the inherent inefficiency in the gold and silver “fix” reporting. And if we had a different period in history under examination, that too would make it look different.

One point which jumps out is that even though there is a great deal of variability, there is an obvious linear relationship that is highlighted by the linear regression line drawn on the chart. For Excel users, it is easy to create a linear regression line like this one. Just create the chart, then select CHART-ADD_TRENDLINE, and choose “Linear” for the regression type. You can also select the options to add the regression line equation and R-squared value for display on the chart.

A couple of points are worth noting about this regression line. The first is that a 1% move in gold produces, on average, a greater than 1% move in silver prices. This is not a surprise; silver is more volatile than gold. So in the language of portfolio analysis, silver has a “beta” that is greater than 1.0 when compared to gold price movements. This means that silver’s daily moves upward and downward are bigger than those seen in gold. This is similar to how a tech stock might move up and down by greater amounts than the SP500 or some other benchmark, whereas a utility company stock might have quieter moves. Beta is the measure of those greater or lesser movements.

Beta shows up in the regression line equation for this set of data as the 1.2731 factor multiplying the X variable. This means that on average, if gold moves 1%, then silver will move 1.2731%.

The other number in that regression line equation is 0.0018, which represents where the regression line crosses the Y axis. In portfolio management jargon, this is “alpha”, which refers to the performance of an asset (silver) relative to the benchmark (gold) on a risk-adjusted basis. In real terms, the meaning of that 0.0018 number is that since Jan. 2010 the price of silver has outperformed gold by 0.18% per day. If we looked at another period, when metals prices were not in a protracted uptrend, the figure for alpha would likely be different, but the beta figure should be similar since silver prices tend to magnify the movements in gold prices.

It should be understood that the normal use of alpha is in terms of grading a portfolio manager’s performance relative to a benchmark like the SP500, after factoring out the market risk. But the same math can be applied to the relationship of silver prices versus the benchmark of gold prices. And doing this regression analysis helps us see more precisely why silver’s price movements seem to be bigger than gold’s on a daily basis.

Related Charts
Oct 14, 2010 Enable Images to see this Chart
Gold Prices Lead The Way For Commodities
Aug 06, 2010 Enable Images to see this Chart
Correlations May Not Be What They Seem
Dec 04, 2009 Enable Images to see this Chart
How Gold Forms Tops

TIME – THE GREAT REVELATOR

By Erik Swarts

Quite serendipitously, I found myself at the ripe age of 21 riding a significantly underpowered motorcycle through the frontier states of the American and Canadian west. I had recently just graduated from college and was embarking on the traditional rite of passage so many restless young graduates make:

Where to now?

My friends drove, in what ironically we referred to at the time as, The Silver Bullet – a 1990 silver Ford Taurus station wagon my friends folks “donated” to the expedition’s cause. I rode my motorcycle – a 1986 Honda Nighthawk that was just barely capable of carrying my large frame some 16,000 miles around the highest elevations of the country. I had a tent, a sleeping bag, my hiking pack and a guitar all strapped to the bike. I also had a softcover copy of Zen and the Art of Motorcycle Maintenance tucked into my saddle bags. I was ready and willing to receive all the wisdom the road and Mr. Pirsig could throw my way.
“The main skill is to keep from getting lost. Since the roads are used only by local people who know them by sight nobody complains if the junctions aren’t posted. And often they aren’t. When they are it’s usually a small sign hiding unobtrusively in the weeds and that’s all. County-road-sign makers seldom tell you twice. If you miss that sign in the weeds that’s your problem, not theirs. Moreover, you discover that the highway maps are often inaccurate about county roads. And from time to time you find your “county road” takes you onto a two-rutter and then a single rutter and then into a pasture and stops, or else it takes you into some farmer’s backyard.
So we navigate mostly by dead reckoning, and deduction from what clues we find. I keep a compass in one pocket for overcast days when the sun doesn’t show directions and have the map mounted in a special carrier on top of the gas tank where I can keep track of miles from the last junction and know what to look for. With those tools and a lack of pressure to “get somewhere” it works out fine and we just about have America all to ourselves.”
I remember with great fondness passages such as these as I was lying under the billion star dome, reading by flashlight and following to some extent my own philosophical and literal journey through the Big Sky landscapes that make up the American west. Most people use AAA as their trusted travel guide and map provider. Luckily, I had Robert Pirsig’s penultimate novel on both motorcycle maintenance and the philosophy of quality as my reference manual.
“You see things vacationing on a motorcycle in a way that is completely different from any other. In a car you’re always in a compartment, and because you’re used to it you don’t realize that through that car window everything you see is just more TV. You’re a passive observer and it is all moving by you boringly in a frame.
On a cycle the frame is gone. You’re completely in contact with it all. You’re in the scene, not just watching it anymore, and the sense of presence is overwhelming. That concrete whizzing by five inches below your foot is the real thing, the same stuff you walk on, it’s right there, so blurred you can’t focus on it, yet you can put your foot down and touch it anytime, and the whole thing, the whole experience, is never removed from immediate consciousness.”
Perspective is everything.

You sniff around today and the vast majority of investors, traders, S&P analysts, Republican’s and Democrat’s alike, all see the US through the very pessimistic lens of a diminishing Republic on the cusp of insolvency. Some even go further out on the continuum of curmudgeondry – I suppose at this point in the cycle, fear pays better than logic (media speaking). However, if you want real alpha (the preferable meta-alternative to seeking alpha) go against the conventional wisdom here and realize that the US is not insolvent today and arguably headed towards confronting some of the greater fiscal issues that have haunted us for far too long. The general public’s perspective is always in the rear view mirror of the market. It is why I follow the market and steer clear of the 24 hour, 12 hour, 4 hour news cycle. I am far too impatient to read about yesterday’s news described as if held relevance to today, moreover – tomorrow.
“The United States will always do the right thing—when all other possibilities have been exhausted.” -Winston Churchill
The market knows this. The US dollar knows this. The media will eventually catch up with its tail.
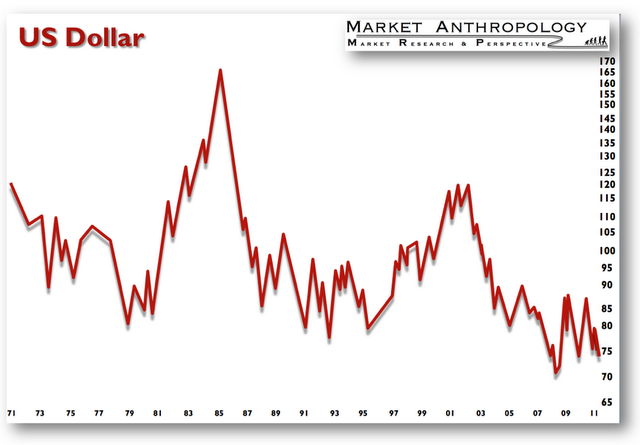
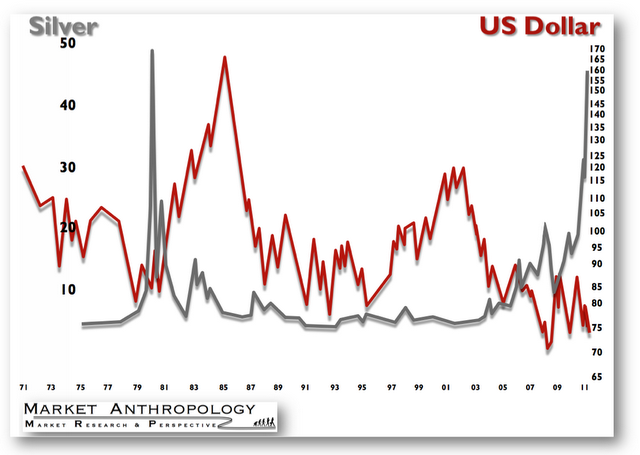
For all the dollar bears that are waiting on pins and needles for the bottom to fall out or for America to enter into a hyper-inflationary tailspin, just turn their attention to the historic chart of the American currency, post the Nixon Shock in 71′.
Where’s the doom and gloom?
 
I see a rather normalized trending currency, reflecting moderate fiat debasement, within a technical framework remarkably similar to late 1980 early 1981.

And low and behold, silver was also very much acting the technical part as it did in 1980.
In 1980, it was the Hunt Brothers cornering the silver market. Today, it’s more or less the sentiment of irrationality that is expressed on places like Zero Hedge and through maverick traders like Eric Sprott.
This is why I have entered a position that is long the US dollar and short silver. It’s not a daytrade, it’s a thesis position (I can just feel traders cringe). Similar to John Paulson’s trade on housing or Buffet’s bet on the dollar – with the caveat that I am expecting a resolution in the market within the short to intermediate time frames. I can only use the previous price history and technical analysis as a reference guide for entering the trade. Realistically speaking, there is a very low probability of picking the absolute top in the silver market. For this reason, I am willing to trade the positions intrinsic value for time.

Time is the great revelator.

I approach a position in ZSL as an option trade on the silver market, without the serious risk of time decay you are exposed to with conventional options. I do realize that even these trading vehicles have their own inherent component of time decay. However, over the time frames I have described – it is the best fit.
For further rationale as to why I have chosen this position, see:

The Fed Must End QE2 on April 27th

By Dian L. Chu

The Federal Reserve has lost all credibility on Wall Street, and most of the American public with the absolute refusal to recognize the dire effects on asset prices that QE2 has created. But the refusal is part of the problem. It reinforces the wide spread belief of investors that the Fed is out of touch with reality, and that they sit in their Ivory Tower implementing an exceedingly loose monetary policy, with the stated goal of inflating asset prices.

The Fed has refused to even acknowledge the possibility (rather than the indisputable facts) that not only have they inflated selected asset prices like S&P 500, the Dow indexes, but they also have inflated asset prices like food, energy, and clothing which would actually hurt the economy and consumers (See Chart).


Needed – Housing and Wage Inflation

Remember, overall inflation is actually being artificially under-reported by the numbers because housing and wages are not inflating. These are the two actual groups of assets that Americans in reality need the Fed to inflate. But Fed’s policies have been unable to help and seem to essentially be hurting the housing sector, as higher everyday living costs with stagnant wages tend to reduce disposable income and resources that could be otherwise allocated to saving towards a down payment to purchase a house, improving the real estate sector of the economy.

Inflation Exported Would Come Back To Haunt

Furthermore, since most of these asset prices are priced in dollar, the fed has exported dire and extreme inflationary pressures on an already precariously balanced inflationary picture in the emerging market economies from China to India.

It is the proverbial throwing of jet fuel on a barbeque for most of the economies. Yes, Bernanke is right that these countries had inflationary problems before based upon their undervaluing currencies. Nevertheless, this is how their economies have been set up in the global trade role that has been 30 years in the making.

These countries just couldn`t revalue their currencies near enough to still keep their role as exporting, cheap labor manufacturers, without sending the entire region into a 10-year depression which would bring the entire world into a depression not seen since the Great Depression.

Unmanageable Inflation Elsewhere

Given the fact that these manufacturing exporting countries cannot meaningfully revalue their currencies, they are basically stuck with an endemic higher level of inflation compared with the developed economies, but it is still manageable. Now, with the US`s persistently loose monetary policies exacerbated by QE2, raising input costs for commodities used in abundance by these manufacturing, cheap labor economies like Oil, Copper, Cotton, and Iron Ore (See Chart), these policies are exporting additional inflationary pressures to these developing economies.


This results in making what would be a manageable level of inflation in China of around 3.5 to 4% an unmanageable level of inflation at 5.5 to 6%, and maybe even higher as the full effects of the inflation of commodity asset prices have not yet fully been incorporated and manifested in the Chinese manufacturing economy.

Long Live the Inflation Trade

The other area where Ben Bernanke`s stubbornness of acknowledging the effects of QE2 on food and energy prices, i.e., the rise in prices is due strictly to demand reasons, Middle East tensions, and product shortages and in no part to a loose monetary policy which encourages traders to make the following trade:
  1. Loose monetary policy is dollar negative (printing money, currency devaluation, etc).
  2. Commodities like Oil, Gold, Silver, Wheat, Corn, Cotton, Copper are Dollar negative Hedges
  3. Therefore, put on the following trade: Short the dollar, and go long commodities.
This is the famous inflation trade is has been going on and off for the past 10 years by fund managers around the world. This trade has been in the investing 101 handbook for 50 plus years. And the fact that Ben Bernanke never admits to knowing about these trade dynamics in the marketplace, and how his policy initiate of QE2 actually encourages, facilitates and even mandates that fund managers around the world put on this very trade is beyond a rational explanation.

Inflationary Effects Are Transitory?

In addition, it is even more incredulous of Bernanke and his failure to acknowledge any role whatsoever for the feds function in these higher commodity prices when their stated goal is to in fact inflate asset prices. Whenever he is interviewed about this very question he always uses the standard response that inflationary pressures are not due to the recent Fed policy of QE2.

I guess these are assets that the Federal Reserve has expressly forbidden traders to inflate. However, Bernanke also adds that these inflationary effects are transitory in nature--he has been saying “transitory” for over 6 months now. How long does it take for ‘transitory” to become “stuck in the economy, and cannot get rid of without a massive rate hike sledgehammer”?

Fed Out of Touch with Reality

It is starting to sound like a broken record, and it is completely divorced from the facts in the marketplace, or the facts on the ground for those not in the Ivory Tower. It is this main street denial that has reinforced the notion that Bernanke and his dovish colleagues with their incessant soft selling of inflation in their comments regarding inflation questions every week that they are out of touch with reality.

This “fed out of touch with reality” notion only goes to reinforce the very “Inflation /Currency Devaluation Trade” causing traders to pile even more capital into shorting the US Dollar and going long Commodities because it is only going to get worse down the line. This is what is referred to as inflation expectations.

Dovish Fed Undermines The Dollar

The fed policies regarding QE2 are not near as damaging for the US Dollar as traders perceptions of the Fed policy of QE2, and judging by the rise in Silver alone will tell you, traders perceptions of QE2 is extremely negative. And that old adage perception is reality takes hold and traders do far more damage to the US Dollar than any actual currency devaluation due to QE2 by going heavily short the currency. Traders and their perceptions right now are what is really hurting the US Dollar and Bernanke has failed to realize this fact.

Another interesting question for Bernanke and his Dovish colleagues, and it appears that even the more hawkish members of the Fed are still to dovish in their market comments regarding inflation. Probably because they all are in the upper income bracket on a percentage basis compared with the average US consumer, and are largely immune to the ridiculous six month rise in food and energy prices felt by the average American citizen.

The Fed can change all that on the 27th of April with either a cutting short of QE2, or an equally hawkish wording of the fed statement with a nod towards tightening sooner than previously indicated in past policy statement wording.

Everyone Worries Except the Fed

The Fed might ask themselves the following question:
  • How come at every Speech where there is a question and answer session that you are asked about inflation?
  • Or how come every reporter when interviewing a fed member asks them about their role in causing inflation around the world and how this is contributing to political and social instability in emerging economies?
  • Is this just by coincidence, all these reporters and questions revolving around inflation effects? The answer is that these questions are being asked for a reason, and that alone is a problem for the fed.
Another question for Bernanke is how come every other country is worried about inflation, including developed economy neighbor Europe, while the US doesn`t have an inflation problem? It seems the US is the only country in the entire world where inflation isn`t a problem? Does this seem logical? And if it is in fact the case, how long do you think it will stay this way, where the entire globe is experiencing inflation pressures but the US has a “transitory” inflation problem?

When Transitory Turns Self-Fulfilling

The problem for the Fed is that this goes beyond current inflationary effects in the economy, but future expectations of inflation in the economy. And none of these are transitory in nature once they get embedded in the psyche of investors and consumers. The only way they were doused in 2008 when they were at these exact levels was a near historic crash in the financial and housing markets.

Absent of some similarly extreme deflationary event, inflation and expectations of inflation are only going to feed on themselves and become even more firmly entrenched in the economy, negatively reinforcing investors and consumer’s asset allocation and spending habits.

This all becomes self fulfilling in nature, and the real nasty part about inflation is if you don`t head it off early, once it gets even a little momentum, it becomes much more difficult to control and manage. This is where the fed is right now; they are at the cusp of losing control of their handle on inflation with their incredibly dovish stance towards inflation.

End the Denial or Lose on Inflation

Bernanke and the current Federal Reserve Board have a credibility problem both with Wall Street traders and the American population. The sooner Ben Bernanke acknowledges his role in causing inflation, the better off we will be in fighting the battle of inflation. The longer the denial routine of “transitory’ responses continues, the increased chance that Bernanke loses what shred of remaining credibility he has on the inflation issue.

Then, the inflation battle is essentially lost without equally devastating policy responses that are almost similarly as bad as the inflation effects, i.e., you have to send the economy into a recession with an abundance of tightening measures that completely destroys growth to get a handle on prices.

Needed - Hawkish & Cut Short of QE2

Again, the Fed and Bernanke can change all this on the 27th of April, failure to do so basically dooms Bernanke`s legacy to be remembered by the initial moniker put on him when he initially was chosen as Alan Greenspan`s successor, when he was commonly referred to as “Helicopter Ben”!

During his first six months on the job as Fed chairman, he did everything possible to dispel such a label, but he has more than made up for that period during the last six months regarding his outright refusal to acknowledge the exceedingly negative side effects revolving around out of control food and energy prices related to his QE2 Initiative.

The average American citizen cannot withstand another two months of “Asset Inflating” on behalf of the Fed, enough is enough, time to cut the QE2 policy initiative short.

Follow Us