
By: P_Radomski_CFA
Gold cannot be printed or manufactured in contrast to the currency. That’s why over the long term it has kept its value as the ultimate currency. There can be no “gold war.” However, we often hear about a currency war. Sounds familiar, were did we hear this before?
The phrase “currency war” was coined by Brazilian Finance Minister Guido Mantega after the financial crisis of 2008. The idea is that highly indebted nations weaken the value of their currency by cutting interest rates down to zero and printing fiat currency in order to gain trade advantages (cheaper products to export) and to pay less debt service on their bonds. Countries compete against each other to achieve a relatively low exchange rate for their own currency. The policy can trigger retaliatory action by other countries that in turn can lead to a general decline in international trade, harming all countries.
Concerns over a currency war prompted the Group of Seven and Group of 20 economies recently to formulize what constitutes appropriate behavior by central banks in influencing currency-exchange rates.
Let’s look at some numbers. Global currency reserves have swelled from $1.9 trillion in the year 2000 to a whopping $11.2 trillion by the third quarter of 2012. But most of that gain took place in the past six years with global currency reserves doubling to the current levels from $5.6 trillion at the beginning of 2007. If that is not evidence of the global currency war then what is? We can see two different aspects. The first is undeniable evidence of aggressive money printing, but we already know that. The second, is an indication of determined stockpiling of the currencies of other countries in order to weaken your own currency.
For a widespread currency war to occur a large proportion of significant economies must wish to devalue their currencies at once. This has so far only happened during a global economic downturn.
Under normal economic conditions countries tend to overlook a small rise in the value of their own currency. However, during a time of recession, nations can take umbrage at other countries’ devaluations.
Let’s begin this week's technical part with the analysis of the U.S. Dollar (charts courtesy by http://stockcharts.com).
Let’s start today’s analysis of the U.S. Dollar with its long-term chart.
When we take a look at the above chart we can see that the USD Index declined once again this week. Despite that fact, the January breakout was not invalidated. As we see, the index is still above the declining support line, and thus the medium-term outlook remains bullish.
Let’s take a look at the medium-term situation. Has it changed since last week?
In this perspective we can see that the USD Index moved to its medium-term support line (marked with the thin black line), which is currently close to 80.4. It is very possible that this line will pause the decline, at least for a while, and it’s quite possible that it will actually stop it.
The situation remains bullish for the USD Index in the long and medium term, so let’s check to see if the short-time outlook is the same.
During the last several days, the USD Index declined and moved slightly below the short-term support line. There is a medium-term support line visible on the previous chart that is much more important so the above is actually not a big deal.
The most important factor on the above chart supporting the bullish case is the cyclical turning point which is very close – about a week away. It is possible that we will see its impact on the dollar next week and this can lead to a bigger pullback or – more likely – the end of the current decline. If we move back in time a bit, we will see similar situation in August and September 2012 when the cyclical turning point worked very well after a significant decline.
Additionally, please note that the RSI Indicator is now at the 30 level, which is a classic buying opportunity.
Let's find out what impact has this decline had on the two most popular precious metals.
In this week’s very long-term gold chart, comments made in last week’s Premium Update remain up-to-date:
The outlook continues to be bearish and the trend remains down. Gold could still decline heavily based on the long-term cyclical turning point (…). In both 2008 and 2009, local tops formed slightly after the cyclical turning point, so it is possible that the reversal in the downtrend won’t be seen until after the cyclical turning point once again, leaving a number of days in which further declines could be seen.
We are still likely to see declines after the cyclical turning point from this long-term perspective. The turning point should work on a “near to” basis and declines will likely be seen sooner rather than later (and the bottom is likely weeks away, not months away).
Now let’s take a look at the white metal.
In this week’s very long-term silver chart, not much really happened as prices declined slightly, less than half of 1 percent overall. The intra-day high for the week was lower than last week once again and from this perspective, the declines clearly go on.
No confirmed move has been seen below the level of the 2008 highs, but silver’s price is only slightly above it at this time. It seems that we’ll have another sharp decline once the breakdown below this support level is seen and confirmed.
Summing up, the most important event in the currency market was further decline of the dollar. Although the decline visible on the USD Index chart has been quite heavy, we have not seen a rally in gold and silver so far this week – they moved lower. Gold’s underperformance has become even more significant this week and we think that this makes the outlook even more bearish for the short term. Although recent declines in silver have been small, the downtrend remains in place. The implications of the above-mentioned underperformance are bearish for the precious metals sector.
To make sure that you are notified once the new features are implemented, and get immediate access to our free thoughts on the market, including information not available publicly, we urge you to sign up for our free gold investment newsletter. Sign up today and you'll also get free, 7-day access to the Premium Sections on our website, including valuable tools and charts dedicated to serious Precious Metals Investors and Traders along with our 14 best gold investment practices. It's free and you may unsubscribe at any time.

The International Monetary Fund sees the Federal Reserve maintaining large monthly bond purchases until at least the end of this year and urged the central bank to carefully manage its exit plan to avoid disrupting financial markets.
Unwinding a policy of record-low interest rates and $85 billion in monthly bond-buying known as quantitative easing will be challenging even though the Fed has “a range of tools” to withdraw the stimulus, the IMF staff wrote in its annual assessment of the U.S. economy.
“Effective communication on the exit strategy and a careful calibration of its timing will be critical for reducing the risk of abrupt and sustained moves in long-term interest rates and excessive interest-rate volatility as the exit nears,” according to the concluding statement released today.
Such moves “could have adverse global implications, including a reversal of capital flows to emerging markets and higher international financial market volatility,” the staff said in the report.
Concern is already showing, with almost $3 trillion that has been erased from the value of global equities since Fed Chairman Ben S. Bernanke said May 22 the central bank could scale back stimulus efforts should the job market outlook show “sustainable improvement.”
Stocks Fall
The Standard & Poor’s 500 Index, which has risen in each of the past seven months, declined 0.3 percent to 1,631.36 at 11:59 a.m. in New York. The yield on 10-year Treasury notes was 2.11 percent compared with 2.15 percent late yesterday.
“We are seeing clearly that communication will be key in order to monitor expectations and in order to reduce uncertainty and this will certainly be seen in the weeks and months to come,” IMF Managing Director Christine Lagarde said during a press conference in Washington today.
Lagarde said the fund’s projections assume a “very slight” decline in the amount of monthly bond purchases in 2014, and no tightening. The lower growth forecasts reflect that, in contrast to April, the fund assumes that automatic budget cuts that started to come into effect this year won’t be phased out.
Bernanke will have an opportunity to retune the Fed’s message during a press conference on June 19 after the Federal Open Market Committee concludes a two-day meeting and releases a policy statement.
Lower Forecast
The Washington-based IMF left its U.S. growth forecast for this year unchanged at 1.9 percent, which assumes that budget cuts may trim as much as 1.75 percentage points off the expansion. It also lowered its prediction for 2014 to 2.7 percent, from 3 percent growth predicted in April.
Investors’ overreaction to the Fed’s initial steps to normalize its monetary policy is also a risk to the country’s growth outlook, according to the fund’s report, which said other threats include a stronger impact of fiscal tightening and a reigniting of Europe’s debt crisis.
IMF economists meet with government and central bank officials to prepare their estimates. The full report will be discussed by the IMF board next month.

©gdiakoum
The Greek government’s sudden decision to shut down the public broadcaster ERT has shocked both Greek media and public opinion. It was announced that more than 2,600 employees will be fired, compensated and be able to re-apply for employment when it will re-open with fewer employees possibly as an independent public broadcaster in the next couple of months. On the government’s announcement last Tuesday evening, ERT employees took the street to protest against the decision outside ERT’s headquarters. The journalists’ trade union, known as ESIEA, decided a media blackout over Greek public broadcaster’s shutdown until Monday. Moreover, the two major trade unions, GSEE and ADEDY, went to a 24-hour general strike on Thursday and called on workers from all sectors to show solidarity for the sacked ERT employees, describing the government’s decision as unprecedented, authoritarian and provocative.Greek media were taken by surprise from the outset given that Greek politics are not used to such radical gestures. “Shock and Awe” was a characteristic title of news.gr, a main online portal. The initial reaction of the majority of Greek media was to condemn the government’s decision, although as the initial shock was gradually digested two main attitudes seemed to prevail. On the one hand, some journalists and publicists approached this decision as provocative, authoritarian and non-democratic, while others held the opinion that PM Samaras showed determination in promoting the structural reforms agenda. However, nobody argues that the public broadcaster should remain closed. Actually, the majority of politicians and journalists agree that ERT needs to be restructured, but not through the medium followed by the government.
In the meantime, the management of the whole issue by the government has sparked a splitting and polarised debate among journalists and politicians alike. For instance, the online portal left.gr compares Greek government’s decision to dictatorship and calls for a “Greek Taksim Square movement”. In the same vein, the online version of Eleutherotypia, enet.gr, reported on Thursday that “ERT survived the Nazis and the junta but not the troika”. On the other hand, capital.gr, portrays public broadcasting in Greece as an agent of corruption and cronyism in articles such as “That’s why ERT should never be reopened” while endorsing Greek PM Samaras for his political will to shut down an ill-designed, biased and corrupted broadcaster.
Turning to political implications, many fear that this highly risky decision could operate as a catalyst for the collapse of Greece’s fragile coalition government leading to new elections. “Either a solution in a week or elections” was the front page title of conservative newspaper Kathimerini. The coalition partners, Socialist PASOK and Democratic Left (DIMAR), demand ERT be switched back on immediately but they‘d prefer to avoid elections. “The country does not need elections, it would be a colossal mistake, but PASOK is not afraid of them”, PASOK leader E. Venizelos stated. “We support a radical restructuring of ERT, but not with blacked-out screens”, he said. On the other, Samaras appeared unwilling to back down. He described the country as a “real Jurassic Park” for the state of anomie and lack of regulation that characterises the public sector and appeared “determined to transform Greece into a modern economy”. Initially, he made it clear to his partners that “if they do not support the decision, we go to elections”, but later he tried to defuse the political crisis by calling for consultations next Monday. Both PM Samaras and Finance Minister Stournaras said they wanted “to restructure, not close ERT”. By all probability, Monday’s negotiations between the partners are going to be a ‘take or break’ moment for the future of the coalition government.
The number one question that is one everybody’s lips is what the main reasons were behind this risky decision. As it seems, there are three main factors that can explain Samaras’ surprise move:
First, there is external pressure to Greece from its creditors, known as Troika, to fire civil servants. According to the latest rescue programme, Greece has to fire 2,000 civil servants by the end of the year and 15,000 by the end of 2014. It seems that Samaras decided to start with the public broadcaster because dismantling what has been described by the majority of Greeks as one of the most corrupted public corporations and a vehicle of patronage jobs for political parties, would cause a creative shock and paralyse any opposition. However, events are not treating him kindly at the moment although it is too soon to tell.
Second, conservative Greek party (ND) wishes to appear as carrying forward a new reformist agenda based on determination for much-needed changes, law and order. Drawing upon Thatcherism, Samaras has selected to follow the path of direct public confrontation with Unions.
Third, Samaras believes that his decision to show determination will allow him to gain political capital in building up an advocacy coalition in favor of the reform agenda. According to this argument, without a clear-cut cleavage from the ‘anti-reform block’ he could not secure a strong public support for his reform policies.
Whether Samaras’ strategy will pay off or not, it is difficult to predict developments apart from that nobody seems to want elections. According to opinion polls PASOK and Democratic Left would struggle to keep their seats in Parliament if elections were held now. New Democracy has slightly widened its lead over leftist party Syriza, but it would be difficult, if not impossible, to secure the majority needed to form an one-party government. Even Syriza, despite impressions to the contrary, does not want elections. Alexis Tsipras is roaring for them, but in reality he would like to avoid them as Syriza is at the moment going through transformation from a loose coalition into a unified political party and is about to hold a conference on that. According to the latest news, Samaras is open to discuss with his partners (PASOK and DIMAR) and to make some concessions. However, until this moment he has shown no signs of backing down from closing the public broadcaster and re-launching it as a smaller, independent and more efficient agency. Many would judge him on his ability to do the latter by his determination to go through with the former.
by Lance Roberts
I have been writing extensively about the data behind the headline media reports and discussing the importance of the underlying data trends relative to the broader macroeconomic perspectives. However, it is sometimes helpful just to view the various economic indicators and draw your own conclusions outside of someone else's opinion.
With the economy now 48 months into an expansion, which is long by historical standards, the question for you to answer by looking at the charts below is:
"Are we closer to an economic recession or a continued expansion?"
How you answer that question should have a significant impact on your investment outlook as financial markets tend to lose roughly 30% on average during recessionary periods. However, with margin debt at record levels, earnings deteriorating and junk bond yields near all-time lows, this is hardly a normal market environment within which we are currently invested.
Therefore, I present a series of charts which view the overall economy from the same perspective utilizing an annualized rate of change. In some cases, where the data is extremely volatile, I have used a 3-month average to expose the underlying data trend. Any other special data adjustments are noted below.
If you have any questions or comments you can email me or send me tweet: @streettalklive


(Note: The Economic Composite is a weighted index of multiple economic survey and indicators - read more about this indicator)

If you are expecting economic recovery and a continuation of the bull market then economic data must begin to improve markedly in the months ahead. If not, the drag of economic growth will ultimately continue to erode corporate earnings, profitability and weigh on the financial markets.
For the Federal Reserve these charts do make it clear that despite continued monetary interventions are not healing the economy but simply keeping it afloat by dragging forward future consumption. The problem is that it leaves a void in the future that must be filled.
In my opinion the economy is far to weak to stand on its own two feet. Therefore, while the Fed may ease off on the current rate of bond purchases, likely not before September, it is highly unlikely that they will remove their "highly accommodative stance" anytime soon.
by Bill Luby
Since Tuesday’s The Currency Carry Trade, DBV and Risk clearly resonated with quite a few investors who are struggling to put their arms around what is going on in Japan and what the implications are for U.S. equities and other asset classes, I thought I would follow up today by focusing attention on an important ETP that can be used as an indicator or for speculation and hedging: the WisdomTree Japan Hedged Equity Fund (DXJ).
As the name suggests, DXJ is designed to be long Japanese equities, with no exposure to fluctuations in the Japanese yen, due to hedging of the currency. As WisdomTree puts it:
“The Fund employs an investment approach designed to track the performance of the WisdomTree Japan Hedged Equity Index. The Index and the Fund are designed to provide exposure to equity securities in Japan, while at the same time hedging exposure to fluctuations between the value of the U.S. dollar and the Japanese yen. The Index and the Fund seek to track the performance of equity securities in Japan that is attributable solely to stock prices without the effect of currency fluctuations.”
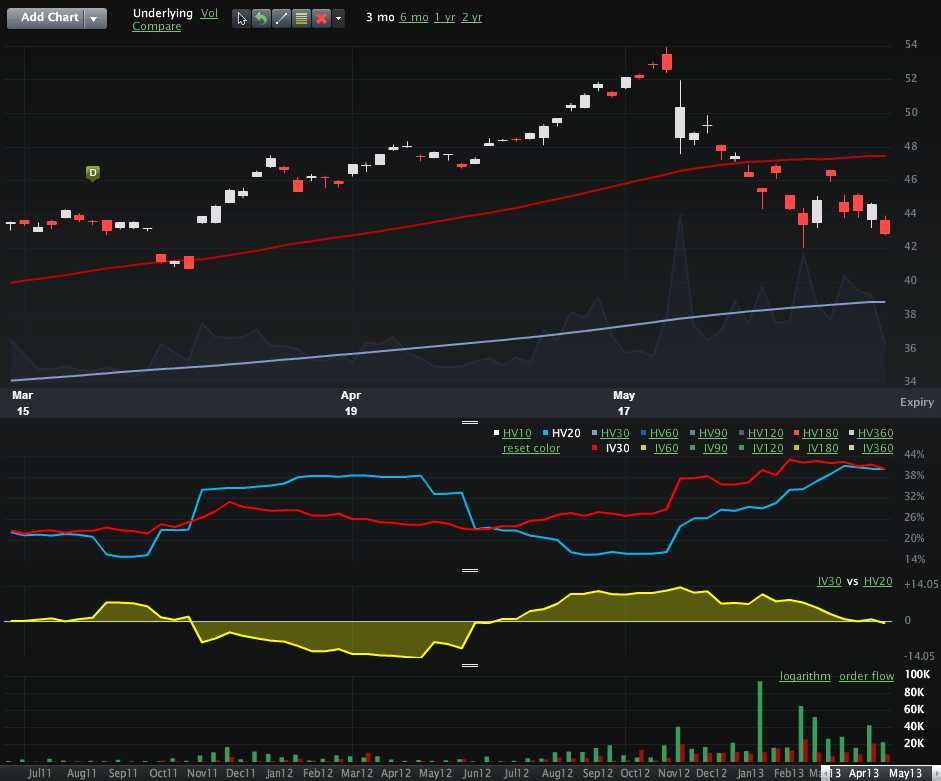
While DXJ was launched back on June 16, 2006, it was not until January 15, 2013 that options began trading on this product. The introduction of options is particularly notable in that while DXJ’s price provides an aggregated view of Japanese equities net of currency fluctuations, one can also use the implied volatility data from the options prices to determine how market participants see the risk and uncertainty in currency-hedged Japanese equities going forward. The chart below shows a three-month view of DXJ, with 30-day implied volatility (red line) remaining above 20-day historical volatility (blue line) for the past five weeks, though these numbers have converged this week. Not surprisingly, options volume has picked up substantially in DXJ as of late and there has been a bullish bias (calls = green, puts = red) in that volume. What I find even more interesting, however, is that implied volatility in DXJ appears to have peaked on June 5th.
With USD/JSP breaking below 94 earlier today, clearly there is a great deal of volatility in the yen that is being hedged away by DXJ. If one were to be interested in buying Japanese equities on the dip and also wish to eliminate the currency exposure found in the likes of EWJ, then DXJ is an alternative worth considering.
On the other hand, if one is interested in monitoring Japanese equities and currency movements in one issue and/or tracking the market’s assessment of risk and uncertainty (via implied volatility), DXJ could certainly be a useful tool for those purposes as well.
[source(s): LivevolPro.com]
By tothetick
‘It ain’t over till the fat lady sings’. No, I'm not referring to Mrs. Lagarde and no, I don’t want a law suit on my hands. I’m just saying. The expression is commonly used to infer that people shouldn’t be presuming the final outcome of a situation, until we all get there. It’s not because we are nearing the end of quantitative easing and Mr. Bernanke is probably preparing to take flight, as the heavens open and it doesn’t just rain, but it pours on all of us that we should be saying it’s all done and dusted. The International Monetary Fund made an announcement today that they strongly urged the USA not to backtrack too quickly on quantitative easing that has been set up. It also went on to state that repealing budget cuts (sequestration, which is across the board in the USA due to the inability to come to a decision in Congress) as it would be nothing other than damaging to the US economy. The budget cuts known as sequestration began on March 1st 2013 in line with austerity fiscal policies of the USA., bringing about $1.2 trillion in debt reduction (through cuts up to $995 billion and reduction of $228 billion in interest savings).
The International Monetary Fund analysts believe that if budgetary cuts are taken away, then it could trim a substantial slice off economic growth in the US. Forecasts could be lower by as much as 1.75%, meaning that growth prospects would be no better than 1.9% in total for this year. That would drag the US economy down or at least keep it from making good gains that might have shown through in recent weeks with unemployment figures falling. Previously in April, the IMF had estimated economic growth for next year to be at the 3%-mark, but they have also revised that, dropping their estimate to 2.7% for the moment.
The IMF reported that "The deficit reduction in 2013 has been excessively rapid and ill-designed". ‘Hear! Hear!’ some might well retort. Cuts will be made in education and infrastructure spending notably and it’s those areas that might lead to better recovery of the economy in the long-term. Payroll tax cuts that will come to an end will also have a knock-on effect on the economy in adverse terms.
The silver-lining is that the IMF believes that US debt will reach 110% of GDP. It will then be at the peak and will decline after 2015. It’s presently at 101.6% (2012) of GDP. So, we still have more to spend? Or rather we still have more to spend of what we don’t have.
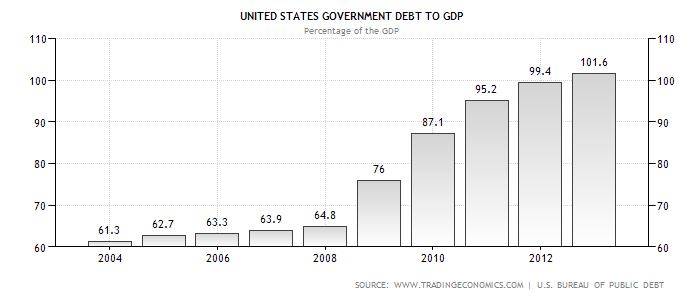
US Debt as Percentage of GDP
The other good piece of news is that the IMF urged the Federal Reserve to maintain quantitative easing until at least the end of 2013. That might put investors in a more peaceful state of mind. But, for how long. The end has got to come sometime. But, just not now, maybe, while the economy is still not doing well enough. Delaying it will only perhaps make the market even more difficult when it comes to weaning it off the cash-pile being thrown at them. The way markets have reacted by off-loading bonds and the volatility of the reactions that have taken place over the past few days, means that crossing that bridge will have to be way before the Federal Reserve actually gets to it.
Whatever happens, it looks like the fat lady has indeed sung. But, it’s not over yet. What was it that someone else said? It ain’t over till it’s over. But, then it’ll probably be far too late. So, this time, it’s probably a good thing that we had to sit through the warbling of Ms. Lagarde at the International Monetary Fund. Now, the question is, will the US federal government and Mr. Bernanke take head from the soprano singer over withdrawing both QE4 and budget cuts? Is that the sound of glass breaking?
by Charles Hugh Smith
There is no way the pensions and benefits promised in an era of financialized abundance can be paid once the wheels of financialization fall off.
Yesterday I described the destructive effect of abundance on decision-making: An Abundance of Bad Decisions. One aspect of this dynamic is the tendency to extrapolate prosperity into the future as a permanent state of affairs.
One example of this is state/local government pensions: during the past 30 years of financialized abundance, the benefits and pensions promised to public employees were increased substantially. Public unions are a powerful political force in many states, and in eras of rising tax revenues, it's an easy political decision to increase public employee benefits and pension payouts.
The rising stock and bond markets generated huge profits for the public-employee pension funds, enabling them to grow without taxpayer contributions. The effortlessness and persistence of this growth encouraged the mindset that pensions would be paid for via the magic of ever-rising markets; if tax revenues weren't even needed to fund the pension plans, then no hard political choices would ever have to be made.
Alas, the 8+% annual growth rate of the boom era is now structurally unrealistic.The New Normal is bond yields of 2% or 3% at best, and equities markets that are increasingly at risk of significant sell-offs.
The illusion that the pension funds can pay the promised benefits is maintained by plugging wildly unrealistic 7% or 8% returns into projections of future pension fund earnings. Now those unrealistic projections are being questioned: California, Illinois on Brink of Pension Crisis (Mish).
This means tax revenues will have to be diverted from other government expenses to fund the pension plans.
A key dynamic in the pension crisis is called the the ratchet effect: it was effortless to increase the benefits and pensions of public employees, but it is effectively politically impossible to trim those promises.
The Ratchet Effect is one reason why the nation's political machinery has become sclerotic and ineffective: Dislocations Ahead: The Ratchet Effect, Stick-Slip and QE3(February 14, 2011).
As correspondent Mark G. explains, the public pension crisis has been 20 years in the making, and cannot be resolved without massive, sustained political and fiscal pain:
1. Long term interest rates began a secular decline in 1981. This continued until at least early this year.
2. In the early 1990s state and local politicians and their nominees began awarding management contracts to RIAs (Registered Investment Advisor) who promised higher rates of return. These promises were eagerly accepted at face value since it allowed them to reduce their annual contribution for defined benefit pension plans and spend the money elsewhere.
#1 plus the Reagan bull market made it possible to present this as fiscally responsible, or at least as progressive. Over the same period of time private corporations tended to shift to defined contribution plans for new hires. iow they ceased underwriting market risk for their pension funds. State and local governments will eventually be forced to follow this example.
Where Mish writes: "Pension plans typically assume 7.5% returns. That's not going to happen on a sustained basis with 10-year treasuries yielding close to 2%. Yet, any significant rise in bond yields will crush existing bondholders as well as wreak havoc in equities," he's underestimating the return assumption for a great many pension plans. CALPERS & CALSTRS (California public employee pension plans) are functionally at 8% or higher.
3. As a consequence of 1 & 2 defined benefit pension plans (along with charitable endowments) began a long-term movement out of bonds. The portfolio percentage allocations to stocks, followed by other forms of equity, began shooting up. Why would they not? The last time 30-year Treasuries saw 8% was in late 1994. It was already crystal clear by 1996 that investing in bonds was just a way to slowly sink into insolvency.
We're not on any "brink." It took two decades to get into this systemically insolvent condition. And I don't think this situation will produce further market instability. It's already been the main catalyst of market volatility since the mid 1990s in my second hand educated opinion. The dot.com and subprime housing bubbles could never have gotten so big without the participation of public and non-profit funds heaving hundreds of billions around in a chase for investment grade high yield.
In other words, the real casino action started at the precise moment that planning IRRs exceeded the 30-year US Treasury Bond rate.
What happens next? Probably a lot of things will happen. This particular crisis will revolve around defined benefit state and local government employee pension funds. It was created in the political arena and that's where it will be resolved.
I think the Democratic Party will be the most affected. The public employee unions are a core constituency and produce most of the ground troops for the Democrats. Broadly speaking there are two approaches. These are; 1) obtain more money and 2) reduce benefit payouts.
1. Obtain More Money.
a. Raising taxes (primarily targeting Republicans) will be the attempted default of Democrat single party states. But the crisis is most acute in precisely those single party Democratic states with the highest taxes already. It is therefore not clear this approach will really raise more money. It could equally create a large refugee movement of targeted taxpayers fleeing these jurisdictions, thus producing lower net revenues overall. The available demographic data says this process is well underway in California.
b. Shift appropriations between budget lines. This means reducing money for schools, police, highway maintenance, welfare et al and transferring it to pension funds. This will create conflict inside the Democratic party between key constituency groups.
c. Get the Federal government (or Federal Reserve) to undertake direct bailouts. This is going to create conflict between Democratic and Republican states over issues of federalism and "transfer payments".
2. Reduce Benefit Payouts.
Recent events in Wisconsin show the potential for this action to create extreme political unrest.
I have long been watching this situation as a potential vector for political collapse.
Thank you, Mark, for this primer on the unsustainability of public pension promises.Raising taxes is the default solution to state/local government shortfalls, but there's a structural problem with raising taxes:
1. Fulltime jobs--the kind that pay the bulk of state/local taxes--are stagnant.
2. Real income is down for the vast majority of workers.
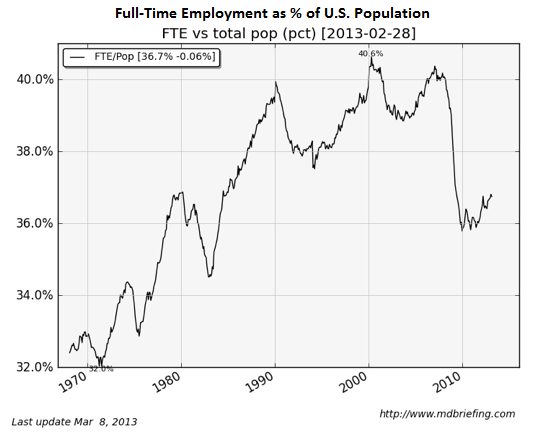
If state and local governments think low-income part-time workers can pay more taxes and survive, they are engaged in magical thinking:
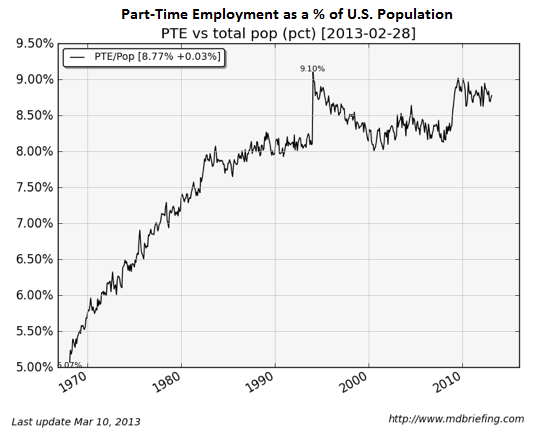
The percentage of the population with a job is back to the levels of the 1970s:
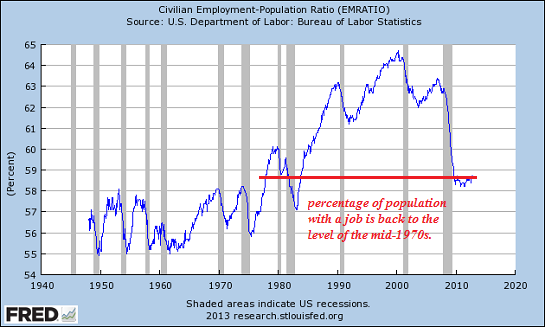
Real (adjusted for inflation) household income has declined by almost 8%; exactly how are households supposed to pay higher state and local taxes as their income steadily declines?
State and local governments planning on a Federal bailout should ponder this chart, which clearly shows a structural gap of monumental proportions between Federal tax revenues and Federal spending.
The endgame of promises made in an era of illusory, financialized abundance will be hurried along by a collapse in the equities and bond markets. I addressed the likelihood that all three primary investment markets would decline together in What If Stocks, Bonds and Housing All Go Down Together? (May 24, 2013): in a nutshell, if yields rise, mortgage rates rise and that sinks the housing market. Rising yields also sink stocks, as higher yields pull money out of risky equities. And rising yields also collapse the value of existing bonds, wiping out much of the wealth that is currently considered safe.
In sum: there is no way the pensions and benefits promised in an era of financialized abundance can be paid once the wheels of financialization fall off.
Gold traders turned bearish for the first time in a month as investors reduced holdings in exchange-traded products for an unprecedented 17th consecutive week and India, the biggest buyer, announced curbs on imports.
Eighteen analysts surveyed by Bloomberg expect prices to fall next week, with 14 bullish and four neutral, the largest proportion of bears since May 17. Investors sold 497.2 metric tons valued at about $22 billion through ETPs since Feb. 8 and the 2,117.96 tons left is the least they have held since March 2011, data compiled by Bloomberg show.
Bullion is on track for the first annual drop since 2000 as some investors lose faith in it as a store of value. While the slump into a bear market in April hurt billionaire hedge fund manager John Paulson and producer Newcrest Mining Ltd., it spurred purchases of coins and jewelry worldwide. That demand may be threatened in India after the nation raised gold import taxes to contain a record current-account deficit.
“Sentiment is very bleak,” said Andrey Kryuchenkov, a commodity strategist in London at VTB Capital, a unit of Russia’s second-largest lender. “The Indian import tax hike is concerning and it’s obviously not helping sentiment. Investors are basically on the sidelines. They don’t want to do anything and are still spooked.”
Gold Price
The metal fell 17% this year to $1,389.93 an ounce and is trading 28% below the record $1,921.15 set in September 2011. The Standard & Poor’s GSCI gauge of 24 commodities dropped 2.2% since January started and the MSCI All-Country World Index of equities rose 7.3%. Treasuries lost 1.4%, a Bank of America Corp. index shows.
India raised the import duty to 8% from 6% on June 5 and the central bank also further restricted shipments. Overseas purchases slid to an average of $36 million a day in the 14 business days through June 7, compared with an average $135 million a day in the 13 days through May 20, Raghuram Rajan, chief economic adviser in the Finance Ministry, said June 11. The All India Gems & Jewellery Trade Association has asked the government for a discussion on reversing the tax increase.
The move to slow demand comes amid the worst drop in ETP holdings since the first product was listed in 2003. Assets fell for 17 weeks through June 7 and are down 17.9 tons so far this week. Paulson, the largest investor in the SPDR Gold Trust, the biggest ETP, had a 13% loss in his Gold Fund last month. That takes the decline since the start of the year to 54%, according to a copy of a letter to investors obtained by Bloomberg News.
Write Down
Gold’s plunge is also hurting producers already contending with rising costs. Newcrest, Australia’s largest gold producer, said last week it will write down the value of its assets by as much as A$6 billion ($5.9 billion) after the slump. The 30- member Philadelphia Stock Exchange Gold and Silver Index slid 37% this year.
Data released last week showed U.S. payrolls increased more than forecast in May and Federal Reserve Chairman Ben S. Bernanke said last month that the central bank could curtail its $85 billion monthly bond purchases if the economy improves. The World Bank raised its 2013 U.S. growth forecast on June 12 to 2%, from 1.9% in January, even as it cut its estimate for the global economy to 2.2%, from 2.4%.
U.S. Stimulus
Bullion rose 58% since 2008 as the Fed led a global surge in money printing to boost growth. While the U.S. central bank will slow purchases, it will still buy $65 billion a month by October, the median of 59 economist estimates compiled by Bloomberg this month shows. The Bank of Japan restated its April pledge this week to increase the monetary base by 60 trillion to 70 trillion yen ($742 billion) a year, and refrained from adding extra policy tools to counter bond-market volatility.
“Global fundamentals, including accommodative monetary policy, remain positive for gold,” said Adrian Day, who manages about $135 million of assets as the president of Adrian Day Asset Management in Annapolis, Maryland. “The market is slowly realizing that despite all the talk about tapering of bond buying by the Fed, there will be no meaningful global tightening any time soon.”
The surge in equities over the past three quarters, which also damped demand for gold, is now partially reversing. The MSCI All-Country World Index reached a seven-week low yesterday. The U.S. Dollar Index, a measure against six currencies, slipped to the weakest in almost four months.
Money Managers
Hedge funds and other large speculators got more positive in the past two weeks after reducing bullish bets to the lowest in almost six years, U.S. Commodity Futures Trading Commission data show. They increased their net-long position by 60% to 57,113 contracts in the two weeks to June 4.
There are still signs that lower prices are boosting physical buying. The U.K.’s Royal Mint, which saw its gold-coin sales triple in April, said last week the “steep increase” in demand continued in the past several weeks. The U.S. Mint predicted last week that its gold and silver coin sales may reach a record in 2013, and the Austrian Mint said it expects “quite good business” in the next couple of months.
Gold’s 60-day historical volatility reached 28.9% today, the highest since December 2011, data compiled by Bloomberg show. That compares with an average of 20.6% in the past five years.
In other commodities, six of 11 people surveyed expect raw sugar to drop next week and two were neutral. The commodity slid 14% to 16.85 cents a pound on ICE Futures U.S. in New York this year.
Grain Costs
Eighteen of 30 surveyed anticipate lower corn prices and nine said the grain will gain, while 14 of 29 said soybeans will rise and 13 expect lower prices. Eighteen traders predicted declines in wheat and seven were bullish. Corn fell 24% to $5.305 a bushel this year in Chicago. The December contract, which reflects supply after the U.S. harvest, is down 12% this year. Soybeans lost 8.3% to $12.92 a bushel, as wheat declined 13% to $6.7925 a bushel.
Seven traders and analysts surveyed expect copper to fall next week, six were bullish and five were neutral. The metal for delivery in three months, the London Metal Exchange’s benchmark contract, slipped 11% to $7,098.25 a ton this year.
‘Death Bells’
Citigroup Inc. said in May that this year will probably signal “death bells” for the commodities super cycle, or longer-than-average period of rising prices. Societe Generale SA wrote in a June 12 report that it’s too early to call a near- term end to the super cycle because of expanding populations with more disposable income and greater urbanization.
The Washington-based World Bank cut China’s growth outlook to 7.7%, from 8.4% previously. The nation is the biggest user of everything from copper to cotton to coal. Metals and grains are among the worst-performing commodities this year.
“Our call has been for a bottoming in commodities prices in the second-quarter,” said Bjarne Schieldrop, the Oslo-based chief commodity analyst at SEB AB. “The reduced growth outlook by the World Bank is shaking that confidence a little.”
*T
Gold survey results: Bullish: 14 Bearish: 18 Hold: 4
Copper survey results: Bullish: 6 Bearish: 7 Hold: 5
Corn survey results: Bullish: 9 Bearish: 18 Hold: 3
Soybean survey results: Bullish: 14 Bearish: 13 Hold: 2
Wheat survey results: Bullish: 7 Bearish: 18 Hold: 2
Raw sugar survey results: Bullish: 3 Bearish: 6 Hold: 2
White sugar survey results: Bullish: 4 Bearish: 5 Hold: 2
White sugar premium results: Widen: 2 Narrow: 1 Neutral: 8
*T
by Market Anthropology
It seems like yesterday that markets rose and fell like a synchronized swim team - floundering through a tired routine. Back in 2011, markets were so tightly correlated that if a "swimmer" fell off-balance in trend, snap reversions could be arbitraged quickly - assuming you had a handle on the markets flow. For example, if you had good intuition on what was going on in the currency markets, you could trade with greater execution and frequency through the commodity and equity markets - and vice versa. In 2012, that extreme in correlations began to thaw, although was still historically tight, most notably between some of the long term drivers between the currency and commodity markets.
Year to date, the correlation environment continues to shift which has translated into some confusion as expectations pass through the markets many gear exchanges. As noted - and to a large degree expected; long-term relationships have been skewed towards some rather strange bedfellows. The bond market sells off - the stock market sells off. The dollar weakens - precious metals weaken (not expected). The bond market sells off - the dollar sells off. Whether its an artifact of increased intervention from a variety of different motivations and interests, or just nature's way these days - we've come along way since 2011. What we can do for bearings today? Continue working with those assets that have wagged the system with greatest affect.
........
A few weeks back, we had commented on the similar asset structures and motivations of risk appetites between QE2 and QE3. We had highlighted silver during the buildup and bust of Bernanke's second salvo and the SPX during the bolus of his third.

Click to enlarge image

Click to enlarge image

Click to enlarge image
In hindsight, the SPX did pivot lower where the study had expected it would. However, the closer comparative - both in magnitude of gains and corrective structure to silver's blowoff run in 2011 - is the Nikkei today.

Click to enlarge image

Click to enlarge image
It's safe to say that both silver and the Nikkei were THE risk cocktails for each periods pronounced gains; whereas, the markets monetary handlers had brought participants noses back to the trough to feed (through a perceived weakened currency) - then gallop, in the asset meadows that would most benefit its yield. What's noteworthy with the latest behavioral whip, is the overlap between what the Fed attempted with QE3 and the secondary and more explosive intervention in Japan with the introduction of Abeonomics in November.
Going forward, we will be keeping a close eye on the Nikkei and add it to our comparative series with the yen which has pointed for several months to a material pivot higher in this timeframe. In the short term, the comparative calls for a retest of the Nikkei's 50 day SMA.

Click to enlarge image

Click to enlarge image
All things considered, you could make the argument that although QE3 appeared to be floundering coming into the end of last year; through the backdoor of the yen - the SPX succeeded in breaking through the Meridian's overhead resistance. Although it might not have been organically sowed, QE2 brought the equity markets back to kiss long-term resistance in 2011 - and the enunciations of Carry Trade Abe helped bust through the hedgerow this year.

Click to enlarge image

Click to enlarge image

Click to enlarge image
Despite languishing in some reversionary weeds, we still expect the gold miners to follow the yen higher over the intermediate time frame.

Click to enlarge image

Click to enlarge image
Taking its time and consolidating with the equity markets, Apple looks poised to take another leg higher soon.

Click to enlarge image
Although the precious metals have little to show for it so far, the US dollar index continues to get hit with both of the biggest mallets from the euro and the yen.

Click to enlarge image
We are keeping very close tabs on the CRB to see if it confirms the shift in perspective of the US dollar. Discrete positive divergences in momentum and strength have recently been noted.

Click to enlarge image
by Isabel Ortiz
NEW YORK – At this year’s International Monetary Fund/World Bank spring meetings in Washington, DC, the IMF urged European countries to ease their austerity policies and focus on investment, marking a shift from past rhetoric. But, in the corridors of those two multilateral institutions, there was talk of double standards.

Illustration by Tim Brinton
In fact, most countries are cutting public expenditures – with the IMF’s support. So, even as some northern countries begin to question the austerity prescription, their southern counterparts (including southern European countries) are increasingly adopting fiscal-adjustment measures.
According to IMF projections, of the 119 governments that are shrinking their 2013 budgets (relative to GDP), three-quarters are in developing countries (including 21 low-income and 68 middle-income countries). Fiscal consolidation affects an estimated 80% of developing-country citizens, and its impact is expected to intensify steadily through 2015. During this time, the magnitude of contraction will be significant, with roughly one-quarter of all developing countries expected to cut expenditures below pre-crisis levels.
A review of policy discussions from 314 IMF country reports published since 2010 – part of a comprehensive update on the global shift toward austerity – shows that many adjustment measures are most prevalent in developing countries, where citizens are especially vulnerable to austerity’s economic and social consequences.
The most common adjustment measure, which governments in 78 developing countries are considering, is subsidy reduction. Deliberations on the subject are often – indeed, in 55 developing countries – accompanied by discussion of the need for a targeted social safety net to offset higher food, energy, or transport costs for the poorest citizens.
But developing and implementing a social-protection floor takes time, and governments do not seem to be willing to wait. At a time when the need for food assistance is particularly high, some governments have withdrawn food subsidies and others have scaled back subsidies for agricultural inputs like seeds, fertilizer, and pesticides, hindering local food production.
Similarly, public-sector wage cuts and caps – currently being pursued by 75 developing countries – threaten to undermine service delivery to citizens, particularly at the local level in poor rural areas, where a single teacher or nurse can determine whether a child receives an education or health care. This danger is heightened as policymakers in 22 developing countries consider health-care reforms and those in 47 developing countries discuss pension reforms.
On the revenue side, as many as 63 developing countries are considering raising consumption taxes, such as the value-added tax. But taxing basic foods and household items can have a disproportionate impact on lower-income families, whose limited disposable incomes are already stretched thin, and thus can exacerbate existing inequalities.
Instead of slashing expenditures, developing-country leaders should focus on providing decent job opportunities and improved living standards for their citizens. They must recognize that austerity will not help them to achieve their development goals. On the contrary, spending cuts will hurt their most vulnerable citizens, widen the gap between rich and poor, and contribute to social and political instability.
Indeed, civil unrest is already on the rise across the developing world. From the Arab Spring to the violent food riots that have erupted in recent years across Asia, Africa, and the Middle East, populations are reacting to the cumulative effects of pervasive unemployment, high food prices, and deteriorating living conditions.
Ours does not have to be an age of austerity; governments, even in the poorest countries, have options to foster a socially responsive economic recovery. These include, among other measures, debt restructuring, increasing the progressivity of taxation (on personal income, property, and corporations, including the financial sector), and curbing tax evasion, the use of tax havens, and illicit financial flows.
Ultimately, reducing wages, public services, and household income impedes human development, threatens political stability, lowers demand, and delays recovery. Rather than continuing to adhere to policies that do more harm than good, policymakers should consider a new approach – one than actually contributes to their countries’ social and economic progress.
by Tyler Durden
Earlier today we reported that producer prices in May rose primarily as a result of a jump in electricity and nat gas prices. Which is why it is somewhat surprising that Industrial Production among Utilities dropped by the most, or -1.8%, for the second month in a row, following last month's -3.2% decline. This drop was offset by an increase in Mining IP of 0.7% (a decline from April's 1.1%) and the general manufacturing production which increased by a tiny 0.1%, still the best result of the past three months. Altogether, these amounted to an unchanged print in the broader index, which printed at 98.7, same as April, and the lowest since February, not to mention below expectations of a 0.2% increase.

More importantly, that IP just posted a Q/Q decline is hardly encouraging for those claiming Bernanke is ready to remove the economy's training wheels:

Finally, looking at capacity utilization, in May total industry CU edged down 0.1 percentage point to 77.6 percent, a rate 0.2 percentage point below its level of a year earlier and 2.6 percentage points below its long-run (1972–2012) average. It was also the lowest print since October 2012. Oops.

Of course, what is bad for the economy is good for the stock market. Actually, when it comes to the stock market, everything is good for this last bastion of faith in central planning.
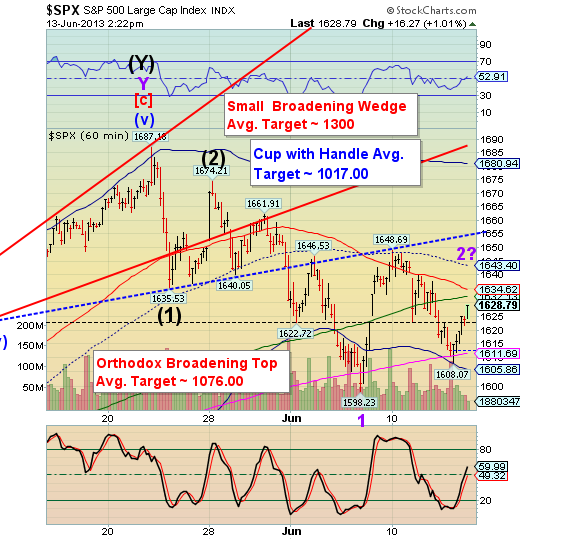
SPX rallied above the shelf of support, reconstituting the decline as an a-b-c and not an impulse. The next target for this rally is Intermediate-term resistance at 1632.13. If it stops there, this may be considered a truncated Minute Wave [c].
The rally may even attempt to revisit mid-Cycle resistance at 1643.40, but this is an alternate view. If long, stay close to your computer, since neither of the targets mentioned are assured. This rally may turn on a dime. Believe it or not, this is the most bearish outcome possible, since the next time SPX crosses the 50-day it will likely not stop for a considerable distance, if not until it hits bottom at the end of June.
Another advisor, issuing a “Black Swan Alert” says this, “For the first time in modern history, there is no safe haven investment to shift you funds to. Bonds, gold, commodities, real estate, collectibles, and most non-US currencies are at high risk of substantial declines as investors sell everything to cover margin calls. (Any knee-jerk rise in bonds or gold on flight-to-safety buying can be expected to be very temporary, e.g. a selling opportunity.) Cash is king, and the US Dollar is the king of kings. Cash should be kept in insured savings accounts or short-term Treasury bills. Those with cash at the bottom will have buying opportunities of a lifetime.”
This is the most margined, most optioned market in recorded history. There is nothing to compare its condition to. Nothing.
By: J_W_Jones
Risk assets and financial markets around the world have been supported by central bank action for several years. Performing financial alchemy on a scale larger than has been seen in the history of mankind, central banks have hijacked global financial markets. Mountains of liquidity, artificially low interest rates, and the creation of future asset bubbles has been their calling card for the past few years.
Unfortunately, time is starting to run out and these great Keynesian minds are on the verge of encountering a series of problems. While central banks can create fiat currency out of thin air, they cannot create real wealth. In fact, central banks cannot print jobs, earnings growth, or an increase in wages.
Furthermore, in a paper put out by the New York Federal Reserve in 2012 and covered by zerohedge.com (“Fed Confused Reality Doesn’t Conform to Its Economic Models, Shocked Its Models Predict Explosive Inflation”) the Fed openly admits that forward outcomes cannot be predicted with accuracy by their economic models. Furthermore, one of the models known as the Smets and Wouters Model has predicted significant inflation if interest rates were held near zero for more than 8 quarters.
For inquiring minds, I would forward readers to the zerohedge.com article for a more in depth explanation. Ultimately the Federal Reserve is performing a gigantic experiment in real time while admitting their economic models do not accurately portray outcomes in the future. Nowhere can this be seen more than in recent price action in U.S. Treasury prices.
Since mid-November of 2012, the 30 Year Treasury Bond has seen prices go down by roughly 9% in value. When Treasury prices are falling, interest rates are rising as there is an inverse relationship between bond prices and yields. When longer term Treasury bonds are demonstrating rising interest rates it is a signal that the bond market is expecting higher inflation levels out into the future. The weekly chart of the 30 Year Treasury Bond is shown below.
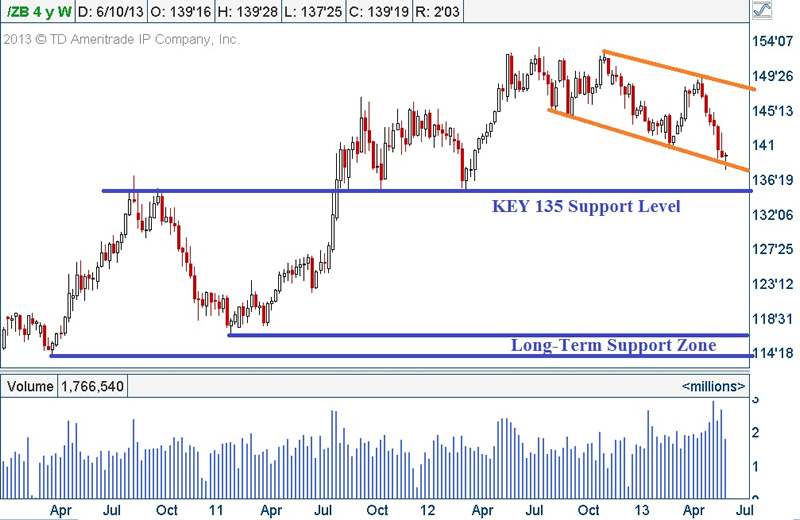
As can clearly be seen above, prices have been coming down for several months and we have initiated a price pattern with lower highs and lower lows. This is not a bullish pattern by any means and should the 30 Year Treasury bond take out key support around the 135 price level the Federal Reserve will be in an awkward position.
The Fed’s problem lies in the fact that the Federal Reserve is printing nearly $85 billion dollars of fiat currency to purchase U.S. Treasury and agency bonds and rates have still risen. It would only make sense that at some point, the Federal Reserve will have to ratchet up their program to defend Treasury prices.
If the printing presses fire up fast and furiously to help put a floor under Treasury bonds (cap rates), what is going to happen to commodity prices such as oil? As shown below, the oil futures daily chart illustrates a coiled price pattern that ultimately will lead to a strong move in price.
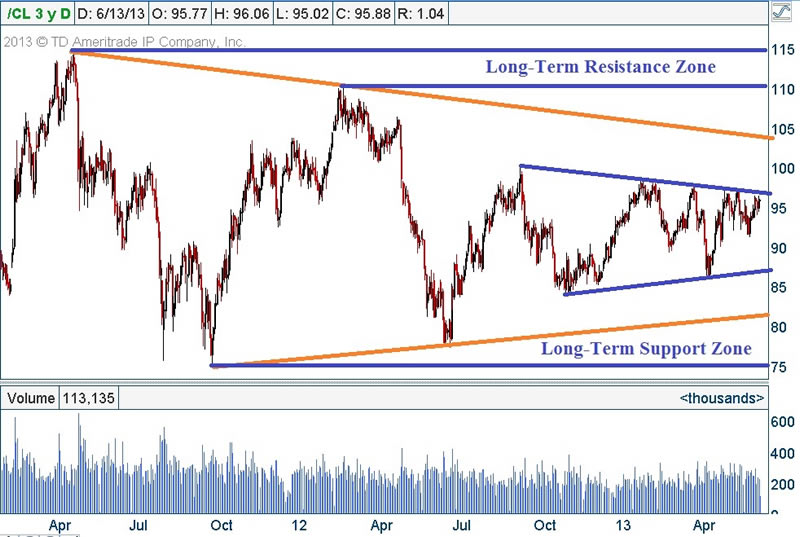
A move in oil prices above the $96 – $98 / barrel level will likely lead to a powerful move higher in oil prices toward the $100 – $112 / barrel range. Obviously a big move is coming and we could see a move lower just as easily. I have no idea where price is going, but what I do know is that oil prices are staged up for a fast, large move in price.
Interestingly enough, gold futures are also in a basing pattern after selling off sharply earlier this year. Similar to oil futures, gold futures prices are coiling up as well and could go either direction as shown below:
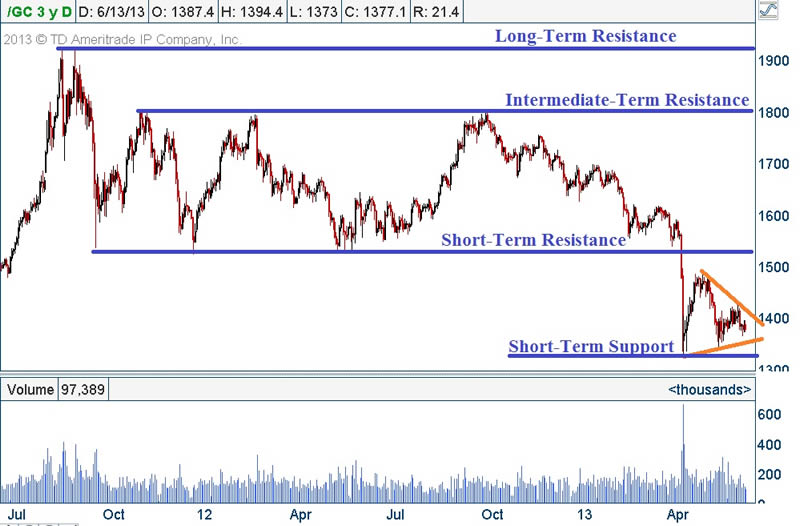
As can be seen above, gold futures are trading in a consolidation pattern which could lead to a strong breakout in either direction. While the upside seems more likely, it goes without saying that lower prices are always a possibility. However, the point I would make to readers is that a large move in the near future seems likely in both gold and oil futures.
Gold is simply a hedge for inflation and acts as a senior currency, however if inflation increases gold will protect owners from a reduction in purchasing power. From an economic standpoint, oil and energy prices are far more important than gold prices. If the Federal Reserve’s Smets and Wouters Model is accurate in its expectation of strong inflation pressure in the future, I would anticipate seeing a strong move higher in both oil and gold prices.
However, the real point is that the Federal Reserve will likely find itself in a precarious position in the future. On one hand, they have to print money to backstop Treasury bonds through additional quantitative easing machinations. On the other hand, the additional liquidity may start pouring into commodities if inflationary pressures begin to mount.
Ultimately the Federal Reserve may attempt to hold down interest rates to help the economy but if their activities cause energy prices to spike the U.S. economy will begin to move toward recession quickly. In addition to that scenario, it should leave many readers unsettled that it would appear Treasury rates are rising while the Federal Reserve continues to print vast sums of fiat currency to buy more government debt.
Ultimately, the Federal Reserve does not have a great answer about the future since they publicly admit many of their models do a poor job of predicting future economic conditions based on actions that they are taking. At the end of the day, this is just one gigantic Keynesian experiment worldwide and the outcome will follow historical trends.
It does not take an economic genius to understand that the vast amounts of fiat currency created by the unprecedented recent actions of the Federal Reserve will have to find a home somewhere. This process will likely manifest as dramatically higher prices for a host of necessities in the future. In fact, the recent parabolic rise in stock market prices can be viewed not as higher prices for equities, but simply lower valued U.S. dollars.
Perhaps instead of concocting models with large names which simply do not work, why doesn’t the Federal Reserve open a few history books. Regardless of what central bankers believe or what their models produce, history’s version of the outcome is simply unpleasant. Ultimately the Federal Reserve should focus on the old adage that those who ignore history are doomed to repeat it.
Follow Us