Thursday, December 5, 2013

Buy Low And Sell High? Our Super Commodity System Do This For You!

The system allows to take position on the market well in advance of traditional methods and greatly benefit the investor in the subsequent management of the open positions. Super Commodity works with simple and effective rules and with fixed and not optimized parameters.

Test and evaluate for free our Super Commodity system


Top 10 rules of portfolio diversification
If there is one thing the 2008 financial meltdown taught us, it is the value of a properly diversified portfolio. The second thing is that if you think you are diversified, you may need to check again. At the time, many thought they were, only to see losses across the board as assets that previously were uncorrelated moved together and sunk many a portfolio.
Today, figuring out what constitutes a diversified portfolio and, more importantly, how to actually assemble one can be a difficult and at times frustrating ordeal; every analyst and investment advisor has a different idea. To help you navigate these treacherous waters, we offer the following 10 rules of portfolio diversification.

1. Start with the end in mind. A diversified portfolio is not a one-size-fits-all product. Instead, it should be personalized, focusing on your personal long-term investment goals while considering your current personal circumstances. According to Michael Loewengart, senior investment strategist at E*TRADE Capital Management, your personal circumstances should take into account your current financial situation, expected future expenses and how far away from retirement you are. "The goal of asset allocation is to make sure the level of volatility in your portfolio is in line with your goals, personal circumstances and tolerance for risk," he says. Additionally, consider your temperament. If high-risk assets make you overly stressed, perhaps it would be better to stick with comparably low-risk alternatives.
2. Aim to reduce overall risk. Portfolio diversification has two goals, this being the first and what most people associate with diversification. If you have multiple assets in your portfolio, even if one is not doing well, you have others that are outperforming. As such, this reduces the overall volatility of the portfolio. "[Diversification] reduces your risk. Instead of being stuck in just one sector that may not do well at times, a diversified portfolio can sustain you and keep you in business," Michael Clarke, CEO of Clarke Capital Management, says.
3. Aim to enhance overall returns. Being able to capitalize in markets that are outperforming and adding to your bottom-line is the second goal of a diverse portfolio. Not only does owning a range of assets protect you in the event that one does poorly, but it positions you to take advantage of ones that perform exemplarily. "We try to have a finger in each of the different sectors because in our experience usually something is working and that one may save the bill," says Clarke.

4. Invest in multiple asset classes. Traditionally, a portfolio was considered diverse if it had a mixture of equities and bonds. As investors are becoming more sophisticated, other assets such as commodities, real estate and foreign currencies are receiving more attention. In order to reduce risk and enhance returns, investments in numerous asset classes help keep correlations among assets in check. Each class has its own drivers and its own speed bumps. Taken together, they help smooth out the ride.

5. Invest in multiple sectors within the asset classes. Just as investing in multiple asset classes reduces risk and enhances returns, so too does investing in multiple sectors within those asset classes. Just including equities, bonds and commodities is not enough as equities have sectors reaching from healthcare to industrial metals, bonds have a variety of maturations and commodities include energies, metals and foods. "You want to be allocated amongst the various market sectors and industries. Across asset classes, you want to have further diversification into the different segments," Loewengart says.

6. Own assets that do well in bull, bear and sideways markets. This point really stresses the need for owning a diverse array of assets. You do not want to place all your eggs in a basket that does well when the stock market is moving up, because that also means your portfolio will do very poorly when that bull market turns into a bear. Instead, it usually is advisable to own assets with a negative correlation in which one asset moves higher while the other moves lower. Examples of this relationship include the U.S. dollar and crude oil as well as stocks and bonds. It is often true that in times of crisis all correlations go to 1.0, but some strategies are more resistant to this. It is wise to look broadly at how various assets perform in different environments.
Commodity Trading Advisor Salem Abraham pointed out following 2008 that nearly all asset classes were long the economy. Managed futures, which are diversified in their own right through being long or short disparate sectors like agriculture, metals, energies, interest rates and currencies, also perform well in periods of high dislocation. Other diversified asset classes had the same negative response to the economic crisis but managed futures did well by taking advantage of fat tail events rather than being punished by them.
7. Have a disciplined plan for portfolio rebalancing. If you have constructed your portfolio properly, it is to be expected that some assets will outperform others and over time begin constituting a larger percentage of your portfolio. That is the time to rebalance and bring your investments back in check with one another. "If you have a disciplined plan for rebalancing in place, then you can capitalize on the different movements that will take place from the different assets in your portfolio," Loewengart says.
He explains that that discipline will enable you to automatically sell out of your outperforming assets and buy into those underperforming. Consequently, you will naturally be selling high and buying low.

8. No "borrowing" among classes except during rebalancing. Trading can become emotional and that can cloud your judgment. It may seem like a good idea to abandon an investment decision that is not immediately paying off or to bolster ones that are doing well. Proceed with caution, because that is a move that catches many investors. The reason for having a rebalancing plan is to remove that emotional element. "When you look at your portfolio, rebalancing with a stated framework is going to give you the discipline that many investors inherently lack," Loewengart says. That discipline helps you do the things that you may not want to do, but are in your best interest.

9. Backtest your portfolio, but consider current market conditions. Backtesting can help you see correlations that exist in your portfolio and can allow you to see how it would stack up in various market conditions. There is a reason, though, that investment advisors are required to say, "Past performance is not indicative of future results." Also, remember there will be periods in the past in which your portfolio would not have fared well.
Past events can provide a framework, but also consider current market conditions to better position your portfolio for future events. We can learn a lot from the past, but current events are shaping
tomorrow’s markets.

10. Test asset correlations periodically. If there is one thing we can count on in the markets, it’s that they will never stay exactly the same. What was negatively correlated one year can move lock-step the next. Consequently, it is not enough to simply rebalance from time to time; you also need to test the asset correlations in your portfolio periodically to see if anything has changed. As markets change, you need to make informed decisions as to how you need to alter your portfolio to counter those changes. You can’t expect your portfolio allocation decisions to be a one-and-done event; as markets change, so to must your portfolio.

These rules leave a lot to personal judgment and that is the key to success. One additional item to point out is that any allocation to a less liquid asset should calculate that liquidity risk in addition to other risks to achieve the proper allocation.
Your portfolio should fit your needs. Unfortunately in the past not all potential asset classes were available to retail investors. Today, thanks to innovative exchange-traded funds (ETFs) and mutual fund structures, nearly every investor can access commodities, currencies, short and leveraged strategies as well as active strategies including managed futures. Now everyone truly can be diversified.

Should You Still Use Commodity to Diversify Investment Portfolio?
A new study from the Bank of International Settlements (BIS) raises doubts about the value of commodities as a tool for enhancing portfolio diversification. The paper’s smoking gun, so to speak, is that “the correlation between commodity and equity returns has substantially increased after the onset of the recent financial crisis.” Some pundits interpret the study as a rationale for avoiding commodities entirely for asset allocation purposes. But that’s too extreme.
In fact, this BIS paper, although worth a careful read, isn’t telling us anything new. That said, it’s a useful reminder for what should have been obvious all along, namely: there are no silver bullets that will lead you, in one fell swoop, to the promised land of portfolio design. The idea that adding commodities (or any other asset class or trading strategy) to an existing portfolio will somehow transform it into a marvel of financial design is doomed to failure. Progress in the art/science of asset allocation arrives incrementally, if at all, once you move beyond the easy and obvious decision to hold a broad mix of the major asset classes.
Correlations are a key factor in the design and management of asset allocation, but they’re not the only factor. And even if we can find assets and strategies with reliably low/negative correlations with, say, equities, that alone isn’t enough, as I discussed last week. You also need to consider other factors, starting with expected return. It may be tempting to focus on one pair of assets and consider how the trailing correlation stacks up today. But that’s hardly the last word on making intelligent decisions on how to build a diversified portfolio.
Perhaps the first rule is to be realistic, which means recognizing that expected correlations, returns and volatility are in constant flux—and not necessarily in our favor, at least not all of the time. Bill Bernstein’s recent e-book (Skating Where the Puck Was: The Correlation Game in a Flat World), which I briefly reviewed a few months ago, warns that the increasing globalization of markets makes it ever more difficult to earn a risk premium at a given level of risk. As “new” asset classes and strategies become popular and accessible, the risk-return profile that looks so attractive on a trailing basis will likely become less so in the future, Bernstein explains. That’s old news, but it’s forever relevant.
As more investors pile into commodities, REITs, hedge funds, and other formerly obscure corners, the historical diversification benefits will likely fade. Granted, the outlook for expected diversification benefits fluctuates through time, and so what looks unattractive today may look considerably more compelling tomorrow (and vice versa). But as a general proposition, it’s reasonable to assume that correlations generally will inch closer to 1.0. That doesn’t mean that diversifying across asset classes is destined to become worthless, but the expected payoff is likely to dim with the passage of time.
The good news is that this future isn't a total loss because holding a broad set of asset classes is only half the battle. Your investment results also rely heavily on how and when you rebalance the mix. Even in a world where correlations are higher and expected returns are lower, there’s going to be a lot of short-term variation on these fronts. In other words, price volatility will remain high, which opens the door (at least in theory) for earning a respectable risk premium.
Still, it’s wise to manage expectations along with assets. Consider how correlations have evolved. To be precise, consider how correlations of risk premia among asset classes compare on a rolling three-year basis over the last 10 years relative to the Global Market Index (GMI), an unmanaged market-weighted portfolio of all the major asset classes. As you can see in the chart below, correlations generally have increased. If you were only looking at this risk metric in isolation, in terms of history, you might ignore the asset classes that are near 1.0 readings, which is to say those with relatively high correlations vis-a-vis GMI. But by that reasoning, you’d ignore foreign stocks from a US-investor perspective, which is almost certainly a mistake as a strategic decision.

Nonetheless, diversifying into foreign equities looks less attractive today compared with, say, 2005. Maybe that inspires a lower allocation. Then again, if there’s a new round of volatility, the opportunity linked with diversifying into foreign markets may look stronger.
The expected advantages (and risk) with rebalancing, in other words, are constantly in flux. The lesson is that looking in the rear-view mirror at correlations, returns, volatility, etc., is only the beginning—not the end—of your analytical travels.
Sure, correlations generally are apt to be higher, which means that it’s going to be somewhat tougher to earn the same return at a comparable level of risk relative to the past. But that doesn’t mean we should abandon certain asset classes. It does mean that we’ll have to work harder to generate the same results.
That’s hardly a new development. In fact, it’s been true all along. As investing becomes increasingly competitive, and more asset classes and strategies become securitized, expected risk premia will likely slide. But what’s true across the sweep of time isn’t necessarily true in every shorter-run period. The combination of asset allocation and rebalancing is still a powerful mix—far more so than either one is by itself. And that’s not likely to change, even in a world of higher correlations.

Sugar falls on increased offers from India, Thailand

By Jack Scoville

SUGAR (NYBOT:SBH14)

General Comments: Futures were lower in both New York and London and made new lows for the move. Traders were talking about increased offers from India and Thailand. All this comes on the back of very high sugarcane production in Brazil. Coopersucar said yesterday that it should have its export warehouse fully open again next month and expects to meet all export targets for this year and next year. The market needs some demand news. Chart trends remain down in New York and London. Countries like India and Thailand are selling as much as possible. Weather conditions in key production areas around the world are rated as mostly good.

Overnight News: Brazil could see showers tomorrow, but mostly dry weather, and near to above normal temperatures.

Chart Trends: Trends in New York are down with no objectives. Support is at 1640, 1610, and 1580 March, and resistance is at 1685, 1700, and 1715 March. Trends in London are down with objectives of 446.00 March. Support is at 446.00, 440.00, and 434.00 March, and resistance is at 460.00, 465.00, and 466.00 March.

COTTON (NYBOT:CTH14)

General Comments: Futures closed higher, but stayed in the recent trading range. Prices are still getting support from the storm that hit the production areas last week. Quality has suffered with the storm, and there is potential for some yield loss as well. There are questions about demand in China as the government there has offered its supplies into the domestic market. It sold half of its offer at the auction last week and will most likely offer more soon. Wire reports indicate that some production has been lost in China after recent bad weather in some growing areas. Brazil conditions are reported to be very good in Bahia. Harvest continues this week in the US, but should get interrupted again late in the week when the cold and snow and rain arrives.

Overnight News: The Delta and Southeast should see some showers and snow late in the week and through the weekend. Temperatures will average below normal. Texas will see rain and snow for the next couple of days, then dry conditions. Temperatures will average much below normal. The USDA spot price is 75.50 ct/lb. today. ICE said that certified Cotton stocks are now 0.206 million bales, from 0.225 million yesterday. USDA said that net Uplad Cotton export sales were 248,600 bales this year and 0 bales next year. Net Pima sales were 5,200 bales this year and 0 bales next year.

Chart Trends: Trends in Cotton are mixed. Support is at 78.00, 77.40, and 76.65 March, with resistance of 79.65, 80.50, and 80.95 March.

FCOJ (NYBOT:OJF14)

General Comments: Futures closed lower again as the weather in Florida remains generally very good. Current above normal readings in northern areas will be replaced by much below temperatures this weekend. No one is predicting any freezing temperatures for Florida. Traders are expecting USDA to show unchanged production in its estimates next week, but to lower production even more in coming production reports. The greening disease has affected crops in a big way and could cause reduced production for the next few years. Growing and harvest conditions in the state of Florida remain mostly good. It has turned drier, which is seasonal, and reports indicate that crops are in good condition. Irrigation water is available. Harvest is increasing. Brazil is seeing near to above normal temperatures and a few showers.

Overnight News: Florida weather forecasts call for mostly dry conditions. Temperatures will average above normal. 

Chart Trends: Trends in FCOJ are mixed to down. Support is at 131.00, 130.00, and 126.00 January, with resistance at 134.00, 140.00, and 141.00 January.

COFFEE (NYBOT:KCH14)

General Comments: Futures were higher in early trading, only to reverse and close lower on the day. London was the leader on the move higher and also on the move lower. London was higher on reports of light offers again from Vietnam due to recent rains and low prices. Roasters and others look for supplies and some have turned to Arabica, although not enough to move New York futures that much. However, it seems that Vietnamese producers might have started to sell, and some speculators decided to cover some longs after futures made some objectives for the move up. The Arabica market is seeing only light offers, but buying interest for Arabica overall remains very limited. Colombia remains the most active seller. The Brazil market there remains quiet as producers wait for prices to rally above the cost of production. The rest of northern Latin America was quiet, but there is talk of a lot of Coffee there as well. Central America is showing light offers as the harvest progresses under mostly good conditions. New York is trading in a range.

Overnight News: Certified stocks are lower today and are about 2.672 million bags. The ICO composite price is now 103.72 ct/lb. Brazil will get scattered showers this weekend. Temperatures will average near to above normal. Colombia should get scattered showers, and Central America and Mexico should get mostly dry weather, but showers are likely in northern Mexico. Temperatures should average near to above normal.

Chart Trends: Trends in New York are mixed. Support is at 107.00, 105.50, and 104.00 March, and resistance is at 113.00, 115.00, and 117.00 March. Trends in London are mixed to up with no objectives. Support is at 1665, 1630, and 1600 January, and resistance is at 1730, 1750, and 1770 January. Trends in Sao Paulo are mixed. Support is at 132.00, 131.00, and 129.00 March, and resistance is at 136.50, 138.00, and 140.00 March.

COCOA (NYBOT:SBH14)

General Comments: Futures closed lower on long liquidation by speculators. There were reports of increased selling from Ivory Coast last week, and supplies should be available. Ideas of very strong demand are supporting prices, and certified stocks keep dropping in New York. Reports indicate that rains are minimal this week in West Africa, which should help harvest progress and processing progress. Much of West Africa is now reporting reduced production due to stressful conditions earlier in the growing season, but this has yet to bear out in official data outside of Nigeria. The overall fundamental picture should support generally higher prices as the supply situation should be tight once the harvest selling is done. Midcrop production conditions are rated as good

Overnight News: Scattered showers or dry conditions are expected in West Africa. Temperatures will average near to above normal. Malaysia and Indonesia should see scattered showers. Temperatures should average near to above normal. Brazil will get dry conditions and near normal temperatures. ICE certified stocks are lower today at 3.391 million bags.

Chart Trends: Trends in New York are mixed. Support is at 2730, 2700, and 2650 March, with resistance at 2795, 2820, and 2845 March. Trends in London are mixed to down with objectives of 1700 and 1650 March. Support is at 1710, 1680, and 1660 March, with resistance at 1745, 1775, and 1790 March.

See the original article >>

This Friday's jobs report is important, but it's not the most crucial one

By Justin Pugsley

Friday is the monthly U.S. nonfarm payrolls – arguably the most important data release on the calendar. Every month each number takes on a greater significance with the U.S. Federal Reserve looking to start reining in its quantitative easing program probably beginning in March 2014.

The closer that date looms the more significant each number becomes. Indeed, those numbers have the power to be complete game changers for the forex market. An unusually strong reading and the markets will start to price Fed tapering in as a definite, which would see the U.S. dollar (NYBOT:DXZ13) strengthen and hit risk currencies hard. And the opposite if it is a particularly weak number.

This probably means that Q1 2014 numbers will potentially have the biggest impact of all.

For the November figures being released this Friday, various surveys suggest 160,000-180,000 jobs were added with the jobless rate falling to 7.2% from 7.3%. A number below 200,000 and within the expected range would not be seen as a game changer in terms of the direction of the USD.

Eagerly awaiting NFP

U.S. debt ceiling talks

Hitting an unemployment rate of 6.5% was touted by the Fed as a basis for rethinking its monetary policy. However, that has recently become a bit more complicated. The Fed has started picking up on the low labour participation rate, which is now under 63% and the lowest in decades, and wants to boost it.

So this Friday's jobs number is important, but probably not the most important one. Before beginning its tapering the Fed will want to be sure that the economy is on a sustainable path to recovery and that the pace of jobs creation is well established.

One factor the Fed will be acutely aware of is the coming wrangles over the U.S. debt ceiling, which will take place in early 2014. This could involve another shutdown of the U.S. government along with the usual political posturing and concerns over its impact on the economy.

If jobs aren't being created at a significant pace by then, the Fed may once again decide to postpone its tapering for fear that combined with a U.S. government show down it might be too much for the economy to take.

See the original article >>

Asymmetrical Bubbles

by Lance Roberts

Just recently Nobel Prize winning economist Robert Shiller warned that the U.S. stock market and Brazilian property market were areas of concern.  Specifically he stated:

"I am not yet sounding the alarm. But in many countries stock exchanges are at a high level and prices have risen sharply in some property markets that could end badly. 

I am most worried about the boom in the U.S. stock market. Also because our economy is still weak and vulnerable.

Bubbles look like this. And the world is still very vulnerable to a bubble."

Bubbles are created when investors do not recognize when rising asset prices get detached from underlying fundamentals, which I showed is currently the case in "The Market In Pictures."

PE-vs-Market-11113

However, just recently the Mercenary Trader blog reminded me of George Soros' take on bubbles.

"First, financial markets, far from accurately reflecting all the available knowledge, always provide a distorted view of reality. The degree of distortion may vary from time to time. Sometimes it's quite insignificant, at other times it is quite pronounced. When there is a significant divergence between market prices and the underlying reality I speak of far from equilibrium conditions.

I have developed a rudimentary theory of bubbles along these lines. Every bubble has two components: an underlying trend that prevails in reality and a misconception relating to that trend. When a positive feedback develops between the trend and the misconception, a boom-bust process is set in motion. The process is liable to be tested by negative feedback along the way, and if it is strong enough to survive these tests, both the trend and the misconception will be reinforced. Eventually, market expectations become so far removed from reality that people are forced to recognize that a misconception is involved. A twilight period ensues during which doubts grow and more and more people lose faith, but the prevailing trend is sustained by inertia. As Chuck Prince, former head of Citigroup, said, 'As long as the music is playing, you've got to get up and dance. We are still dancing.' Eventually a tipping point is reached when the trend is reversed; it then becomes self-reinforcing in the opposite direction.

Typically bubbles have an asymmetric shape. The boom is long and slow to start. It accelerates gradually until it flattens out again during the twilight period. The bust is short and steep because it involves the forced liquidation of unsound positions."

The chart below is an example of asymmetric bubbles.

Asymmetric-bubbles

Soros' view on the pattern of bubbles is interesting because it changes the argument from a fundamental view to a technical view.  Prices reflect the psychology of the market which can create a feedback loop between the markets and fundamentals.  As Soros stated:

"Financial markets do not play a purely passive role; they can also affect the so-called fundamentals they are supposed to reflect. These two functions, that financial markets perform, work in opposite directions. In the passive or cognitive function, the fundamentals are supposed to determine market prices. In the active or manipulative function market, prices find ways of influencing the fundamentals. When both functions operate at the same time, they interfere with each other. The supposedly independent variable of one function is the dependent variable of the other, so that neither function has a truly independent variable. As a result, neither market prices nor the underlying reality is fully determined. Both suffer from an element of uncertainty that cannot be quantified."

The chart below utilizes Dr. Robert Shiller's stock market data going back to 1900 on an inflation adjusted basis.  I then took a look at the markets prior to each major market correction and overlaid the asymmetrical bubble shape as discussed by George Soros.

Asymmetrical-Bubbles-120413

There is currently a strong belief that the financial markets are not in a bubble despite much evidence to the contrary. However, it is likely that prices are currently driving fundamentals particularly given the artificial interventions of the Federal Reserve which is something that I discussed back in March in "There Is No Asset Bubble?"

"The speculative appetite combined with the Fed’s liquidity is a powerful combination in the short term.  However, the increase in speculative risks combined with excess leverage leave the markets vulnerable to a sizable correction at some point in the future.

The only missing ingredient for such a correction currently is simply a catalyst to put 'fear' into an overly complacent marketplace. 

In the long term, it will ultimately be the fundamentals that drive the markets.  Currently, the deterioration in the growth rate of earnings, and economic strength, are not supportive of the speculative rise in asset prices or leverage.  The idea of whether, or not, the Federal Reserve, along with virtually every other central bank in the world, are inflating the next asset bubble is of significant importance to investors who can ill afford to, once again, lose a large chunk of their net worth. 

It is all reminiscent of the market peak of 1929 when Dr. Irving Fisher uttered his now famous words: 'Stocks have now reached a permanently high plateau.'  The clamoring of voices that the bull market is just beginning is telling much the same story.  History is replete with market crashes that occurred just as the mainstream belief made heretics out of anyone who dared to contradict the bullish bias."

The Mercenary Trader blog imparted some excellent words of wisdom in this regard:

In other words, you don’t have to be theoretically correct in your reasoning. You just need to have the right positions on at the right time. If you are in this game to win, then it is not about being right, but making money.

Yet at the same time, as a general rule you want to be theoretically sound if at all possible… because if your portfolio is anchored to a foundation of false beliefs, or not anchored to anything at all, that increases the likelihood of getting your head handed to you.

And thus, for traders especially, the ideal is to have the best of both worlds:

The ability to maintain general theoretical correctness, i.e. the chops to recognize a false trend for what it is, coupled with the flexibility and the means to profitably exploit false trends regardless, while keeping risk under control.

There are at least three levels to the game:

  • That which is real
  • That which is believed
  • The market’s reaction to both

And so we would argue that, right now, it is more important than ever to understand the nature of false trends, feedback loops, bubbles and the like — and the proper means of handling them all.

Does an asset bubble currently exist?  Ask anyone and they will tell you "NO."  However, maybe it is exactly that tacit denial which might just be an indication of its existence.

See the original article >>

ADP Report Points To A 193k BLS Employment Report

by Lance Roberts

Over the past few months, I have been experimenting with a model using the ADP employment report to estimate the highly watched BLS employment report. At the beginning of October, I laid out the initial premise in "Survey Vs. Data - Employment Estimate 160k":

"ADP reported its employment estimate for September which showed an increase of 166,000. This was shy of the 180,000 consensus. Historically speaking, going back to 2001, the average difference between the numbers of jobs reported by ADP is 21,992 less than what is normally reported by BLS. For example, in August, ADP reported 113,926 jobs whereas BLS reported 136,133 for a difference of 22,206. Since the beginning of 2012, the average difference of the number of total employed between the two reports has been approximately 22,200,000.
Therefore, if we use this average, we can solve for what the September jobs report from the BLS will most likely be. In the month of September, ADP reported total employment of 114,092 million. If we add the 22,200, the recent tendency of the difference, then the BLS report should be close to 136,293 million which would equate to a monthly increase in payrolls of 160,000. The current consensus range is 155,000 to 240,000 - so a print of 160,000 would be well below consensus and a bit of a disappointment."
At the end of October, following the conclusion of the government shutdown I updated the analysis stating:
"While 141,000 jobs in October is the actual estimate due to the average historical difference between the two reports - there are two adjustments that could skew the actual report.
The first scenario is a downwards revision to the September data. As I discussed above, such a negative revision would boost the estimate closer to 153,000 jobs created in October.
The second scenario is due to seasonal adjustments. October has a mixed bag of seasonal adjustments that have been both positive and negative. However, since 2001, the difference between the ADP and BLS reports has narrowed to just 22,021,200 total jobs. If the normal October effect comes into play, the markets could be due for a real downside shocker of just a net 75,000 jobs created in the last month. However, such a downside surprise would be considered "good news" as it support the need for the Federal Reserve to continue its current pace of liquidity interventions. 
One issue that may completely skew the model in October was the effect of the government shutdown that led to the furlough of 800,000+ workers. While those workers were rehired by the end of the month, the BLS only collects data during just one week of the month. That week fell during the furlough period. Therefore, it is possible the October jobs report could be skewed due to that temporary anomaly."

The subsequent BLS report showed a total of 136,554,000 jobs, which was an increase of 204,000 jobs in total for the month, which was substantially stronger than the 153,000 estimated increase using the ADP model.  However, in the most recent ADP survey for November the October report was revised almost 50% higher to 184,000 jobs closing the differential to just 20,000.

Estimating The November BLS Employment Report
With the latest ADP report for November, the average difference of total employment between the ADP and BLS reports has run 21,996,300 since 2001. The chart below shows the monthly difference between the two reports.

ADP-BLS-NOV-Est-120413

The dashed lines are two different averages of the monthly net differences. The average difference between the two reports since 2001 has been 21,996,300 total jobs. However, since 2006 the average difference has increased to 22,237,900.
If we use the October BLS report of total employment of 136,554,000, and adjust that number using the average difference from 2006 to present, we should expect to see a November BLS employment report of 136,740,900. This would equate to roughly a 391,000 job increase from October to November. Such a surge will very likely jolt the markets as fears increase that the Fed will "taper" their current monetary policies sooner rather than later.

However, if we look at the average historical difference between the two reports for just November months, there has been an average difference of just 21,993,980.  This would suggest that the BLS report for November would show an increase of just 147,000 which would fall towards the lower end of expectations which currently range from 140,000 to 200,000.  Furthermore, a reading of 147,000 jobs in the November BLS report would fall within the historical average of November reports of 141,256 going back to 1939.

BLS-November-JobGains-120413

Estimating The Over/Under
There are two other factors that will skew the November jobs report which are the seasonal adjustments to account for the hiring of temporary help for the holiday shopping season and the monthly "birth/death adjustment" to account for the change of new businesses in the economy.

The average seasonal adjustment to the November payroll report is a reduction of 715,000 jobs to smooth out the surge in seasonal hiring for November.  This will lower the topline estimate of a scorching 391,000 increase. 

However, the upward adjustments to the previous ADP reports also indicate that very likely the October BLS report will likewise be adjusted upward as a more accurate accounting of the impact of the government shutdown is made.  If we assume that the adjustments made by ADP, which was an average increase of 46,500 jobs over the previous two months, translate into the BLS report then we should expect a report on Friday of roughly 193,500.

The chart below shows the history of the ADP and BLS reports.  I have plugged in my estimate of 193,000 for the November BLS report.

ADP-BLS-NOV-Est-120413-2

Full-Time To Population
While a 193,000 job increase will certainly be a "good number" at the headline the reality is that it will likely be comprised of lower paying and temporary jobs, given the time of the year, rather than full-time employment.   Furthermore, the issue of population growth is completely obscured by these employment reports.  Each month the working age population has increased at a rate greater than employment.  This implies that job growth has been a function of the incremental demand increases caused by population growth rather than increases in organic demand that would lead to higher rates of employment, and subsequently wages, that would increase the labor force participation rate.

This is why the only real chart that matters with regards to employment, in my opinion, is full-time employment relative to the working age population.

Employment-Fulltime-population-120413

Full-time employment is what leads to greater household formations, increased demand and organic economic growth.  With full-time employment at the lowest levels since the early 80's it is really not so surprising "Main Street" is still struggling to make ends meet.

The BLS employment report for November is due out Friday morning at 8:30am EST.

See the original article >>

VIX extends longest gain since 2012 on Fed, budget concerns

By Nikolaj Gammeltoft

The benchmark gauge for U.S. stock options rose for a seventh straight day in the longest streak since April 2012 on concern over the timing of Federal Reserve stimulus cuts and the outcome of budget negotiations.

The Chicago Board Options Exchange Volatility Index, or VIX, gained 1 percent to 14.70 today and has risen 20 percent since Nov. 22 to reach a seven-week high. The index measures the cost of using options as insurance against losses in the Standard & Poor’s 500 Index, which has fallen 0.8 percent since a record high last week.

“You’re seeing volatility return to the marketplace,” Dominic Salvino, a specialist on the CBOE floor for Group One Trading, the primary market maker for VIX options, said in a phone interview. “The VIX had gotten awfully low and as the rally in stocks started to lose steam then people got a little worried and started to push prices up on S&P 500 options.”

Central-bank policy makers have been scrutinizing data to determine whether the economy is robust enough to withstand a reduction in their support. They cited during their last meeting lower government spending and budget standoffs as being among “several significant risks” that remained.

The VIX, which moves in the opposite direction of the S&P 500 about 80 percent of the time, reached 12.19 in November, 40 percent below the average reading of 20.21 since 1990 and close to its lowest level since 2007. While the gauge has lost 18 percent in 2013, the S&P 500 has surged 26 percent, poised for the best annual gain since 2003, as the Fed has refrained from reducing its monthly bond purchases.

‘More Volatility’

The S&P 500 briefly erased an early loss today as optimism grew that U.S. budget negotiators are near a deal that could avoid another government shutdown next year. Congress on Oct. 16 passed legislation funding the government through Jan. 15 as part of the agreement to end a partial shutdown, the first in 17 years.

“Expect a bit more volatility in the early part of the month with a bigger macro calendar, but keep in mind that December is known for its seasonal strength and that the performance-chasing tends to be stronger during the very good years,” Michael Purves, head of derivatives research at Weeden & Co., wrote in a note to clients yesterday.

December has been the second-best month for U.S. equity returns, according to data compiled by Bloomberg that starts in 1928. The average return for the month is 1.5 percent, more than twice the overall monthly mean of 0.6 percent.

See the original article >>

What Does It Take To Be Middle Class?

by Charles Hugh Smith

By standards of previous generations, the middle class has been stripmined of income, assets and purchasing power.

What does it take to be middle class nowadays? A recent paper, The Distribution of Household Income and the Middle Class, used Census data to discuss what sort of income it takes to qualify as middle class, but reached no firm conclusion: people tend to self-report that they belong to the middle class based on income, but income is not the only the metric--indeed, it can be argued that 12 other factors are more telling measures of middle class membership than income.

In Why the Middle Class Is Doomed (April 17, 2012) I listed five "threshold" characteristics of membership in the middle class:
1. Meaningful healthcare insurance
2. Significant equity (25%-50%) in a home or other real estate
3. Income/expenses that enable the household to save at least 6% of its income
4. Significant retirement funds: 401Ks, IRAs, etc.
5. The ability to service all debt and expenses over the medium-term if one of the primary household wage-earners lose their job
I then added a taken-for-granted sixth:

6. Reliable vehicles for each wage-earner
Author Chris Sullins suggested adding these additional thresholds:

7. If a household requires government assistance to maintain the family lifestyle, their Middle Class status is in doubt.
8. A percentage of non-paper, non-real estate hard assets such as family heirlooms, precious metals, tools, etc. that can be transferred to the next generation, i.e. generational wealth.
9. Ability to invest in offspring (education, extracurricular clubs/training, etc.).
10. Leisure time devoted to the maintenance of physical/spiritual/mental fitness.
Correspondent Mark G. recently suggested two more:

11. Continual accumulation of human and social capital (new skills, networks of collaborators, markets for one's services, etc.)
And the money shot:

12. Family ownership of income-producing assets such as rental properties, bonds, etc.
The key point of these thresholds is that propping up a precarious illusion of consumption and status signifiers does not qualify as middle class. To qualify as middle class (that is, what was considered middle class a generation or two ago), the household must actually own/control wealth that won't vanish if the investment bubble du jour pops, and won't be wiped out by a medical emergency.
In Chris's phrase, "They should be focusing resources on the next generation and passing on Generational Wealth" as opposed to "keeping up appearances" via aspirational consumption financed with debt.
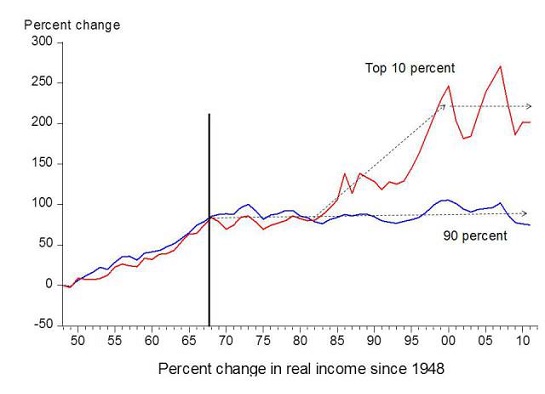
What does it take in the real world to qualify as middle class? Let's start by noting that real (adjusted for inflation) income has barely budged in 40 years, while household income has declined: Soaring Poverty Casts Spotlight on ‘Lost Decade’:

According to the Census figures, the median annual income for a male full-time, year-round worker in 2010 — $47,715 — was virtually unchanged, in 2010 dollars, from its level in 1973, when it was $49,065.Overall, median household income adjusted for inflation declined by 2.3 percent in 2010 from the previous year, to $49,445. That was 7 percent less than the peak of $53,252 in 1999.

Here is a chart of the real income of the lower 90% and the top 10%, which by definition cannot be "middle class":

The top 10% takes home 51% of all household income:


Here are my calculations based on our own expenses and those of our friends in urban America. We can quibble about details endlessly, so these are mid-range estimates. These reflect urban costs; rural towns/cities will naturally have significantly lower cost structures. Please make adjustments as suits your area or experience, but please recall that tens of millions of people live in high-cost left and right-coast cities, and millions more have high heating/cooling/commuting costs.
The wages of those employed by Corporate America or the government do not reflect the total cost of benefits. Self-employed people like myself pay the full costs of benefits, so let's "get real" and count *all* costs paid to maintain a middle-class lifestyle.
1. Healthcare. Let's budget $13,000 annually for healthcare insurance. Yes, if you're 23 years old and single, you will pay a lot less, so this is an average. If you're older (I'm 60), $13,000 a year only buys you and your spouse stripped down coverage: no eyewear, medication or dental coverage--and that's if your existing plan is grandfathered in. (If you want non-phantom ObamaCare coverage, i.e. a Gold plan, the cost zooms up to $2,000/month or $24,000 annually.)
Add in co-pays and out-of-pocket expenses, and the realistic annual total is between $15,000 and $20,000 annually: Your family's health care costs: $19,393 (this was before ACA).
Let's say $15,000 annually is about as low as you can reasonably expect to maintain middle class healthcare.
2. Home equity. Building home equity requires paying meaningful principal. Let's say a household has a 15-year mortgage so the principal payments are actually meaningfully adding to equity, unlike a 30-year mortgage. Let's say $5-$10,000 of $25,000 in annual mortgage payments is interest (deductible) and $15-$20,000 goes to principal reduction.
3. Savings. Anything less than $5,000 in annual savings is not very meaningful if college costs, co-pays for medical emergencies, etc. are being anticipated, and $10,000 is a more realistic number given the need to stockpile cash in the event of job loss or reduced hours/pay. So let's go with a minimum of $5,000 in cash savings annually.
4. Retirement. Let's assume $6,000 per wage earner per year, or $12,000 per household. That won't buy much of a retirement unless you start at age 25, and even then the return at current rates is so abysmal the nestegg won't grow faster than inflation unless you take horrendous risks (and win).
5. Vehicles. The AAA pegs the cost of each compact car at $6,700 annually, so $13K per year assumes two compacts each driven 15,000 miles. The cost declines for two paid-for, well-maintained clunkers. Average cost of auto ownership: $8,946 per year. let's assume a scrimp-and-save household who manages to operate and insure two vehicles for $10,000 annually.
6. Taxes. Self-employed people pay full freight Social Security and Medicare taxes: 15.3% of all net income, starting with dollar one and going up to $113,700 for SSA. Since an adjusted gross income (AGI) of $66,193 or more puts you in the top 25% of earners, let's use a base income (self-employed) of $68,000 to calculate our SSA/Medicare taxes: that's about $10,000 annually.
Property taxes: These are low in many parts of the country, but let's assume a New Jersey/New York/California level of property tax: $10,000 annually.
Income tax: Since the mortgage interest is only $5-$10K a year, itemized deductions are less than the standard deductions of around $18,000. One-half of the self-employment tax is deductible, as well as the health insurance and IRA retirement contributions, so that's another $30,000 in deductions. That leaves about $20,000 in taxable income and about $3,000 in Federal tax, and let's assume $2,000 in state and local taxes for a total of $5,000.
7. Living expenses: Some people spend hundreds of dollars on food each week, others considerably less. Let's assume a two-adult household will need at least $12,000 annually for food, utilities, phone service, Internet, home maintenance, clothing, furnishings, books, films, etc., while those who like to dine out often, take week-ends away for skiing or equivalent will need more like $20,000.
8. Donations, church tithes, community organizations, adult education, hobbies, etc.: Let's say $2,000 annually at a minimum.
Note that this does not include the cost of maintaining boats, RVs, pools, etc., or the cost of an annual vacation.
Here's the annual summary:

Healthcare: $15,000
Mortgage: $25,000
Savings: $5,000
Retirement: $12,000
Vehicles: $10,000
Property taxes: $10,000
Other taxes: $15,000
Living expenses: $12,000
Other: $2,000
Total: $106,000

Oops. That's more than double the median household income. OK, let's assume the mortgage is a bit high, ditto the property taxes. Let's say we need "only" $96,000.
Oops again: our tax calculations were based on $68,000 in self-employed net earnings. To earn $96,000, our taxes are going to skyrocket, as we're still paying the full 15.3% SSA/Medicare taxes while we'll jump into the 25% tax bracket when our taxable income exceeds $35,000. Since we'll be paying at least $15,000 more in SSA and income taxes, then we're up to $111,000 as the minimum household income to maintain a middle class lifestyle for two self-employed adults.
An individual earning $111,000 is in the top 10% of all wage earners. A household earning $111,000 is in the 80%-90% income bracket--the lower half of the top 20%. This suggests that the "middle class" has atrophied into the 10% of households just below the top 10%. Households in the "bottom 80%" are lacking essential attributes of a middle class lifestyle that was once affordable on a much more modest income.
Note that this $111,000 household income has no budget for lavish vacations, boats, weekends spent skiing, etc., nor does it budget for luxury vehicles, SUVs, large pickup trucks, etc. There is no budget for private schooling. Most of the family income goes to the mortgage, taxes and healthcare. Savings are modest, along with living expenses and retirement contributions. This is a barebones budget.

If costs had stagnated along with wages, it would take a lot less to maintain a middle class lifestyle. But costs for most middle class essentials have skyrocketed. I was struck by something I read recently in a history of the Tang Dynasty in China, circa 700-900 A.D. When costs are cheap, goods and trade are abundant and prosperity is widely distributed. Once costs rise, trade declines and living standards stagnate. Poverty and unrest rise.
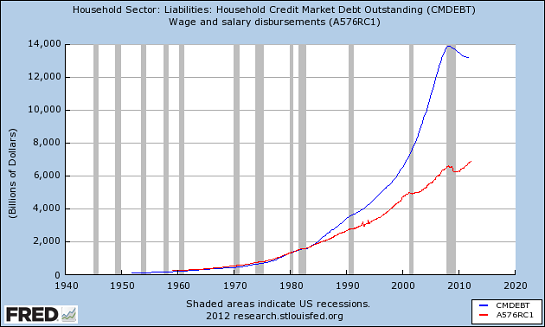
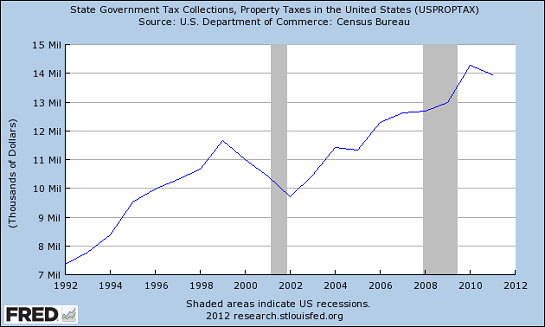
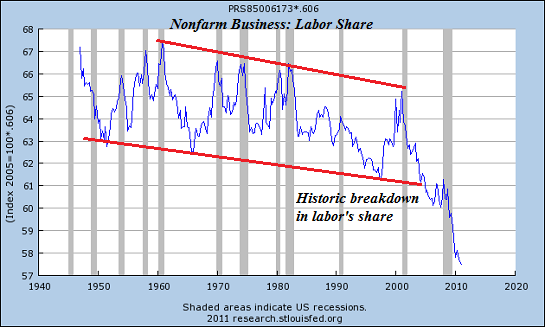
Here are a few charts that illustrate the pressures on the middle class:
Wages have risen modestly while debt has increased enormously.

Social Security taxes have skyrocketed:

So have property taxes: they rose right through the last recession even as property values tanked:

Labor's share of national income has plummeted:

Interest income has fallen through the floor (thank you, Federal Reserve):

The bedrock of Main Street, small business, has cratered:

Net worth of the middle income households has been reduced to a sliver:


As costs have risen faster than incomes for decades, households have been priced out of the middle class. By standards of previous generations, the middle class has been stripmined of income, assets and purchasing power.

See the original article >>

Playing Another Hand of Existential Poker

by Marketanthropology

"Do the times make the man - or does the man make the times?"

If we're reading the rules correctly, at this point in this existential zero sum game of disinflation, deflation and reflation - both Xi's manifesto and Bernanke and Yellen's taper talk - trump Shinzo's Abenomics.

For those not following at home:

  • The dollar has historically declined when the Fed moves to constrict extraordinary monetary policies.
  • Japan has tangentially expedited disinflationary trends overseas in the past year through a weakened yen. We expect that trend to reverse. 
  • China is breaking out of its long-term consolidating range. World-wide growth should accelerate, as well as broader reflationary trends.
  • Commodities, commodity currencies and emerging markets should benefit disproportionately from China's reemergence.
Generally speaking, while we recognize the significance of having a commanding face to the story,  we're more in the, "Times make the man" camp. With that said, we're happy to report our better half's will soon be represented at the monetary pulpit, but will also likely receive both unwarranted praise and criticism. 

Hopefully for Dr. Yellen she get's the Volcker treatment.

See the original article >>

Stronger world sugar demand 'here to stay'

by Agrimoney.com

Czarnikow, which three months ago shook up the sugar market by pegging demand well above market estimates, hardened its stance, saying consumption growth may remain at higher rates.

Growth in global sugar demand, which average more than 3% in the five years to 2008, had slowed to 1% three years later – a major factor in dragging New York futures down from a 30-year high of 36.08 cents a pound reached in February 2011.

The average growth rate in sugar consumption in 2009-11 was just 1.3% a year – not much faster than world population growth which is a big driver of baseline demand.

However, this slowdown may prove a temporary hiccup, caused by the world economic slowdown and the elevated sugar prices – both of which have reversed.

'Trigger of civil disturbances'

"The global financial crisis was detrimental to consumption growth rates as economic growth slowed, but in sugar the effect was even more acute as the market entered a three-year period of production deficits and high prices," the London-based group said.

"This impacted on supply chains. In North Africa a shortage in the availability of essential commodities, including sugar, became a trigger leading to civil disturbances and the events of the Arab Spring."

However, with prices lower, and population growth alone adding nearly 2m tonnes a year to sugar consumption, "we remain confidence that the long-term outlook for demand remains positive", Czarnikow said.

"We will see a rebound in growth rates at current lower prices."

Price implications

This acceleration would appear in fact to imply support to sugar values, given their low level compared with production costs, although Czarnikow stopped short of making a price forecast.

Toby Cohen, Czarnikow director said: "With consumption growth proving robust and the world market moving back towards equilibrium the market needs to sustain production and cover total production costs as well as pay a return to shareholders.

"This remains a challenge."

Worst hit regions

The extent of the 2009-11 slowdown in consumption growth had been evident in particular in Asia, the Middle East and North Africa, the merchant added.

In Asia, the annual growth fell from a rate of 4.7%, in the decade up to 2008, to 1.5%.

In the Middle East, growth fell from around 3.6% to less than 1%.

"Had consumption continued to grow at the rates experienced from 2000-08 in these two regions alone, consumption in 2013 would today be 11m tonnes higher than it is today."

See the original article >>

Robusta coffee supply squeeze faces double attack

by Agrimoney.com

The squeeze on robusta coffee supplies which has lifted prices to three-month high may not last for long, given the pressure on Vietnamese growers to sell down a record harvest, and an increase in Brazilian exports due early next year too.

Robusta coffee futures on Wednesday hit £1,779 a tonne in London, for January delivery, up 26% from a three-year low reached in early November.

The price gains have been supported by a drop in supplies on international markets prompted by a decision by producers in Vietnam, the top-ranked robusta producing country, and Indonesia to hold back on shipments.

Stocks certified for delivery against London futures "have fallen dramatically from over 5m bags in November 2011 to just 766,000 tonnes in November 2013", the International Coffee Organization said in a report on Thursday.

'Exports will remain strong'

However, that discipline looks unlikely to last for long, given the strength of Vietnam's ongoing harvest, which the US Department of Agriculture bureau in Hanoi upgraded to 29.0m tonnes, in line with market expectations, but 4.2m tonnes above the department's official estimate.

"Given record production, exportable supplies will also be high," the bureau said, highlighting "limited storage capacity throughout the green coffee bean value chain".

"Despite falling prices domestically and internationally, Vietnamese coffee exports will remain strong."

The bureau raised its estimate for Vietnamese shipments in 2013-14 to 25m bags, also a record.

That is equivalent to more than 2m bags a month – representing a sharp pick-up from the 100,000 tonnes (1.33m bags) recorded in October, the first month of the marketing year.

However, Vietnam is capable of exports well above that level, with volumes in February last year reaching 168,000 tonnes.

Brazilian squeeze

Meanwhile, Brazil - which produces mainly arabica beans, but is a substantial robusta grower too - is also offering a further hope to robusta buyers, with its own hold-out against sales also likely to wane.

"Robusta coffee prices are soaring in the Brazilian market, recovering part of losses registered over the last month," Cepea, the market research centre linked to Sao Paolo University, said.

The price of benchmark type 6 robusta coffee rise 15% to 214.54 reais ($91.84) per bag last month, encouraged by a reluctance by growers to sell into a rising market.

Sellers may remain "refrained" in sales, "waiting for new price rises", Cepea added, quoting conversations with market "players".

However, a "higher volume of coffee may flow from the first months of 2014 on".

In London, robusta coffee futures for January stood at $1,704 a tonne in lunchtime deals, up 0.4% on the day.

See the original article >>

Natural Gas breaks out…. after creating bullish wicks on Fib support!

by Chris Kimble

CLICK ON CHART TO ENLARGE

Natural Gas created bullish wicks at rising channel support & key Fibonacci levels at (1) in the chart above, both were positive and bullish.

See the original article >>

Hogs face odd problem, and cattle has bullish bias

By Rich Nelson

Hogs: The hog market has a peculiar problem right now: a regular slaughter level. Instead of packers scrambling to find a single hog alive right now, their phone is ringing with more than adequate supplies. As it stands, this week’s kill is running a full 1.6% over last year. This is a tough issue to swallow when all the trade has heard about for months was how bad the PED issue would hit in December. Keep in mind there were well-known analysts discussing a 2% to 5% year over year decline in hog slaughter right now.

While we could write quite a bit about this issue, it will all be review. We have said very clearly before that trading hogs right now is no more than a 50/50 proposition. With USDA’s September HP survey and no clear way to map out potential PED slaughter impacts, we don’t have any special ability to forecast prices. IF there was no PED we have previously stated December would be at $84. If there is PED to the level we had suspected then $88 is the number. For other trades, that we have discussed but not enacted, we still like the June/February spread or just selling February. Without a good idea on potential production, we will not jump on those trades.

Cattle: Cattle country is still talking about steady to possibly higher trade for this week’s cash action. Last week’s packer purchase, at higher prices, has reignited some bullish momentum. While we are bullish on this market, for a peak expected in February or March, this market is not yet in the middle of this supply problem. It is only just entering this tight supply period. This may explain why we make good gains then see some setbacks here.

Additionally, the trade is also watching weather closely. Given that there are typically one or two storms in the Plains each winter that get the trade’s interest, many are suggesting it is only a matter of time.

While Allendale remains raging bulls for this market, the question here is squarely on demand. Wholesale beef hit $200 for two separate weeks in November but has not been able to post a weekly close clearly above that mark. This psychological resistance will remain until our supply argument is traded.

See the original article >>

The Complete And Unabridged History Of Gold Manipulation

by Tyler Durden

On November 1st, 1961, an agreement was reached between the central banks of the United States and seven European countries to cooperate in achieving a shared, and very clearly stated, aim.

The agreement became known as the London Gold Pool, and it had a very explicit purpose: to keep the price of gold suppressed “under control” and pegged regulated at $35/oz. through interventions in the London gold market whenever the price got to be a little... frisky.

The construct was a simple one.

The eight central banks would all chip in an amount of gold to the initial “kitty.” Then they would sell enough of the pooled gold to cap any price rises and then replace that which they had been forced to sell on any subsequent weakness.

*Statement is subject to standard terms and conditions and is not necessarily reflective of any evidence. Government entities are excluded from inclusion based on the fact that we can't really do anything about them and anyway; they could put us out of business; and it would make things really, really bad for them. Also, bullion banks are not covered under this statement because we were told to turn a blind eye; but individual investors are, and we can categorically confirm that, to the best of our knowledge, no individuals are manipulating the precious metals markets (at this time).

But, as Grant Williams explains in this excellent and complete summary of the history of Gold price manipulation, things don't always go as planned...

Human beings, when given means and motive, have rather a poor history of eschewing the easy profit in favour of doing the right thing. Governments, when faced with dilemmas, have a rather poor history of doing the right thing as opposed to whatever they think they need to do in order to cling to power. It's quite simple.

Libor, FX rates, and mortgages trades are all fiat in nature. The contracts that are exchanged have no tangible value. (Yes, technically speaking, mortgages have houses underneath them, but the houses are so far down the securitization chain as to be invisible). Such contracts can be created at the push of a button or the stroke of a pen and manipulated easily right up until the point where they can't.

Gold is a different beast altogether.

The manipulation of the gold price takes place in a paper market — away from the physical supply of the metal itself. That metal trades on a premium to the futures contract for a very good reason: it has real, intrinsic value, unlike its paper nemesis.

If you want to manipulate the price of a paper futures contract lower, you simply sell that paper. Sell it long, sell it short, it doesn't matter — it is a forward promise. You can always roll it over at a later date or cover it back at a profit if the price moves lower in the interim.

And of course you can do it on margin.

If the trading were actually in the metal itself, then in order to weaken the price you would have to continue to find more physical metal in order to continue selling; and, as is welldocumented, there just isn't so much of it around: in recent years what little there is has been pouring into the sorts of places from which it doesn't come back — not at these price levels, anyway.

The London Gold Pool had one thing in common with the rigging of the FX, Libor, and mortgage markets: it worked until it didn't.

The London Gold Pool proved that central banks can collude cooperate to rig maintain the price of gold at what they deem manageable levels, but it also proved that at some point the pressure exerted by market forces to restore the natural order of things becomes overwhelming, and even the strongest cartels groups (whose interests happen to be aligned) — which are made up of the very institutions granted the power to create money out of thin air — can't fight the battle any longer.

...The problem now is that currently there are almost 70 claims on every ounce of gold in the COMEX warehouse and serious doubts about the physical metal available for delivery at the LBMA.

Which leads us to today...

The London Gold Pool was designed to keep the price of gold capped in an era when the world's reserve currency had a tangible backing. In defending the price, the eight members of the Pool were forced to sell way more gold than they had initially contributed in order to keep the price from going where it desperately wanted to go — higher.

This time around, the need for the price to be capped has nothing to do with any kind of gold standard and everything to do with the defense of the fractional reserve gold lending system, about which I have written and spoken many times.

Gold is moving to ever stronger hands, and when the dam does inevitably break again, the true price will be discovered by natural market forces, free of interference.

This time, however, those chasing what little gold is available will include all those central banks that have kept their holdings "safe" in overseas vaults.

The Bundesbank has seen the writing on the wall and demanded its gold back. They were told it would take seven years before their 30 tonnes could be returned to them.

My guess is, this little scheme doesn't have seven years left to play out.

Everybody outta the pool!

Full Grant Williams letter here:

TTMYGH Twisted (by the Pool)

TTMYGH Twisted (by the Pool)

See the original article >>

The Last Two Times This Happened, Things Didn't End Well

by Tyler Durden

With the almost extinction of 'bears' we noted last week, the bull-bear index has now crossed the Rubicon into a euphoria mode that marked the turning point before the last 2 major corrections in the US equity market. Of course, we are sure, this time is different; but hasn't the Fed 'always' had our back? Perhaps, as GenRe's CIO notes, "gravity will win," after all?

Shrugging that off... this has happened 15 times in the last 24 years with stocks falling 79% of the time in the following 3 months...

h/t @Not_Jim_Cramer

See the original article >>

Follow Us