Monday, June 24, 2013

Technical Analysis of the Natural Gas Market

By EconMatters

Near-term Double Top

Natural Gas closed Friday at $3.35 per mmBtu and has been on a three month downtrend from the $4 level where it put in a near-term double top in October and November of 2012.

This was your classic short setup, as NG bottomed in March of 2012 from the prolonged downtrend to test just how low prices could go, it then had to test the upside, where the top of the near-term range would be. This turned out to be an eight month process with a definable trend upward until the nice large number that $4 represents for resistance.

It couldn`t bust through this level, pulled back to previous resistance around $3.60, and made another run at breaking the $4 barrier, it failed putting in the classic double top, profits were taken and the shorts piled into the market, leading NG to break the $3.60 level and confirm the break of the uptrend channel.

Downtrend or Parallel Channel

Natural gas is technically still in a down trending channel if you draw a line from the top at $4 to the higher lows established at $3.67, and so on based upon the three month time frame.

However, if we look at the eleven month time frame Natural Gas has mainly been in a tight parallel trading range between $3.20 on the downside support and $3.60 upside resistance for the most part - with the exception of the three month dual try to continue the trend higher ( $3.60-$4.00).

So depending upon the time frame natural gas is either in a distinct downtrend channel or a parallel trading range.

Key Technical Support Levels

There is strong support at $3.20 as we basically have found it hard to close below this technical level for ten months. Therefore, any close below $3.20 would be significant and the shorts would take notice of this technical break. The next level of Support would be the round fat target of $3.00, and if this fails to hold then the momentum will gain, and $2.50 is possible.

This level of support should provide substantial incentive for buyers to step in on rigs shutting down production talk, but as we have seen before because some of the derivative products from the natural gas extraction process are highly profitable, production often continues at natural gas prices lower than otherwise profitable.

So the caveat here is that $1.90 is the last level of support that held after considerable effort to find that bottom. Ergo, it is conceivable that $2.50 could break, and the $2.00 level is in play all over again. I think it is a low percentage probability that we ever experience prices that low again as there was a lot of momentum on that move down to find the bottom.

However, one of the consequences of increased US oil production is that Natural Gas gets derivatively produced, and Oil prices are high; this results in more natural gas despite lower prices and the potential for Natural Gas only production rigs being shut-in.

Is the Natural Gas Market becoming “Intel Boring”?

The Natural Gas market loves to trend in channels that go on for months despite the fundamentals of the supply and demand equation. The market will be looking for a channel to cling to for a sustained run of 5, 7 and 11 months if possible. This is just how the commodity trades if at all possible.

But right now the economy is performing slightly better, there is increased manufacturing looking to take advantage of cheap Natural Gas, so I think the downside moves are limited. And regarding the upside, there is an over-abundance of supply, so until a robust export market comes into existence, prices to the upside seem capped as well.

As a result, the most likely outcome for Natural Gas is to stay in a relatively tight trading range between $3.00 and $4.00 for the bulk of the price discovery process.

See the original article >>

Stocks Bear Market Focus Point: Are You Ready to Weather the Coming Storm?

By: Garry_Abeshouse

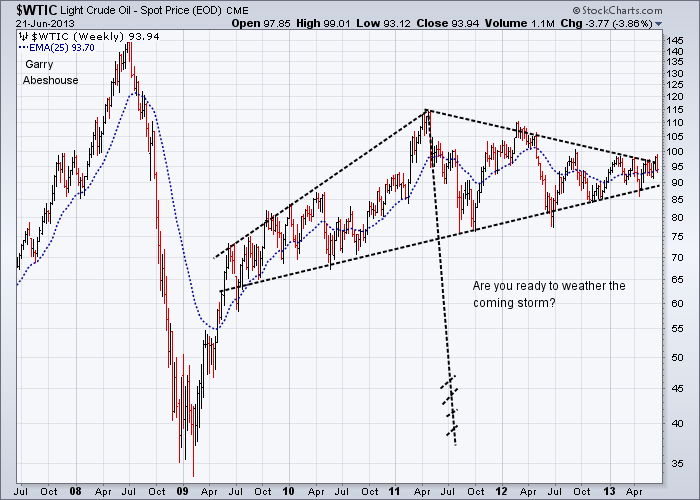
Are you ready to weather the coming storm?
It is a truism that financial markets tend to rise into ever greater expectations and to peak when optimism can rise no further. But when a market can rise no higher, “A” peak becomes “THE” peak and once reached the only way left is down. The only conclusion I can come to as to why equities (but not all equities) are so high, is that the majority of market traders (you notice I do not use the term “investors” any more) must be by definition, “True Believers” in the one and only true “Gospel of the Perpetual Rising Market”, where fantasy triumphs over reason. In this fantasy world the fiction of bullish forward P/E Ratios will always triumph over the realities of the living world, because as we all know the one true God resides, not in heaven, but in Wall Street. But Bull Markets if nothing else are ephemeral beasts, so beware of the coming storm.


National economies and financial markets have been peaking sequentially for many years.
Global GDP has certainly peaked. Gold, Silver and Industrial metal prices have also peaked. Most currencies have peaked against the USD. Equity markets have been sequentially peaking over the last 13 years or more, but have yet to utter the final gasp of the economic endgame. Although the large number of index and stock price failures now apparent on charts, does suggest this time is edging closer. And lastly oil is only up where it is because the major oil companies want to keep the retail price as high as possible as long as possible and stuff the consumers. In Australia they have even got the major supermarket retailers, Woolworths and Coles, helping them do this, while they place an added profit margin to the final price, all the while giving out fake discounts on their supermarket receipts. 
Currency markets, skittish in the increasingly risk averse conditions are falling against the USD in rapid succession in a race to be more competitive in a world, where overall consumption is declining, long term unemployment is going through the roof and large corporations like BHP and Rio are preparing for the perceived lean years ahead.
The over concentration of media attention on a small number of US composite indices such as the Dow 30 industrials and the S&P500 Large Cap index has both distorted and underplayed many underlying weaknesses in equity markets across the world. Some people inside the borders of the USA may think they are still the centre of the universe, but there are many others elsewhere, who would disagree. if you are like me and accept that equities are in a multiyear top, it becomes far more logical to accept that equities will top out sequentially over time rather than all at once. If you check a range of long term carts, you will see that this has indeed been the case.
The Bernanke Effect
On both May 22nd 2013 and on June 18th 2013 the Bernanke Effect took hold causing stock market falls from market peaks at both these times. To date nothing much that Bernanke has said could be seen to be set in concrete. In fact, all he had to do was to imply that given certain conditions he may or may not halt the current quantitative easing program, incorporating the selling of long dated bonds. Part of the 2013 version of this Bernanke Effect has been the carefully chosen timing of press offerings, so as to create maximum uncertainty in the financial markets.
The 2013 twist to this process was the fact that the four weeks in between these two dates also coincided with the lengthy and convoluted changeover in the Futures markets from June to September trading. Bernanke would have known this. He also would have known that the prevailing superstition in equity markets of “sell in May and go away!” would also be present. He would have been well aware that equities and other currencies were really only edging up weakly and extremely sensitive to sharp rises and falls, mainly based on pre and post-holiday and long and short covering, rather than a commitment to any one direction. 
As I watched this unfold I noticed what appeared to be a bottom in the USD exactly on the day I chose to change my June USD chart over to September. Brilliantly played Bernanke. He really did nothing at all, but he still managed to stop the rise in equities. But not all equities have been rising into new highs over the last six months.
For instance:
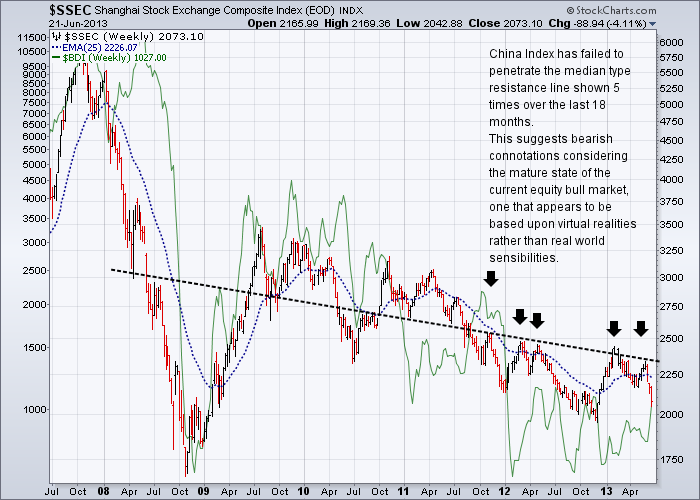
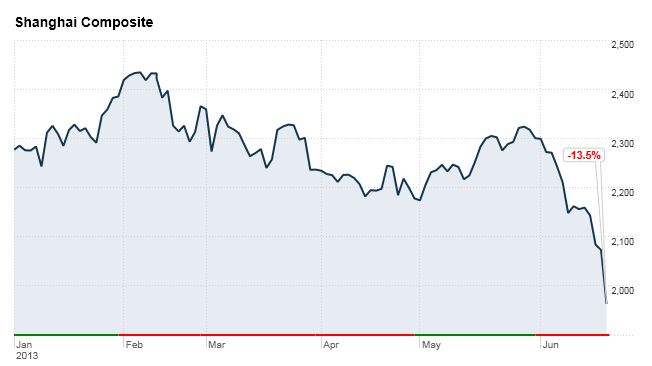
The main China index peaked post GFC in August 2009, while the Baltic Dry Index formed the last of a triple peak in May 2010.

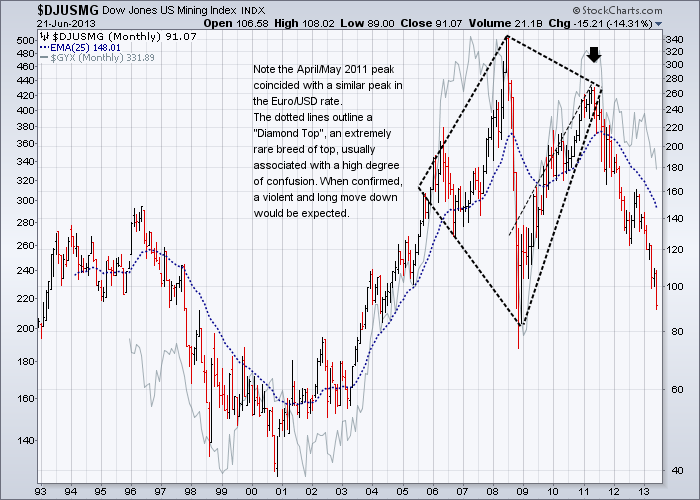
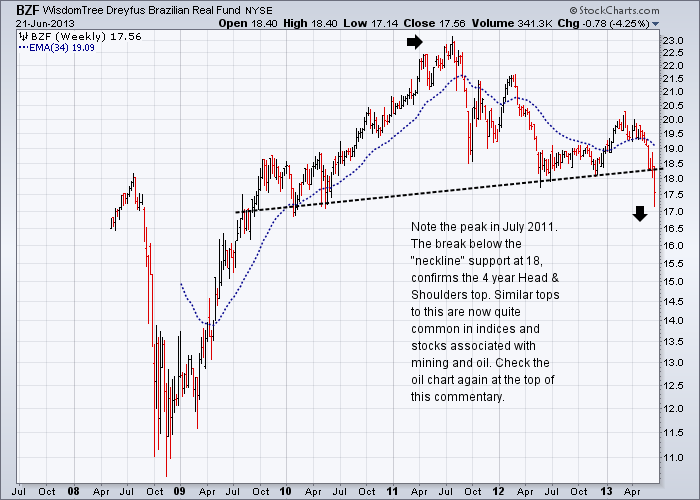
Both the DJ Mining Index and the S&P Industrial Metals Spot Index peaked in April/May 2011. For the DJ Mining Index a testing of the 2001 lows appears to be a likely prospect. The first markers for global industrial growth to rise or fall have always been industrial metal prices and mining stock prices. The bean counters working for the large mutual and hedge funds do their stuff and make their decisions and these decisions show up as buying or selling in the charts. The chart below, along with gold as deflation barometers, have always been on top of my list, and they did not let me down. Even the text books do not show a chart as neat as this one.

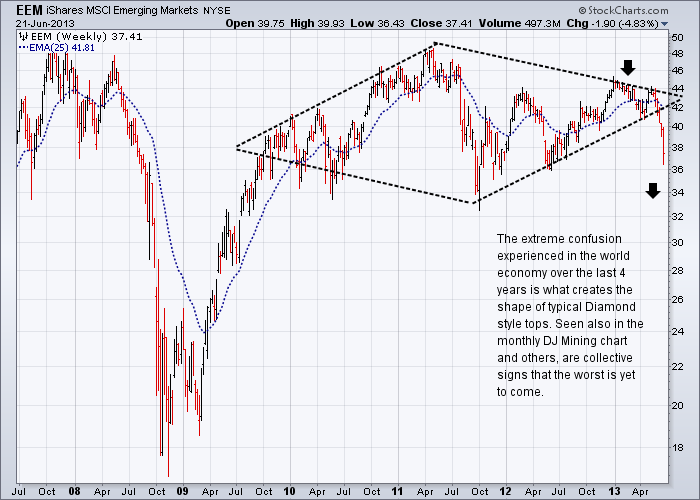
The downturn in world GDP and the problems in Europe did not go entirely unnoticed, with the Emerging Markets ETF peaking in May 2011 and then again in late December 2012. Also a chart for the text books.


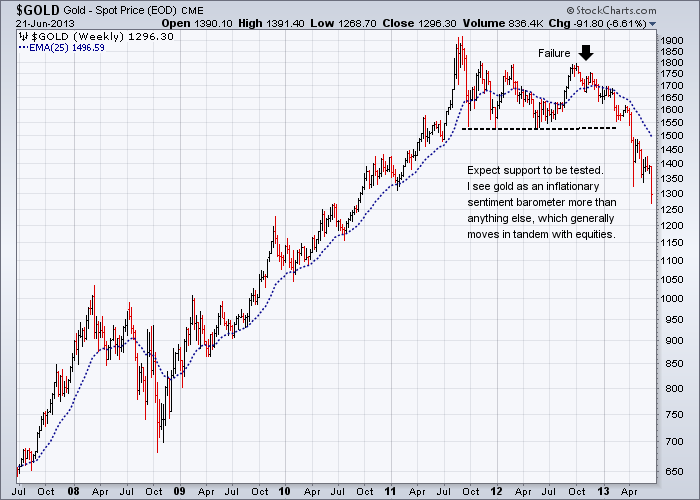
Most of the financial analysts have been wrong on gold in much the same way as economists rarely pick major market downturns accurately – as per 2007/2008.
Gold peaked in September 2011 and as my reader would have been well aware, I have been bearish on gold for quite some time now, although I expected general equity weakness to be the downside trigger rather than a manipulated Flash Crash. (Inserted chart commentary taken from private newsletter, late February 2013).
As mainstream equities have yet to fall, it appears that gold may go a lot lower over the longer term, than the 1100 target I mentioned back in March.

And as Bloomberg pointed out on April 25th:
“Central banks bought the most gold since 1964 last year just before the collapse in prices into a bear market underscored investors’ weakening faith in the world’s traditional store of value. Nations from Colombia to Greece to South Africa bought gold as prices rose for an 11th year in 2011, highlighting the reversal of a three-decade-long bout of selling that diminished the world’s biggest bullion hoard by 19 percent. The World Gold Council says they added 534.6 metric tons to reserves in 2012, the most in almost a half century, and expects purchases of 450 to 550 tons this year, valued now at as much as $25.3 billion.

Central banks are the biggest losers, with about $560 billion of value erased since gold reached a record $1,921.15 an ounce in September 2011. The metal was already in the eighth year of its longest bull market since the end of World War I when reserves started expanding again in 2008. They were also buying in 1980 when bullion peaked at the equivalent of $2,400 in today’s money, and selling in 1999 as prices slumped to a 20- year low.”

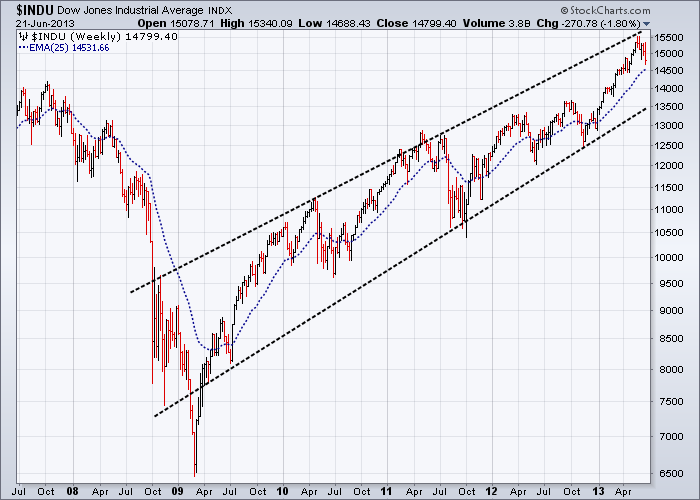
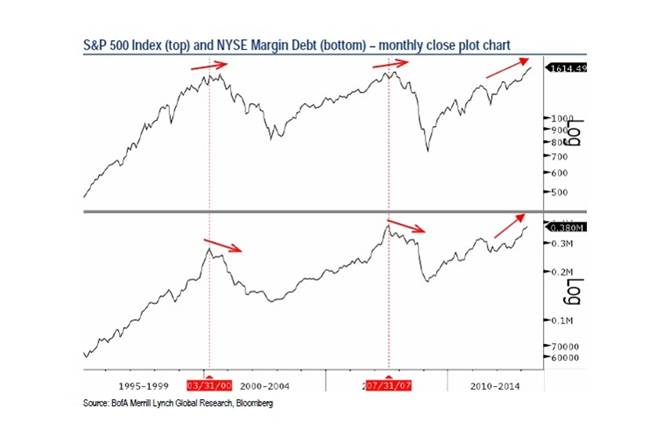
As you can see below, the DJ 30 industrials Index, aided and abetted by an enthusiastic media, continued to rise over the last three months, to eventually peak on June 18th this year. This rise occurred despite the many signs that caution should be the order of the day. Bearish markers ignored include the sequential topping out of much of the long term economic data in western countries, and bearish markers in the equity charts, appear to have simply been ignored.

This rise in equities was also associated with constant media coverage of financial market manipulations on a massive scale, continuing deteriorating economic data, together with increasing unemployment and social unrest at historically high levels across the world.

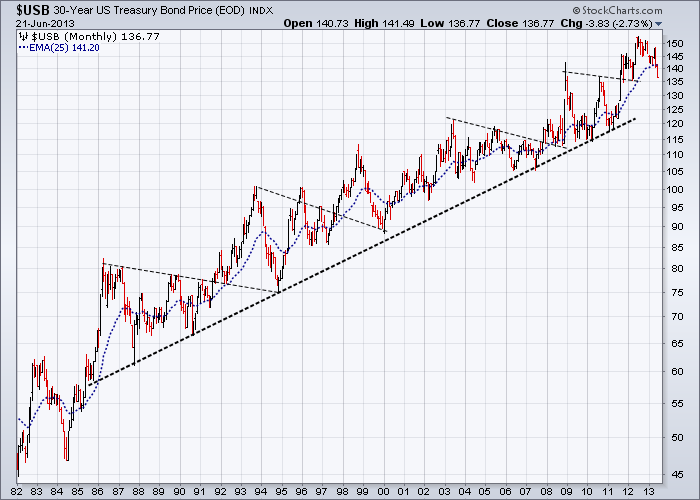
On the other hand US Treasury Bonds were in a long term bull market way before Bernanke decided to begin his quantitative easing programs. And as you can see from the 50 year chart below, they have an unnerving habit of falling into a Bear Trap, just prior to instigating another strong upward move. So do not write off US Government bonds just yet.

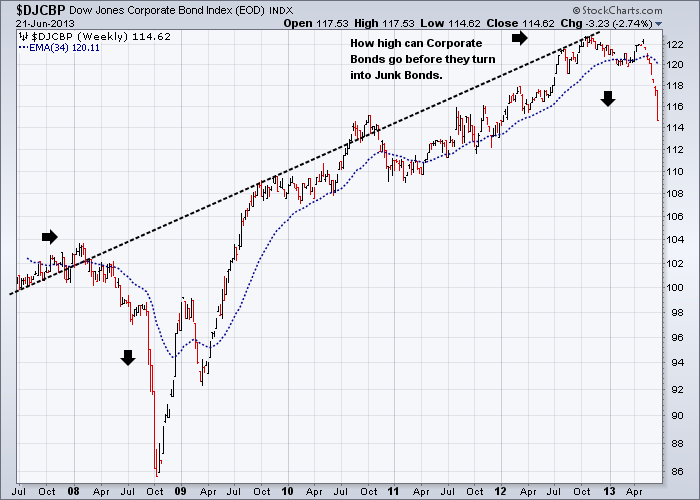
On the other hand Corporate Bonds are a different story indeed – especially as the only protection they have is over optimistic P/E Ratios. I anticipate that Municipal Bonds will go the same way as Corporate Bonds. Down.

“The warnings are out there, but no one is listening, they just don’t want to know.”
Is it only me, but is there something incongruous in seeing the margin debt of Wall Street gamblers at 2007/2008 levels, as WSJ reported on May 6th:
“High levels of margin debt on the New York Stock Exchange are raising concerns about the state of the rally. Stephen Suttmeier, technical research analyst at Bank of America BAC -1.55% Merrill Lynch, notes leverage, as measured by NYSE margin debt, rose 28% in March from a year ago to $380 billion. That figure is slightly below the July 2007 peak of $381 billion.”

This high level of margin debt is made doubly dangerous with the current high level of commitment to equities in a market where even the bears are really closet Bulls, expecting only a minor correction at worst.
Bloomberg reported on April 14th that the top 50 managed funds in the USA owned “Regulatory Assets” totalling $1,347,441,287,144 for first quarter 2013. This is compared to the average daily NYSE Group Volume in All Stocks Traded for May 2013 as being 1.445 trillion shares per day. I could not find what that meant in actual dollar value. But I am sure you will get the picture of what the NYSE would look like if everyone tried to sell at once.

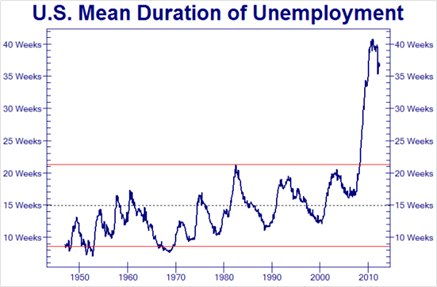
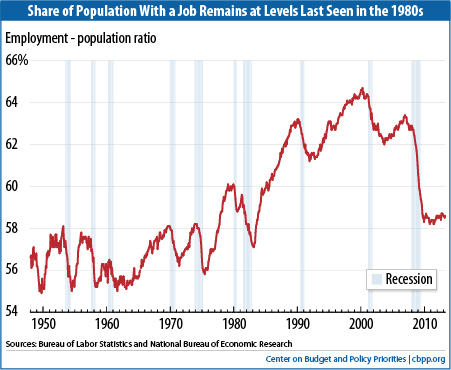
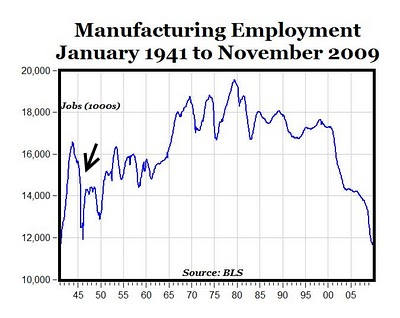
All this while a record number of people are trying unsuccessfully to find a job:


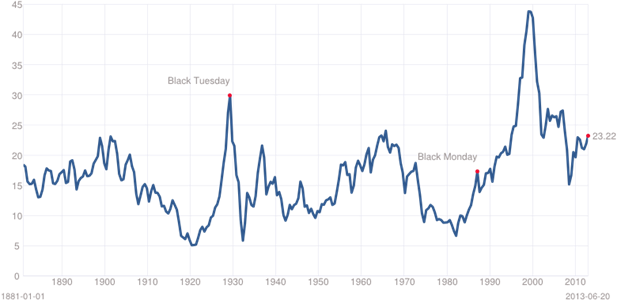
Each time over the last 133 years the Shiller P/E Ratio reached 23 (has already been over 24), it has preceded a major market downturn.

Dancing in the rain with vampire apples and banker psychopaths.
We live in an age of disbelief, where purveyors of spin spruce their wares as if there is no tomorrow and as if the past has given them no lessons to learn or reasons to learn them. And what use is the rule of law when our peers in the financial sector repeatedly thumb their noses at the rest of us, while they criminally take advantage of weaknesses in a dysfunctional and poorly policed financial system. Some of our financial elders such as George Soros, Jeremy Grantham, Gary Shiller and Robert Prechter, ever conscious of historical precedent, show a high degree of concern for the future and for good reason.
There is growing frustration and unease, with the inability of governments to confront economic inequalities and the rampant criminality and corruption in the banks, all well documented by the likes of Matt Taibbi from Rolling Stone magazine and others. The blatant “up yours style” of corporate tax evasion utilised by the likes of Apple, boggling the mind in its complexity, has been given comprehensive media coverage as well. 
Underlining the highly emotional and unstable status of equity markets today is the sad but true fact that they are now resting not so safely in the soft young hands of a small number of hyperactive “20 to 30 something” traders. These individuals, working for desperate hedge funds trying to turn a profit, have been able to temporarily defy gravity by pushing up equity markets to the extent that many stocks and indices are now looking down onto the 2007/2008 highs. I anticipate that a combination of desperation to buy “higher yield” for clients in an emotional and low volume market, will almost certainly increase the susceptibility of these markets to experience more dramatic “flash crashes” and so called “Black Swan” events over the coming months. In this situation “high yield” can turn into a “major capital loss” in the blink of a “flash crash” at any time.
This view was validated on Thursday June 20th – as the FT comments:
“Bond market sell-off causes stress in $2tn ETF industry”
“Tim Coyne, global head of ETF capital markets at State Street, who said his company had contacted participants “to say we were not going to do any cash redemptions today”. But he added that redemptions “in kind” were still taking place.

Market participants described the heavy volumes and losses on Thursday as a rare occurrence and said that it could translate into further selling on Friday or early next week.

“The losses for ETFs today were far beyond what the most sophisticated financial risk models could have predicated for worst-case scenarios,” said Bryce James, president of Smart Portfolio, which provides ETF asset allocation models. He added: “The falls violated risk tolerance levels for many investors and if they were leveraged at all they are likely facing capital calls.”

Goldman Sachs makes second hand car salesmen look like highly respected pillars of society.
In stark contrast to the high risk takers in today’s markets, we have the sober assessments of elder statesmen and massive data crunchers such as Jeremy Grantham and Gary Shiller suggesting that equity markets are probably overvalued if we use the more conservative rear view style P/E ratios (see the chart above), which have been until recently sitting at around 19 (S&P) to 24 (Shiller). This should be seen against the view of the rather aggressive marketing entrepreneurs from Goldman Sachs, using the narrowest of terms of reference, who suggested recently, that despite the never ending down grading of economic statistics, forward P/E Ratios should be the way to go, enabling equity markets to continue rising well into 2015:
Courtesy of ZeroHedge on May 21st 2013, "Our earnings estimates remain unchanged but we raise our dividend estimates and index return forecasts for 2013 through 2015. We expect S&P 500 will rise by 5% to 1750 by year-end 2013, advance by 9% to 1900 in 2014, and climb by 10% to 2100 in 2015.” I kid you not, this is a real quote from GS’s report.
The consequences of a strengthening USD
Further financial dislocation will be exacerbated by USD denominated debt in a world where almost all currencies will fall against the USD over the coming months. In my work, I have begun to look at a possible future scenario of how a continuing slowdown in global GDP, combining with and exacerbated by a fall in oil and metal prices and a fall in global equities will impact harder on nations with net debt exposures denominated in USDs. A global trade war threatens, as nations set about devaluing their currencies when they can, in order to improve their export position, with Japan being the most aggressive to date. All these factors taken together are an explosive force that has the capacity to change a nation’s balance of payments from black to red almost overnight. 
As I have also mentioned many times over the last four years, regardless of what you think about the USA or its debt, the USD has been in a base for many years and is still, whether you like it not THE major currency on this planet and still the currency of choice during “risk on” economic conditions. A rising USD over the coming months and years will make it inevitable, that countries with USD denominated debt, will quickly find themselves facing much higher and unforseen debt servicing requirements. My interpretation of the financial markets is that few are anticipating a substantial rise in the USD or a protracted fall in equities that will eventually force many national number crunchers to make rapid changes to their servicing requirements.
A side issue concerning those who wish to follow the USD on charts, is that the old USD Index is heavily weighted towards the Euro (57.6%). In a world where other currencies are now increasingly dominating the financial landscape and where there is a race to devalue to retain a competitive edge (note the recent devaluation of the yen), the value of this index as a means of ascertaining USD strength needs to be questioned. I have found that consistently over the last few months, charting signals on the bullish side have been both late and often misleading, while support and resistance areas have reduced significance compared to the good old days of old, when we only had to worry about the Euro:USD relationship. Be your own judge.    

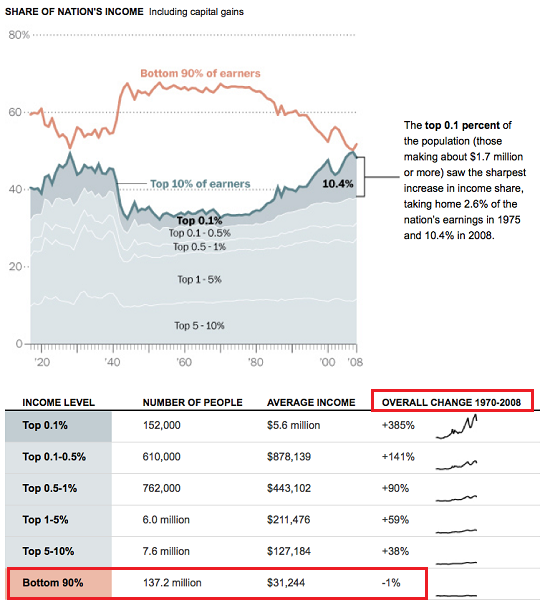
Growing unemployment and social instability will be the major drivers of future economic policies
A revolution begins when the collective pain of having no jobs, food on the table or a home to live in reaches a tipping point.  This may start simply as a minor event, such as a man setting himself on fire, a government threatening to remove a few trees or just a man standing perfectly still on his own in total silence. The event hits a nerve and the frustration of the masses erupts, travelling instantly to an entire population through social media and igniting a fury that has been held down for generations by that one percent in power.

The inability of visionless politicians and their free market economist advisors to look beyond their economic statistics, autocratic policies,  and meaningless political surveys will at some point come back to haunt them. Unless they are seen by the population at large to seek fairness and justice for the lower 99% of the population, there could be another revolution, just as there were 26 times in Brazil between 1789 and 1974. It’s not pleasant, but when pushed to the extreme, justice seeks its own revenge.
History’s perfect storm of job losses, speculative bubbles, fraud and austerity economics.
'Capitalism without humanity, solidarity and the rule of law - has no morality and no future.'
From  "Das Kapital: A Plea for Man" by Munich Cardinal Reinhard Marx

According to the Spanish press recently, growing unemployment and social unrest, could be paving the way for social revolution on a global scale. Grass roots social and political activism, angry at continuing injustices and political and corporate criminality are now quite capable in changing the political landscape in the blink of an eye, as can be seen throughout the Middle East, Turkey, Europe, SE Asia and South America, with the list growing by the day. As I write these words I have just found that the ABC has reported that in Brazil, organised through social media, “about 800,000 people have marched in rallies across the country of 194 million people, according to an AFP tally - an intensification of a movement sparked two weeks ago by public anger about a hike in public transport fares.” On SBS news, I heard one young Brazilian protestor sum up the crowd’s mood, by commenting that all he wanted was justice.
Only Wall Street, the US Republican/Tea Party, the NRA and Murdoch’s Fox news appear to be immune, navel gazing while the world implodes around them, protected in their virtual reality by an almost impenetrable firewall of self-delusion and deceit.
While China’s centrally driven economy will almost certainly be able to socialise assets from real estate and industry bankruptcies as a result of any major financial downturn, by contrast, capitalist economies may have some difficulty in doing this. But this does not change the fact we now live in a highly interconnected globalised world that will be severely disrupted by coming events. No country can expect to be immune when this occurs.
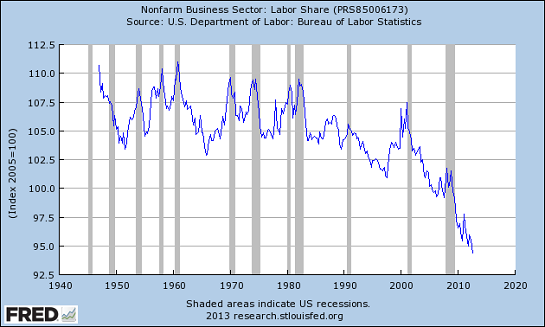
When I combine my studies of financial markets with economic and employment statistics over the last 30 years, what shows up is a long term sequential topping out of western economies, beginning in the 1980’s as jobs in these countries were slowly replaced by cheaper ones in SE Asia. This process was ably assisted by Margret Thatcher’s technique of dehumanising workers as disposable assets, so allowing large corporations to respectably downsize and relocate operations offshore where labour was cheaper and taxes on profits non-existent – all in the name of the so called “Free market”.  This may have helped modernise the UK, but it penalised and disenfranchised millions of workers and laid down the foundation of the economic mess that we see globally today.

It’s simple maths. In western countries there has been a massive reduction in the number of real job making or growing the necessities of life rather than guns, while the number of parasitic jobs in the finance industry has gone through the roof during the equity bull market over the last 30 years. Consumer debt increased to maintain lifestyle as new jobs became part time and paid less and the cost of living escalated. For instance, I now pay a phone bill monthly that is way in excess of what I used to pay quarterly. Credit card interest rates are around 20% and petrol prices are way above what they should be. The list goes on.

But as soon as consumption begins to fall and the economy retreats, business starts to lay off jobs in the thousands. Banks and Telcos close their call centres and send thousands of jobs offshore to India and the Philippines. Governments cannot pay for services because the small to mid-sized businesses who used to put all their profits back into the economy one way or another have been replaced by large multinationals who send their profits offshore. Even Standard and Poor documented these changes and warned everyone in a series of economic reports published over the last 18 months.
An endgame by stealth.
When a 200 year bull market comes to an end, it does so with what I call an “elegant complexity” over a large number of years and has little to do with equities inching their way into daily new highs as they have over the last few months. This long topping out process has yet to produce an endgame, but it must be getting close. And especially since 1994/1998, you can trace the sequential topping out in equity charts as a very long drawn out process, ignored by most financial analysts, who have been more  obsessed by their 24 hour news cycles, calling price movements of the day as sports commentators call the horse races.

All this, combined with the fact that free money is now seen to grow on trees, means risk is being currently encouraged to find higher returns in markets that are growing more fragile by the day. I am not sure whether Hyman Minsky would be laughing or crying or both if he were alive today, watching how much of his advice was being ignored as equity buyers look to an optimistic future with their feet planted firmly in the air. But as Bernanke announced yesterday, all this free money may soon come to an end over the coming months, although I expect his resolve to be severely tested when his over optimistic forecasts begin to fall short.
The media is massaging the message and self-censoring the news.
Compounding these problems are sections of the world media increasingly covering up and/or playing down important issues of the day, in a way that is certainly designed to deceive more that it is trying to placate a populace concerned for their future. We are experiencing the cumulative effects of centuries of global geopolitical, economic and societal changes. This huge complex of variables concerning multiple countries, cannot be summarized with a few words or charts or analysed out of context. This means that the historical narrative needs to become an essential part of any research process into the human condition and should not be reduced to “cut-and-paste” journalism or hidden from view behind paywalls.  
Someone once said that “The purpose of journalism and the media was to inflate weak ideas, obscure pure reasoning, and inhibit clarity.”  This has been well illustrated by the recently released high powered documentary “Shadows of Liberty”, while the Doonesbury cartoon below sums up the biases of Murdoch’s Fox News quite nicely.

Doonesbury takes on FOX News - by Garry Trudeau
Quality journalism should be there to do the exact opposite. It should be there to aid our decision making processes, to clarify ideas and to present them in ways that allow our minds to grasp and add new information to existing streams of thought.
Quality journalism is the glue that holds “facts” together. It gives us direction by helping us map complex streams of thought into stories. And the truth is that stories matter. Stories allow us to express the historical narrative in ways that both enhance and challenge our humanity and pattern our expectations of the future.  They allow us to find meaning in our lives, about who we are, where we are heading as a society, and whether the markets will go up or down. Narratives help us reclaim order from chaos by assisting our movement forward into not so much a new narrative, but into the inevitable extension of an older one. And without access to free and freely available quality news and journalism, we shall be less informed on how to live our lives, both now and in the future.
The truth about stories is that if we lose them, we shall be less than who we were.

Till next time.

See the original article >>

Bifurcation Nation

by Charles Hugh Smith

Many observers focus on the economic causes of the widening wealth inequality, but the divide appears to be both cultural and financial.


To say there are haves and have-nots and two major political camps does not distinguish this era from any other. But despite this surface similarity to previous eras, there is a palpable zeitgeist that the nation is bifurcating into two camps which no longer overlap or communicate using the same cultural signifiers and symbology.

There is also a growing awareness that the divide between very wealthy and the middle income households has widened into an enormous canyon of inequality:

Just as clearly, labor's share of the national income has been declining sharply: unearned income from capital is reaping more of the national income as the share earned by labor shrinks.

Politically, I have long commented on the rising political divide not between the "two sides of the same coin" parties but between those who depend on and support the Savior State and those who pay the majority of taxes that fund the Savior State. This has created the divide feared by the Founding Fathers, The Tyranny of the Majority.


A neofeudal Elite rules the roost but the Savior State buys the complicity of the lower classes with entitlements and social programs.

Tyranny of the Majority, Corporate Welfare and Complicity (April 9, 2010)

The Three-and-a-Half Class Society (October 22, 2012)

According to demographer Joel Kotkin, California has become a two-and-a-half-class society, with a thin slice of "entrenched incumbents" on top (the "half class"), a dwindling middle class of public employees and private-sector professionals/technocrats, and an expanding permanent welfare class: about 40% of Californians don't pay any income tax and a quarter are on the Federal Medicaid program.I would break it down somewhat differently, into a three-and-a-half class society: the "entrenched incumbents" on top (the "half class"), the high-earners who pay most of the taxes (the first class), the working poor who pay Social Security payroll taxes and sales taxes (the second class), and State dependents who pay nothing (the third class).
This class structure has political ramifications. In effect, those paying most of the tax are in a pressure cooker: the lid is sealed by the "entrenched incumbents" on top, and the fire beneath is the Central State's insatiable need for more tax revenues to support the entrenched incumbents and its growing army of dependents.

This leads to a systemic question: Is Democracy Possible in a Corrupt Society? (November 12, 2012)

We can phrase the question as a corollary: in honor of my book Why Things Are Falling Apart and What We Can Do About It (print) (Kindle), let's call it WTAFA Corollary #1:

If the citizenry cannot replace a dysfunctional government and/or limit the power of the financial Aristocracy at the ballot box, the nation is a democracy in name only.

In other words, if the citizenry cannot dislodge a parasitic, predatory financial Aristocracy via elections, then "democracy" is merely a public-relations facade, a simulacra designed to create the illusion that the citizenry "have a voice" when in fact they are debt-serfs in a neofeudal State.

Many observers focus on the economic causes of the widening wealth inequality, but the divide appears to be both cultural and financial. Author Charles Murray describes a cultural divide that informs the political and economic divides that are obvious to all in his book Coming Apart: The State of White America, 1960-2010.

Murray has collected evidence that Caucasian America has bifurcated into cultural/social haves and have-nots: the haves are married, have college degrees, avoid military service, are less likely to attend religious services, and have little contact with those outside their own upper-middle class.

The have-nots are divorced/single parents, less educated, are more likely to serve in the military and attend church, and earn much less than the haves.

The social glue that binds the nation includes these core values: the Constitution (and particularly the Bill of Rights), that no one is above the law, and upward mobility, that anyone born without privilege or wealth can attain status, wealth and power by exerting their own will and initiative.

What Murray suggests is not that upward social mobility has ceased, but that it's become more difficult for the have-nots to join the haves, not necessarily for lack of opportunity but for the values-based reasons he describes.

In my analysis, the cultural upper class has the income and connections to build abundant human and social capital, while the lower class has neither the values-tools, income or connections to assemble these critical building blocks of wealth.

This sociological/economic reality is ideologically inconvenient on a number of fronts, largely because it ties "personal choice" issues such as marriage to what appears to many to be a strictly economic issue.

The resentment toward the privileged class that is bubbling up suggests people don't need to read a lengthy sociological study to sense the divide is widening. The Mobile Web technology boom in San Francisco has sent rents and resentments to new heights: In defense of San Francisco's techies (S.F. Chronicle)

A growing number of San Franciscans are fed up, not just with startups, but with techies in general. With their apps and (company) buses, their gourmet coffee and skinny jeans, their venture capital wishes and IPO dreams. They're tired of watching rents soar, friends forced to relocate and beloved neighborhoods drained of diversity.I understand the frustration, but wonder: Are we embracing a soft xenophobia applied to a sector rather than a race, to some cohesive elite tech class that doesn't exist outside of our own minds?

Rebecca Solnit discusses this issue in Diary:

The buses roll up to San Francisco’s bus stops in the morning and evening, but they are unmarked, or nearly so, and not for the public. They have no signs or have discreet acronyms on the front windshield, and because they also have no rear doors they ingest and disgorge their passengers slowly, while the brightly lit funky orange public buses wait behind them. The luxury coach passengers ride for free and many take out their laptops and begin their work day on board; there is of course wifi. Most of them are gleaming white, with dark-tinted windows, like limousines, and some days I think of them as the spaceships on which our alien overlords have landed to rule over us.
Sometimes the Google Bus just seems like one face of Janus-headed capitalism; it contains the people too valuable even to use public transport or drive themselves. In the same spaces wander homeless people undeserving of private space, or the minimum comfort and security; right by the Google bus stop on Cesar Chavez Street immigrant men from Latin America stand waiting for employers in the building trade to scoop them up, or to be arrested and deported by the government. Both sides of the divide are bleak, and the middle way is hard to find.

I think Solnit's point touches on two key dynamics: the shrinking middle, and the casual privilege of those with earning power and the resentment of the increasingly powerless.

This is hardly unique to America: Priced out of Paris: global cities pricing out the upper-middle class.

Is this the result of capitalism? The question is an active one, for example Capitalism and Inequality: What the Right and the Left Get Wrong (Foreign Affairs, March/April 2013; the article is behind their paywall; check out a copy at your local library).

While capitalism certainly rewards the most productive (in the context of whatever incentives are in place) and creatively destroys what is no longer productive/profitable, we have to differentiate between classical open-market capitalism and the state-cartel (crony) version that is passed off as capitalism for PR purposes.

Then there are the economic forces that are sweeping aside the old structures not just in America but in China, Europe and elsewhere:

1. Automation, software and robotics are eliminating human labor on a vast scale.

2. Financialization has given those with capital and access to financier expertise ways to skim great wealth from the system without creating any value whatsoever.

3. The emerging economy gives tremendous advantages to those with ample human and social capital and the value system that enables them to continue adding to their human and social capital throughout their working lives. Those without these skills and values will increasingly be marginalized.

These are dynamics that don't track neat ideological lines, nor do they lend themselves to tidy, simplistic solutions. Before we propose fixes, perhaps we need to do more work on understanding the many interconnected feedback loops in the widening bifurcation of the nation.

See the original article >>

These leading indicators are suggesting a global slowdown is at hand!

by Chris Kimble

CLICK ON CHART TO ENLARGE

The Shanghai index broke below 20-year support line (1)  in the chart above, attempted to climb back above this new resistance line and looks to have failed at (2).  Now the Shanghai index is breaking down further and Copper is breaking a three year support line at the same time.

These leading indicators breaking support at the same time are suggesting a global slowdown is near.

Do these breakdowns reflect the "Perfect Portfolio Storm" is about to happen or is happening?

CLICK ON CHART TO ENLARGE

The above chart reflects that Government bonds and stocks are working on breakdowns at the same time, a further suggestion something is going on that investors haven't seen many times in the past 13 years!

CLICK ON CHART TO ENLARGE

Speaking of 13-years, since the mid 1970's every 13 years a historic high or low has taken place in the Dow, reflected in the chart above.  Will we have another repeat this year???

See the original article >>

The deflationist error

By Alasdair Macleod

Many people believe there is a significant risk that the Irving Fisher debt-deflation theory of great depressions is still an economic threat today. They overlook the fact that Fisher published his theory examining debt-deflation events under a gold standard, which does not apply today. Financial credit contractions therefore take a different appearance.

The events he described arose as a consequence of the earlier expansion of bank credit in a fractional reserve system when the currency being used was convertible into gold. This was the case until 1933, when Fisher wrote his definitive article for Econometrica. Under those circumstances, it is obvious that contracting credit leads to a self-feeding liquidation of assets, driving their prices down, and an increasing demand for money, i.e. gold. This was reflected in the gold revaluation that took place that year.

This is not the situation today. The absence of the gold discipline allows central banks to replace credit with quantities of raw money sufficient to ensure that Fisher’s debt-deflation is bought off.

Another way of looking at it is in the context of the aftermath of the banking crisis five years ago. Before the banking crisis both banks and their customers were happily expanding their credit and debt respectively, and it was the crisis that brought a sudden end to those care-free days. There was a sudden switch in behavior that Irving Fisher would have recognized as tipping us into a debt-deflation depression. Initially, the price effect was dramatic: In the U.K. for example, new luxury cars suddenly became available at discounts of up to 40%. It affected Europe and the U.S. as well, which is why governments stepped in with scrappage schemes, cash-for-clunkers and so on. Other capital goods, such as property were similarly affected.

What had happened was an increase in preference for money over capital and consumer goods, or a dash for cash. The price effect was contained and reversed through unprecedented government intervention by TARP and other programs in the U.S., and by bank rescues in the U.K. and Europe. This has been backed up by quantitative easing and zero interest rate policies that persist to this day.

Fisher’s debt-deflation event happened five years ago and was bought off by ensuring banks had enough new money to ride out the storm. None of this would have been possible without the freedom to expand the money quantity indefinitely. No longer do we have to find gold to repay our creditors.

Now we can consider a second question: Will gold be sold to pay back currency-denominated debt?

This could be a factor when gold is widely owned, but it is not. The recent shake-out in gold prices has certainly taken care of that, and there has been a substantial transfer of ownership to Asian countries and Russia. These new owners generally regard gold as a refuge from paper money, not as an asset to liquidate to pay down debt. To them it is super-money, to be hoarded.

It is indicative of our economic biases that we completely overlook the differences between the sound money of 1929/30 and the infinitely expandable money of 2008/09. We make this error because today’s economists lead us astray with a fundamental belief that the state through monetary intervention can fix everything.

Even though today’s economists are a broad church they follow beliefs instead of well-reasoned economic theory. Beliefs are better left to clerics.

See the original article >>

Fed monetary course hard to undo for Bernanke successor

By Rich Miller and Joshua Zumbrun

The Federal Reserve under Chairman Ben S. Bernanke has committed itself to a monetary strategy for this year and beyond that will be difficult to undo under a new chairman.

Under Bernanke’s leadership, the Fed has set out clear markers for the conditions that need to be met to moderate and eventually end its asset-purchase program and then begin increasing interest rates. As a consequence, the identity of the chairman next year is unlikely to matter as much as in the past.

“Usually, the Fed chairman comes in with a clean slate to do whatever they want,” said Michael Feroli, chief U.S. economist at JPMorgan Chase & Co. in New York and a former researcher with the central bank. “Whoever comes in this time is going to inherit a pretty rigid structure.”

Bernanke’s second four-year term as chairman ends on Jan. 31. While neither he nor the White House has said definitively that he’ll step down, President Barack Obama suggested just that in a television interview last week, saying the Fed chief had stayed in his post “longer than he wanted.”

Bernanke has tried to make the policy-making Federal Open Market Committee more transparent and democratic. By de- emphasizing the role of the chairman in the committee’s deliberations, he has made it harder for his successor to change the course of policy, said Roberto Perli, a former Fed official who is now a partner at Cornerstone Macro LP in Washington.

Policy Commitments

“The FOMC under a potential new chair would be largely the same as the current one, and it is unlikely that FOMC members would relinquish their authority or renege on their own policy commitments simply because a new chair may have different views,” Perli wrote in a June 19 note to clients.

Assuming Bernanke is leaving the Fed, Obama probably will want to name someone whose views are not all that different. In a television interview with Charlie Rose, the president said the Fed chairman has done “an outstanding job.”

“I’d be quite surprised if the president nominated a chairman who wasn’t broadly in agreement with the policies that the current chairman has led on the committee -- an emphasis on getting the unemployment rate down and having economic activity be stronger, an emphasis on communication and transparency,” former Fed Vice Chairman Donald Kohn said in an interview in Bloomberg’s Washington bureau.

One of the leading contenders to replace Bernanke is the current vice chairman, Janet Yellen, who led a subcommittee on the FOMC that focused on devising the central bank’s communications strategy. Since Yellen helped forge the policies, she’d probably be inclined to continue them, said Joseph LaVorgna, chief U.S. economist for Deutsche Bank Securities Inc. in New York.

‘Very Comfortable’

“My guess is the next person is Janet Yellen, and she seems to be very comfortable going along with the policies to date,” said LaVorgna, a former economist at the New York Fed. “I imagine the transition, whoever it is, but likely her, being very seamless.”

Economists in a June 19-20 Bloomberg survey assigned Yellen a 65% probability of taking over the top job once Bernanke’s term ends. Timothy F. Geithner, a former Treasury secretary and former New York Fed president who worked closely with Bernanke in both those posts, was seen as the second most- likely successor, with odds of 10 percent.

The next Fed chairman will be “inheriting the last vestiges of the current policy regime,” said Eric Green, the global head of rates, foreign exchange, and commodities research at TD Securities Inc. in New York. “Basically they’re not going to have a lot to do that first year.”

Ensuing Regime

That will change after asset purchases end and the Fed prepares to start raising its benchmark interest rate, said Green, another former economist at the New York Fed. Then, the FOMC “will have an opportunity to completely define the ensuing regime -- the rate tightening regime.”

The Fed has tried to spell out how it will adjust policy in the future partly out of necessity. With short-term interest rates already effectively at zero, it can’t lower them further to promote growth. Instead the Fed has used asset purchases and more open communication -- promising, in effect, to keep short- term rates lower for longer -- to try to achieve that goal.

“Particularly when you’re in unconventional policy mode, talking about the future and how the Fed might react under certain circumstances is critical,” said Kohn, who is now a senior fellow at the Brookings Institution in Washington.

“One of the main thrusts of the Bernanke chairmanship is to help explain as best as the Federal Reserve could what their reaction function is,” he added.

Stocks Retreat

U.S. stocks retreated, sending the Standard & Poor’s 500 Index to a nine-week low, as Chinese equities entered a bear market amid concern a cash crunch will hurt the world’s second- largest economy and speculation increased that the U.S. will begin curbing stimulus.

The S&P 500 fell 1.7 percent to 1,565.07 at 10:01 a.m. in New York, the lowest level on a closing basis since April 22. The 10-year Treasury note yield rose to 2.61 percent at 10:09 a.m. in New York, after reaching 2.66 percent, a level unseen since August 2011.

The CSI 300 Index of China’s biggest companies tumbled 6.3 percent, the most since August 2009 and taking its decline from this year’s peak to more than 20 percent.

European bonds extended declines from last week, sending Germany’s 10-year yield to a 14-month high, as concern the Fed will begin curbing its stimulus plan this year damped demand for fixed-income assets.

Italian two-year note yields jumped to the most in six months, while Spain’s 10-year yield climbed above 5 percent for the first time in almost 12 weeks.

Dialing Down

Bernanke told a news conference on June 19 that the central bank may start dialing down its unprecedented bond-buying program this year and end it entirely in mid-2014, provided that growth quickens and inflation moves up closer to the Fed’s 2 percent target. The central bank currently is purchasing $85 billion of assets per month, comprising $40 billion of mortgage- backed securities and $45 billion of longer-term Treasury debt.

Policy makers forecast that growth will pick up to 3 percent to 3.5 percent next year, from 2.3 percent to 2.6 percent this year, according to their central tendency estimates, which exclude the three highest and three lowest projections. Inflation -- as measured by the personal consumption expenditure price index -- will speed up to 1.4 percent to 2 percent, from 0.8 percent to 1.2 percent this year.

Zero Rates

Bernanke said the FOMC expects a “considerable interval” between the ending of asset purchases and the first interest- rate increase. He reiterated that the central bank intends to keep short-term rates near zero at least as long as unemployment remains above 6.5 percent and the outlook for inflation doesn’t exceed 2.5 percent. Joblessness was 7.6 percent in May, and inflation was 0.7 percent in April.

A “very strong majority of FOMC participants still expect rates to be quite low at the end of 2015,” Bernanke said.

A strong majority also doesn’t expect the committee to sell any of the mortgage-backed securities it has on its balance sheet, he added.

Once a policy has been spelled out, it’s always harder to change course, said Robert Eisenbeis, a former director of research at the Atlanta Fed.

“It’s still a committee, and what one chairman can do depends on their ability to manage the committee,” added Eisenbeis, now vice chairman and chief monetary economist at Cumberland Advisors Inc. in Sarasota, Florida. “It’s like trying to move a glacier. It’s very hard for someone to come in and change course unless they’re a very skillful politician.”

See the original article >>

Markets Don’t Like China's ‘Reasonable’

By tothetick

China’s central bank issued a statement that the Chinese banking system had liquidity levels that were “reasonable” today. There by hangs a tale. ‘Reasonable’ is that which may fairy and properly be required of an individual (a case of prudent action observed under a set of given circumstances). It is just, rational, ordinary in usual circumstances. However, these are not usual circumstances, are they? Chinese cash rates hit a high of 25% on Friday 21st. Overnight bond-purchase rates ended up double what they should have been at 8.4920% on June 21st. Those aren’t ‘usual circumstances’, are they?

Wherever you might be standing, ‘reasonable’ in anyone’s book is far from good and should be cause for concern. That’s exactly how the world’s markets saw the statement as they plummeted today.

The interbank overnight rate may have decreased today still further from the dizzy heights of last week, but the going still looks as if it could be tough for the coming days. The markets don’t like ‘reasonable’. The overnight lending rate (which is the measurement for liquidity) stands at 6.489% today. On Friday it was 8.4920%. But, it has been at 3% on average over the past year and a half. That spells trouble. The markets have read exactly the self-same thing as Wall Street fell by over 1.5% and markets in Europe fell by just over 1% across the board:

  • The FTSE 100 is down 1.24% (75.77 points to 6, 040.44) right now.
  • The CAC40 has fallen by 50.66 points (1.38% to 3, 607.38).
  • The DAX is down 0.89% at 7, 719.91 (down 69.33 points).
  • The Dow Jones Industrial Average is down 243.29 points to 14, 556.11 (-1.64%).

It would appear that the People’s Bank of China knew what was looming ahead as the report that was issued today was actually dated last week (June 17th). The ‘reasonable-level’ statement was to try to allay fears that the Chinese banking system was no better than elsewhere, contrary to belief that it was flush with cash. They are actually strapped. What it did do, however, was send a message to the banking system in China to get its act together and cut the shady investments that have been taking place, in a bid to get them to focus on short and low-risk loans. It also seems like it’s the message that will be winging its way to bank boardrooms in China that the People’s Bank of China is neither able nor willing to carry out a bail-out of the banks if they fail. As a result, there are some smaller banks that might actually go under in the coming months. Some might be ready to argue that that is exactly what should be done. Don’t bail them out. Or will they be ‘too big to fail’ like our own banking system?

Liquidity has to be dealt with and quickly if this is going to be avoided.

Conditions are set to remain under pressure in the coming weeks with regard to interbank lending rates in China. In the meantime, it was the last thing that the market needed to give it a shove rather than a gentle push to wake up to what is happening in China.

The Shanghai Composite dropped by 5.30% at market close today and ended up being the worst hit of all international markets. That means that it has plummeted in just six months by 13.5%. Today’s fall brought it to an equal footing with the state of affairs in August 2009. The Hang Seng in Hong Kong was down 2.79% and the Nikkei fell by -1.26%.

Shanghai Composite

Shanghai Composite

It looks like some analysts are getting ready for another 2008-like credit-crunch time. If only we knew how and where to invest to strike it rich like some have done in the past. We could all retire and wouldn’t have to play the markets any more, leaving them in disarray. The 2nd-largest economy in the world is cause for great concern as the knock-on effect of a Chinese credit-crunch would be catastrophic to the global economy and would scupper all hopes of rising employment in the USA  and increased output there.

Commodities were also reeling from the effect of such a slow-down in the world. Oil (crude and Brent) fell to lows that haven’t been seen for three weeks. Brent stands at $100.09, which is down 0.80% at 16:03 today. It reached as low as $99.68.

Brent on 24th June 2013

Brent on 24th June 2013

The word is on that China will kick off a new credit crunch that will bring us down. Buzz? Truth? Stocks are falling and that is a certainty right now, however. Some might say that it will remove the pressure from Ben Bernanke at the Federal Reserve. Remember, tapering and withdrawal of Quantitative Easing was to be dependent upon the situation of the economy in the US (if unemployment were to reach a better level to 7% from 7.6%). At least, it will take the attention away from him and the tapering of Quantitative Easing in the USA. Others will say that we might never know what is going to happen. Predicting how the Chinese market is going to react would be incredibly difficult given the lack of transparency there in statists and data. Maybe Edward Snowden should have let us in on the stuff a little bit earlier. Others will say that you can’t say for the moment what will happen given the current volatility of the market. But, one thing is for sure: bubbles usually burst.

If the People’s Bank of China is trying to bring the Chinese banks back into line, then the taste of the medicine is like bitter aloes. Herbal they might be. Purgative possibly! Sheer purgatory for sure for the Chinese banking system and the rest of the world!

Growth prospects for China have been dropped from 7.8% to 7.5% by analysts (Goldman Sachs) for yoy growth in the second quarter of 2013. The figure of 7.4% has been given for 2013, rising to 7.7% in 2014 perhaps.

See the original article >>

Cotton drops as China’s economy falters

By Jack Scoville

COTTON

General Comments: Futures were lower again on what appeared to be long liquidation from speculators and perhaps some farm selling. The rally in the U.S. dollar and disappointing economic news from China late last week caused the selling interest to develop once again. Ideas of better weather in U.S. production areas were once again negative for prices. Some storms are moving through western Texas and conditions there are improving. Good weather is being reported in the Delta and Southeast as well. The weather has improved, and looks to improve conditions generally through the rest of the week. Scattered showers are forecast for the Delta and Southeast, and wetter and warm weather is expected in Texas. Weather for Cotton appears good in India, Pakistan, and China.

Overnight News: The Delta and Southeast will see some light showers this week. Temperatures will average above normal. Texas will get dry weather. Temperatures will average above normal. The USDA spot price is now 81.3409 ct/lb. ICE said that certified Cotton stocks are now 0.574 million bales, from 0.562 million yesterday. ICE said that 116 notices were posted today and that total deliveries are now 116 contracts.

Chart Trends: Trends in Cotton are down with no objectives. Support is at 85.10, 84.75, and 84.55 October, with resistance of 87.10, 88.20, and 89.60 October.

FCOJ

General Comments: Futures closed lower. Futures have been working generally lower as showers have been seen and conditions are said to have improved in almost the entire state. Ideas are that the better precipitation will help trees fight the greening disease. No tropical storms are in view to cause any potential damage. Greening disease and what it might mean to production prospects continues to be a primary support item and will be for several years. Temperatures are warm in the state, but there are showers reported somewhere in the state every day now. The Valencia harvest is continuing but is almost over. Brazil is seeing near to above normal temperatures and mostly dry weather, but showers are possible next week.

Overnight News: Florida weather forecasts call for showers. Temperatures will average near to above normal.

Chart Trends: Trends in FCOJ are down with objectives of 141.00, 133.00, and 130.00 July. Support is at 139.00, 137.50, and 136.00 July, with resistance at 145.00, 146.50, and 150.00 July.

COFFEE

General Comments: Futures were higher in recovery trading after the big moves lower on Thursday caused by the weaker Real and some weak economic data from China. Trends in all three markets are down after the price action late last week. However, futures also got to or close to the final down side objectives for the down trend, so it is possible that the market can rally going into the week. Arabica cash markets remain quiet right now and Robusta selling interest has become less, as well. Most sellers, including Brazil, are quiet and are waiting for futures to move higher. Buyers are interested on cheap differentials, and might start to force the issue if prices hold and start to move higher in the short term. Brazil weather is forecast to show dry conditions, but no cold weather. There are some forecasts for cold weather to develop in Brazil early next week, but so far the market is not concerned. Current crop development is still good this year in Brazil. Central America crops are seeing good rains now. Colombia is reported to have good conditions.

Overnight News: Certified stocks are higher today and are about 2.749 million bags. The ICO composite price is now 114.34 ct/lb. Brazil should get dry weather except for some showers in the southwest. All areas could gt showers early next week. Temperatures will average near to above normal. Colombia should get scattered showers, and Central America and Mexico should get showers, with some big rains possible in central and southern Mexico and northern Central America. Temperatures should average near to above normal. ICE said that 1 delivery notice was posted against July today and that total deliveries for the month are now 667 contracts.

Chart Trends: Trends in New York are down with no objectives. Support is at 116.00, 113.00, and 110.00 September, and resistance is at 122.00, 123.50, and 125.00 September. Trends in London are mixed to down with objectives of 1670 and 1580 September. Support is at 1720, 1705, and 1680 September, and resistance is at 1765, 1775, and 1800 September. Trends in Sao Paulo are down with no objectives. Support is at 140.00, 137.00, and 134.00 September, and resistance is at 148.00, 151.00, and 155.00 September.

SUGAR

General Comments: Futures closed higher in recovery trading. Trends flipped to down with the price action Thursday, and some follow through selling is possible early this week. Traders remain bearish on ideas of big supplies, especially from Brazil. Traders in Brazil expect big production as the weather is good. Demand is said to be strong from North Africa and the Middle East. Sugar refiners in Brazil are concentrating on producing Ethanol and not Sugar, so down side overall might not be that extreme and any moves lower this week might be chances to buy for at least a short term move.

Overnight News: Showers are expected in Brazil, mostly in the south and southwest. Temperatures should average near to above normal.

Chart Trends: Trends in New York are mixed to down with objectives of 1640 and 1580 October. Support is at 1665, 1650, and 1620 October, and resistance is at 1700, 1720, and 1730 October. Trends in London are mixed to down with objectives of 458.00 and 441.00 October. Support is at 469.00, 466.00, and 463.00 October, and resistance is at 480.00, 484.00, and 487.00 October.

COCOA

General Comments: Futures closed lower as the US Dollar rallied. There was not a lot of news for the market, and price action reflected this. Ideas of weak demand after the recent big rally kept some selling interest around. The weather is good in West Africa, with more moderate temperatures and some rains. It is hotter and drier again in Ivory Coast this week, but the rest of the region is in good condition. The mid-crop harvest is about over, and less than expected production along with smaller beans is reported. Malaysia and Indonesia crops appear to be in good condition and weather is called favorable.

Overnight News: Scattered showers are expected in West Africa. Temperatures will average near to above normal. Malaysia and Indonesia should see episodes of isolated showers. Temperatures should average near normal. Brazil will get mostly dry conditions and warm temperatures. ICE certified stocks are lower today at 5.020 million bags. ICE said that 0 delivery notices were posted today and that total deliveries for the month are 120 contracts.

Chart Trends: Trends in New York are down with no objectives. Support is at 2140, 2105, and 2080 September, with resistance at 2200, 2230, and 2250 September. Trends in London are down with objectives of 1380 and 1270 September. Support is at 1425, 1360, and 1320 September, with resistance at 1450, 1470, and 1490 September.

See the original article >>

The Great Global Rig is Ending…Are You Prepared?

by Graham Summers

The markets are beginning what could in fact be an epic meltdown.

China is on the verge of a “Lehman” moment as its shadow banking system implodes. China had pumped roughly $1.6 trillion in new credit (that’s 21% of GDP) into its economy in the last two quarters… and China GDP growth is in fact slowing.

This is what a credit bubble bursting looks like: the pumping becomes more and more frantic with less and less returns. Check out the collapse in China’s stock market.

We are literally back into 2008 Crash territory here:

Brazil, another “coming economic superpower” is experiencing rampant riots (over two million people in fact) as inflation soars. Here again we are back into 2008 Crash territory:

And the US… well the breakout to new highs is looking more and more like a false breakout. These developments usually result in extreme violent swings in the other direction. In this case… DOWN.

This is just the start. I warned Private Wealth Advisory subscribers in our most recent issue that higher rates were coming noting a collapse in bonds in Europe and the emerging market space.

This could easily become truly catastrophic. The world is in a massive debt bubble and the Central banks are now officially losing control. The stage is now set for a collapse that could make 2008 look like a joke.

See the original article >>

Gold positions slump as $55 billion erased from funds

By Joe Richter

Hedge funds cut bets on a gold rally by the most since February after the Federal Reserve laid out plans for reducing stimulus and this year’s drop in the value of exchange-traded funds (ETFs) extended to $55 billion.

Speculators reduced their net-long position by 29% to 38,951 futures and options by June 18, U.S. Commodity Futures Trading Commission data show. Holdings of short contracts jumped 14%, the most in eight weeks. Net-bullish wagers across 18 commodities slid 2.2% as investors became more bearish on copper and wheat.

Fed Chairman Ben S. Bernanke said last week that the central bank may slow its bond-buying program if the U.S. economy continues to improve, driving bullion to its lowest price since 2010. Gold, which tumbled into a bear market in April, is poised for more declines, according to Credit Suisse Group AG and Societe Generale SA. Investors cut their holdings through ETPs by 20% this year, on pace for the first annual drop since the products were introduced in 2003.

“There’s certainly a rush to the exits in gold,” said Jim Russell, a senior equity strategist in Cincinnati at U.S. Bank Wealth Management, which oversees about $110 billion of assets. “The nudge up in the Fed’s expectations economically suggests they may unwind their program a little quicker than investors thought.”

Most Bearish

Gold futures dropped 6.9% last week, the most since April, and prices reached $1,268.70 on June 21, the lowest since Sept. 16, 2010. Traders are the most bearish in 3 1/2 years, with 15 analysts surveyed by Bloomberg expecting prices to fall this week. Six were bullish and five neutral, the largest proportion of bears since January 2010. Gold futures for August delivery retreated 0.6% to $1,283.70 at 11:40 a.m. on the Comex in New York.

The Standard & Poor’s GSCI gauge of 24 commodities retreated 3.4% for the week and the MSCI All-Country World Index of equities fell 3.2%. The dollar gained 2% against a basket of six currencies. A Bank of America Corp. Index shows Treasuries lost 1.7%.

Policy makers may begin tapering asset buying this year and end the program in 2014 should the economy and labor market continue to improve, Bernanke said at a press conference June 19. The Fed will cut its monthly bond purchases of $85 billion by $20 billion at its September meeting, according to 44% of economists in a Bloomberg survey following Bernanke’s remarks. Gold as much as doubled from the end of 2008 to a record $1,923.70 in September 2011 as the Fed cut interest rates to a record low and bought debt.

ETP Holdings

Gold holdings in global ETPs dropped 533.3 metric tons this year. Investors may sell a further 285 tons in 2013, Societe Generale said in a June 17 report. Assets in the SPDR Gold Trust, the biggest bullion ETP, slumped below 1,000 tons for the first time since February 2009 last week. Prices will drop to an average of $1,200 in the fourth quarter, Societe Generale forecasts. Credit Suisse sees the metal at $1,100 in 12 months, Ric Deverell, head of commodities research at the bank, said on June 20.

Inflation will remain a threat even with the end of the Fed’s bond buying because of the unprecedented money printing by central banks around the world, boosting the appeal of gold, said John Kinsey, who helps manage about C$1 billion ($964.7 million) of assets at Caldwell Securities Ltd. in Toronto.

Japan Stimulus

Japan is making monthly bond purchases of more than 7 trillion yen ($71.67 billion). European Central Bank President Mario Draghi cut the euro region’s main interest rate in May to a record 0.5% and said policy makers were considering a negative deposit rate. Gold priced in yen reached the highest since March 1980 in April.

“Most of the reasons for gold as a reserve currency, as a hedge against inflation, are still there,” Kinsey said. “Everybody is stimulating and everybody has debt problems, and if the economies gain some traction, I think you’re going to see inflation come back.”

Money managers withdrew $506 million from gold funds in the week ended June 19, according to Cameron Brandt, the director of research for Cambridge, Massachusetts-based EPFR Global, which tracks money flows. Total outflows from commodity funds were $374 million, according to EPFR.

Worst Performer

The California Public Employees’ Retirement System, the largest U.S. pension fund, said raw materials were the worst- performing asset class in the portfolio during the 12 months through April, dropping 9.8%. All other asset groups increased. Banks from Citigroup Inc. to Goldman Sachs Inc. have said the decade-long commodity bull market is ending after higher prices spurred expansions at mines, farms and oil fields.

Bullish bets on crude climbed 13% to 262,239 contracts, the highest since February 2012, CFTC data show. Prices last week capped the first loss in three weeks on concern that a cash crunch in China may further slow growth in an economy that’s already cooling. Platinum holdings slumped 16% to a three-week low. Prices fell 5.4% in New York last week, the most since December 2011.

Investors increased their net-short position in copper to 29,018 contracts, from 18,722 a week earlier, CFTC data show. Prices fell for a sixth week, the longest slump in a year. Stockpiles monitored by the London Metal Exchange have more than doubled this year.

Farm Bets

A measure of net-long positions across 11 agricultural products fell 7.9% to 296,081 futures and options, as soybean and cattle holdings dropped. Bearish wheat holdings expanded to 29,431 contracts from 16,697 a week earlier. The money managers have held a net-short position since December. Prices dropped 9.4% this year. Bullish corn bets declined 9.8% to 74,405, the lowest since May 21.

The U.S. Department of Agriculture projects domestic corn and soybean output will rise to records in 2013, rebounding from a drought last year that damaged crops and eroded supplies. The agency will update its forecast of planted acreage on June 28.

“The overall outlook is going to be a real challenge for commodities, particularly with the kind of news we’re getting out of China and the emerging markets,” said Christian Wagner, who oversees $250 million as chief investment officer of Longview Capital Management LLC in Wilmington, Delaware. “Investors are going to have to pick their spots.”

See the original article >>

Oil Market Manipulation Reaches Absurd Levels

By EconMatters

Markets & Manipulation: A long History

Most markets these days are manipulated to some extent, and this is nothing new if we look back through the history of financial markets. But there are some strange things happening right now in the oil market worth mentioning.

Brent-WTI Spread/Scam

Another scam in the Oil market is the Brent-WTI spread this has been one of the biggest scams over the years in the Oil market. Just to provide some data to the absurdity which is this much hyped about nonsensical spread Cushing Oklahoma has 49.7 million barrels in storage, it had 45.1 million barrels in storage a year ago. Cushing had 50 million barrels in storage at the start of the year. Moreover, in June Cushing will be adding additional supplies to storage due to current pipeline capacity going offline. So for all this talk about pipelines finally unlocking all the glut of oil supplies from the Cushing hub, and this being the reason for the impressive reduction in the Brent-WTI spread it is just a bunch of nonsense.

Cushing Oklahoma Supply Glut

So there is basically more oil trapped in Cushing Oklahoma then there has ever been when the spread was 25! So regardless if the spread is 25 or 8 it has very little to do with supplies residing in Cushing Oklahoma that is quite evident. Now there are a bunch of factors contributing to the nuances of the spread which I will not go into detail here but the takeaway is just to point out the absurdity which is the false and misleading rhetoric that encompasses this spread and Cushing Inventory levels.


  Trading Systems and Methods, + Website (Wiley Trading)

400 Million Barrels & Climbing

While we are talking about inventory levels it is funny that WTI sits at $97 a barrel when the entire year we have had basically 3 minuscule draws in inventory supplies which stand at a record breaking 395 Million Barrels in storage. So the Dow keeps hitting new highs every week, and the US keeps setting new modern records for Oil in storage each week.

Weak Demand in an Artificial Economy

But it is not just the supply issues in an obviously oversupplied oil market with the US domestic production being the biggest culprit. The demand side of the equation has been equally bearish for the fundamentals with China`s actual economy slowing over the past 2 years, Europe being stuck in a perpetual recession, and the US being a mature market with higher fuel standards and a stagnant economy that requires $85 Billion of stimulus each month to keep from cratering. The demand side had been very underwhelming from the products side of the equation. For example, Gasoline supplies in the northeast are 10% higher than normal for this time of year.

Strong Dollar Bearish for Dollar Denominated Commodities

Finally the strong dollar is supposed to be bearish for commodities and oil, and with the US Dollar Index hovering around 84 and threatening to strengthen from these levels it is a wonder that the Oil market has barely noticed this strange occurrence in Dollar strength, unlike the Gold and Silver Markets.

Fundamentals: Are we talking about the Fundamentals Again?

The takeaway is that none of the actual fundamentals ever matter in the Oil markets. When you have a house style advantage that would make any Las Vegas Casino envious the fundamentals play little part in a manipulated Oil market. It is all about protecting the huge supply chain that is the oil market and everybody`s livelihood. When in doubt follow the money trail, and money is the biggest reason oil prices are where they are currently despite the bearish fundamentals of the commodity. Oil prices wouldn`t be at these levels if the powerful manipulators of the commodity were not making a whole lot of money as a result.

Oil Analysts Clueless

So the next time some Oil analyst tells you some hard studied reason why Oil prices are up it is all nonsense. Oil prices are up or down depending upon what the powerful players want oil to do, one week it can be at $86, the next $97, or $77, it is all about the money to these players, and they will do whatever it takes to make the money. And if it means being very creative with their methods then so be it, it is not like this is a regulated market!

See the original article >>

History Says Much Larger Sell-Off Looming for S&P 500

By Sasha Cekerevac

While Fed Chairman Ben Bernanke’s announcement that a reduction in the asset purchase program will begin later this year was not a surprise to me, stocks felt the impact as selling ensued across the board.

However, though the S&P 500 did pull back, it is still near its all-time highs. Over the past few weeks, I have been recommending that readers reduce their overall exposure to the S&P 500, and any other assets that have benefited from the stimulus program for that very reason.

In addition to beginning the reduction of asset purchases, the Federal Reserve chairman stated that he expects to end any asset purchases by next year, and to begin raising the Fed funds rate in early 2015, as opposed to previous Federal Reserve statements that indicated that the Fed funds rate would begin to rise in late 2015.

While Bernanke was careful to note that this did not mean that monetary policy would begin tightening immediately, it is clear that the next move will be toward a reduction in monetary stimulus.

This will certainly impact the stock market and any other asset class that has benefited from easy monetary policy. Many investors in the S&P 500 have been blindly buying, not basing their buys on fundamentals, but rather, assuming the Federal Reserve will continue monetary stimulus indefinitely.

As I stated many times before, the current monetary policy program by the Federal Reserve is only temporary.

The chart for the S&P 500 Index is featured below:

S&P 500 Large Cap Chart

Chart courtesy of www.StockCharts.com

As I previously mentioned, the sell-off in the S&P 500 is only minor in relation to the magnitude of the movement that’s been going on since November. Having said that, when the Federal Reserve begins reducing its asset purchase program later this year—I suspect it will be either in September or October—this will coincide, in my opinion, with a much larger sell-off for the S&P 500.

History is also on the side of caution for the S&P 500 during the months of September and October. Those two months are notorious for having poor performance records, including several famous crashes.

For the S&P 500, the Fibonacci retracement levels show approximate regions that investors can use as a roadmap for possible areas to target.

Naturally, we will have to digest much more economic data before the Federal Reserve makes any such move. Because the S&P 500 has discounted much of the revenue growth over the next year, at current levels, I think it’s priced close to perfection, leaving significant downside risk.

With the summer upon us and the Federal Reserve close to making a significant shift in monetary policy this fall, I would look to raise cash that one can deploy to buy stocks once the S&P 500 drops to levels that are attractive once again.

For long-term investors, the time to accumulate the S&P 500 is when the market sells off significantly—not when it’s at all-time highs.

See the original article >>

Lightning in a Bottle

by Marketanthropology

Just a general heads up as the MSWORLD index we follow continues to round out along the lines of its previous top in 2000.

Should lightning strike twice, the throw-over top and failed rally attempt we witnessed last week, could soon agitate a disorderly and panicked marketplace.

Our best expectations here in this scenario if you are not already short would be to buy the reflexive bounce in the SPX near exhaustion and short volatility - should the world indexes quake over the near term (1-2 weeks).

Food for thought.

"In the fields of observation chance favors only the prepared mind." - Louis Pasteur

See the original article >>

Controlling The Implosion Of The Biggest Bond Bubble In History

by AuthorWolf Richter

In theory, the Fed could continue to print money and buy Treasuries and mortgage-backed securities, or even pure junk, at the current rate of $85 billion a month until the bitter end. But the bitter end would be unpleasant even for those that the Fed represents – and now they’re speaking up publicly.

“Savers have paid a huge price in this recovery,” was how Wells Fargo CEO John Stumpf phrased it on Thursday – a sudden flash of empathy, after nearly five years of Fed policies that pushed interest rates on savings accounts and CDs below inflation, a form of soft confiscation, of which he and his TBTF bank were prime beneficiaries. That interest rates were rising based on Fed Chairman Ben Bernanke’s insinuation of a taper was “a good thing,” he told CNBC. “We need to get back to normal.”

A week earlier, it was Goldman Sachs CEO Lloyd Blankfein: “Eventually interest rates have to normalize,” he said. “It’s not normal to have 2% rates.”

They weren’t worried about savers – to heck with them. They weren’t worried about inflation either. They were worried about the system, their system. It might break down if the bond bubble were allowed to continue inflating only to implode suddenly in an out-of-control manner. It would threaten their empires. That would be the bitter end.

Andy Haldane, Director of Financial Stability at the Bank of England, put it this way: “We’ve intentionally blown the biggest government bond bubble in history.” The bursting of that bubble was now a risk he felt “acutely,” and he saw “a disorderly reversion” of yields as the “biggest risk to global financial stability” [my take... Biggest Bond Bubble In History Is Turning Into Carnage].

Preventing that “disorderly reversion” of yields is the Fed’s job, in the eyes of Stumpf, Blankfein, Haldane, and all the others. The Fed should let the air out gradually to bring yields back to “normal.” So the Fed hasn’t actually changed course yet. It’s keeping short-term rates at near zero, and it’s still buying bonds. But it has started to talk about changing course – and the hissing sound from the deflating bond bubble has become deafening.

Long-term Treasuries went into a tailspin. The 10-year note had the worst week since June 2009, the days of the Financial Crisis; yields jumped 39 basis points (13 bps on Friday alone), to 2.55%. Up from 1.66% on May 2. And almost double from the silly 1.3% that it briefly bushed last August.

The average 30-year mortgage rate increased to 4.17%, from 3.59% in early May. In response, the Refinancing Index crashed by almost 40%. Banks have sucked billions in fees out of the system via the refinancing bubble, but that game is over. And the Purchase Index dropped 3% for the week, a sign that higher rates might start to impact home purchases.

Then there was the junk-bond rout. They’d had a phenomenal run since the Fed started its money-printing and bond-buying binge. Average yields dropped from over 20% during the Financial Crisis to an all-time insane low of 5.24% – insane, because this is junk! It has a relatively high probability of default, and then the principal vanishes. That was on May 9, the day the rout started. The average yield hit 6.71% on Friday. Investors have started to take a gander at what they’re buying and would like to be compensated for some of the risks that they’re suddenly seeing again. The feeding frenzy for yield is over. A sea change! Some companies might not be able to find buyers for their junk. And there will be defaults.

To preserve the system, as dysfunctional as it has become, the Fed has set out to tamp down on that feeding frenzy for yield, the hair-raising speculation, and blind risk-taking that its easy money policies have engendered – that is, financial risk-taking which doesn’t create jobs and doesn’t move the economy forward but just stuffs balance sheets with explosives. With its vague and inconsistent words, the Fed pricked the bond bubble but now is scrambling to control the implosion and soften that giant hissing sound. It doesn’t want the bubble to go pop. Its strategy: sowing confusion and dissension so that investors would react in both directions, with violent swings up and down, not just down.

The first big gun to open fire on the “taper” promulgations was St. Louis Fed President James Bullard when he announced on Friday that he’d dissented with the FMOC’s decision “to authorize the Chairman” to discuss publicly “a more elaborate plan” for the taper and an “approximate timeline.” They were premature. “Policy actions should be undertaken to meet policy objectives, not calendar objectives,” he said.

As stocks were heading south, three hours before what might have been a very ugly Friday close, after Thursday’s plunge, Jon Hilsenrath was dispatched. He is considered a backchannel mouthpiece of the Fed, and markets feed on his morsels. “The markets might be misreading the Federal Reserve’s messages,” he wrote in the Wall Street Journal. Stocks turned around on a dime. Others chimed in. The cacophony grew. And any consensus of when the Fed might actually taper its bond purchases dissolved into hot air.

That’s the plan. To accomplish its goal of preventing, as Haldane called it, “a disorderly reversion” of yields, the Fed will redouble its efforts to spread dissention and uncertainty, to intersperse periods of misery with periods of false hope, to stretch out the process over years so that big players have time to reposition themselves – and make some money doing it, or fall off the cliff and get bailed out, while others will end up holding the bag. Which is how bubbles end.

See the original article >>

Follow Us