Friday, July 19, 2013

Why the Federal Reserve will taper in September

by Eugen von Böhm-Bawerk

Something peculiar has been going on the treasury market during the latest round of quantitative easing (QE). If we study the chart provided below we find that treasury rates increased as soon as a QE-program was enacted, and fell immediately after its termination. Take the TSY 10 year for example; as soon as QE1 was implemented rates rose rapidly from a low of 2.08 per cent to a high of 4.01 per cent. What is striking about this is the fact that the low was set three days into the program, while the high was set three days after the program. A similar development occurred under the QE2 program. Rates reversed their sharp downtrend from the peak set around the end of QE1. A notable difference in the QE2 cycle was the apparent front-running by the market. Investors had obviously learnt how QE impacted various asset classes, so the rate peak came at the middle of the program, not at the end as witnessed under QE1. Still, the collapse in rates right after the program ended was significant.

Then came the maturity extension program (MEP) with a dual – unofficial – mandate. First of all, it was designed to “twist” the yield curve by swapping short term treasury paper for long term. In other words, the yield compression was now a wanted result; while in QE1 and 2 the fight against deflation was used as excuse to bail out Wall Street. In the MEP it was the federal government that needed bail out. And this brings us to the second, unofficial, reason for MEP. With forward guidance incorporated, short term paper was essentially positively yielding cash equivalents for the primary dealers. The Fed told them that prices on shorter maturities would be fixed. Voila, the federal government could easily sell papers along the curve. That rates fell during the MEP-program should not come as a surprise.

When QE ∞ was introduced on the other hand, rates remained stable at a low level. Rates started to climb first when hints of “tapering” to the QE ∞ program was provided. This is the exact opposite of what we have seen in previous programs!

Source: Federal Reserve (Fed), own calculations

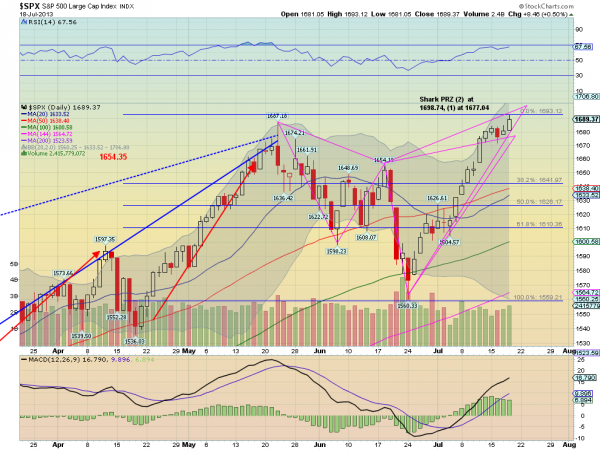
We also looked at the impact FOMC have had on the stock market since Greenspan “the-stock-market-causes-GDP” took the helm at the Federal Reserve. We tested the FOMC impact by compiling an alternative S&P500 index. The alternative index simply traded at 0 on both the day of an FOMC press release and the following day. On all the remaining days the alternative index traded just as the real S&P index. The result speaks for itself: Without trading on the FOMC-days the index is actually trending downwards. So much for following William McChesney Martin`s dictum of “taking away the punch bowl just as the party gets going.” The gang that took root at the FOMC under the Greenspan and Bernanke era added liquor whenever the chance presented itself! In terms of capital destruction no single individual has probably caused more harm to the world than Greenspan; and we include the global elite from 1939 to 1945 when making this statement.

More specifically for the stock market we see that the S&P index behaves more in line with QE1, QE2 and MEP. It goes up until the punch bowl is actually taken away. Then it plunges until Bernanke panics and pour more liquor to keep the party going.

Source: Federal Reserve (Fed), own calculations

So, we know the stock market behaves as usual, so what can explain the marked change in the treasury market? To answer this we looked at QE relative to marketable treasury bills, notes and bonds outstanding. However, the MEP paired with forward guidance complicates our analysis, so we need to find a way to compare apples with apples. We therefore express both the treasury holdings by the Fed and marketable paper outstanding in 10-year equivalents.

Let us start with the Federal Reserve. The first chart depicts the stock perspective, namely the total asset side of the Federal Reserve ledger. The second chart shows the flow perspective in terms of weekly change in both mortgage backed securities (MBS) and treasury securities (TSY).

Source: Federal Reserve H.4 (Fed), own calculations

Source: Federal Reserve H.4 (Fed), own calculations

We then convert this information to ten year equivalents by utilizing the data found in the System Open Market Account (SOMA) held by the New York Fed.

Source: Federal Reserve Bank of New York - SOMA (Fed), own calculations

Source: Federal Reserve Bank of New York - SOMA (Fed), own calculations

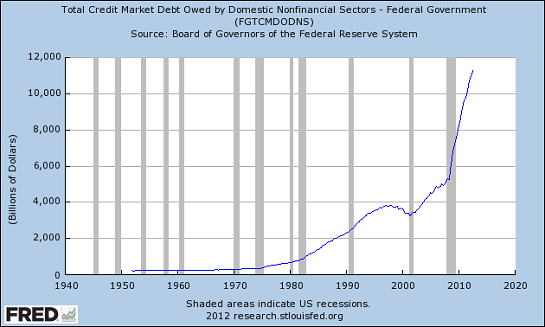
We then proceed to outstanding marketable TSY paper available. We use the data as reported by the Treasury Monthly Statement of the Public Debt (MSPD) to get a breakdown by maturity. However, in order to put the whole thing into context we present the reader with a much more interesting chart compiled with statistics from the “Historical Statistics of the United States – Colonial times to 1970” and the Federal Reserve Z.1. statistics

Source: Federal Reserve Z1 (Fed), Historical Statistics of the United States from Colonial Times to 1970, Bureau of Economic Analysis (BEA), own calculations

After some chart-porn we are finally ready to answer the question posed at the beginning: why do interest rates behave different in this QE-cycle while stocks do not? The next chart show the reader the staggering fact that the Fed is about to be the buyer of TSY. If they maintain the current program the Fed will gobble up more than 100 per cent of net issuance by December. In other words, the Fed has become both the indiscriminate buyer and the only buyer. If there is one thing economist learn at University it is the simple fact that the price is set at the margin. But what happens when one single buyer becomes the entire market all the way up to the margin? Well, at that point the “market” price is fully dependent on this single buyer.

Source: Federal Reserve Bank of New York – SOMA (Fed), US Treasury Direct – Monthly Statement of the Public Debt (MSPD), own calculations

The main difference between QE ∞ and the previous programs is simply that the Fed has become the market. So when the Fed hints about tapering, the front-running holders of already issued TSY jump the ship and overwhelm the Fed program. Prices drop, yield spikes and the stock market is getting an additional boost as bonds-sellers park their cash in the S&P bubble!

Conclusion:

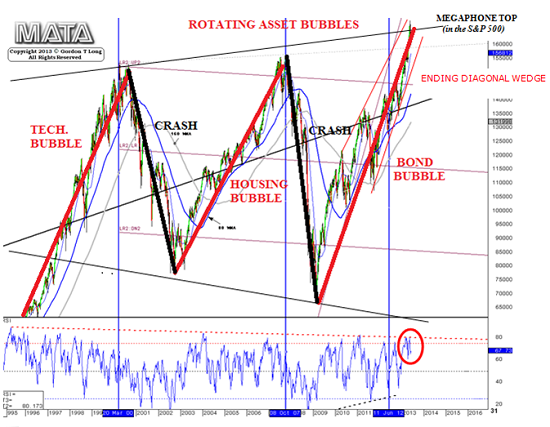
The multi-bubble machine called the Fed is at it again. This time they managed to create a gigantic bond bubble which will dwarf both the dot-com- and the housing bubble combined.

See the original article >>

What I Learned Working for the First Too-Big-to-Fail Bank

by Francine McKenna

The La Salle Street Canyon In Chicago. The former Continental Bank is on the left.

Continental Illinois National Bank and Trust Co. of Chicago would have been 155 years old next year. You may be surprised to hear me praise this institution so highly. But it was my first real job and the place where I learned how to be a professional, including how to be professionally skeptical.

I joined Continental in 1981 as an intern in the employee relations department. The bank’s lending training program faced a charge of persistent discrimination by the Equal Employment Opportunity Commission in the recruiting, hiring, retention, and promotion of their lending program trainees. The bank hired several PhDs to build the data case that would prove otherwise. I spent three summers and all my school holidays during college primarily digging through dusty files gathering data to defend Continental Bank against the EEOC charge.

I was enormously proud to ride the train from the South Side of Chicago every day to work at a world-class bank wearing a navy blue suit and matching low-heeled navy classic Ferragamo bow-style pumps. Continental Bank headquarters was a beautiful, historic building at 231 S. La Salle Street, across from the Federal Reserve Bank of Chicago and at the beginning of the financial district “canyon” anchored by the architecturally significant art deco Chicago Board of Trade.

This was the age of gracious banking. We had “coffee” dates with colleagues every morning in the subsidized cafeteria. Bank officers dined in a private buffet or oak-paneled rooms served by tuxedoed waiters when entertaining clients. I aspired to one day make it to their pay grade.

When I started working there in 1981, Continental Bank was the largest commercial and industrial lender in the United States. The bank had been buying loans from Penn Square, a tiny Oklahoma City shopping mall bank run by a guy named Bill P. “Beep” Jennings since 1978. However, significant growth in the syndication of the loans originated by Penn Square did not occur until 1981 and Continental funded its purchases with foreign and domestic overnight deposits rather than traditional retail ones.

When Penn Square went belly up in 1982, the shock was heard around the world. Bank examiners and Continental Bank’s internal auditors had been documenting the deterioration of underwriting quality and the poor collateral due diligence as the volume of loans purchased from Penn Square ramped up.

Unfortunately, no one listened. Just like no one listened 16 years later, in 2000, when Harry Markopolos tried to tell the SEC about the Madoff Ponzi scheme. It wasn’t until Penn Square’s failure that the world really paid attention to how Continental Bank had grown so big so fast.

Continental Bank, according to an FDIC report, “was the largest participant in oil and gas loans at Penn Square and experienced large losses on those participations.” Even worse, when Continental’s internal auditors visited Penn Square in December 1981 they found $565,000 in personal loans from Penn Square to John Lytle, the Continental Bank officer responsible for acquiring the Oklahoma City bank’s loans. According to testimony by C. T. Conover, then the Comptroller of the Currency, to the House Subcommittee on Financial Institutions Supervision, Regulation, and Insurance in September 1984, senior Continental Bank management heard about the loans but never received the full audit report. Lytle was not removed from his position until May of 1982 and did not leave the bank until August 1982.

Mark Singer, in his book “Funny Money”, theorizes that Continental executives repeatedly ignored danger signs rather than actively covered them up. “Among bankers there is an inbred tendency to react to a fiscal humiliation as if one had spilled gravy on a tablecloth or neglected to send a hostess a thank-you note.”

As of March 31, 1984, according to a GAO study, Continental Bank had approximately $40 billion in assets. It was the largest bank in Chicago and the seventh largest bank in the United States, in both assets and deposits. That GAO study says the Continental Bank crisis started on May 8, 1984 when the bank faced a sudden run on its deposits. The run began in Tokyo when a wire story reported rumors that a Japanese bank might acquire Continental Bank. According to reports at the time, “when the item was picked up by a Japanese news service, the translator turned ‘rumors’ into ‘disclosure’ and Far Eastern investors holding Continental’s certificates of deposit panicked at the implications. That day, as much as $1 billion in Asian money fled from the bank.”

Eight days after the run began, regulators announced a bailout. The FDIC put $4.5 billion in new capital into the bank, assumed liability for the bulk of Continental’s bad loans and began the search for another bank to take over the institution. To fulfill a promise to protect insured and uninsured depositors from any losses, the Fed made additional emergency loans to Continental Illinois that rose to $8 billion.

I joined Continental Bank full-time in June of 1984 as a trainee. There were 50 of us hoping to be placed in internal audit, IT, or accounting after completion of a 15-week rotational training program. But the bank run did not subside over the summer and we started to worry there would be no bank and, therefore, no job for us at the end of the training. Continental Bank was shrinking in response to the money market’s continued lack of confidence after the May funding crisis. Federal regulators found no buyer for it and, in late July, the bank was nationalized.

Continental Bank, and my fellow trainees and I, survived the summer of 1984. In 1997 the FDIC was still describing the 1984 bailout transaction as “the most significant bank failure resolution in the history of the Federal Deposit Insurance Corp.” It was the biggest failure too, until the takeover of Washington Mutual in 2008.

In the fall of 1984 I went to work in internal audit, reviewing trust accounts that had farmland and crops as their primary assets. My impression of the bank’s internal audit team was positive. The department was filled with serious audit professionals who went out in the field and on the road all over the world to ask the hard questions. During this era there was no discussion of risk management other than what a trader or lender might be concerned about.

Unfortunately, the Penn Square loans to Continental Bank’s Lytle are an example of the obstacles we faced as internal auditors all the time. It was rare, in my observation, for an unpleasant or embarrassing internal audit report to ever make it to top management or to capture their attention if the issues raised could put the brakes on revenue growth.

The FDIC agrees. In a case study of the Continental Bank failure included in the report, “History of the Eighties - Lessons for the Future”, the agency says, “There was little doubt that the bank’s management had embarked on a growth strategy built on decentralized credit evaluation unconstrained by any adequate system of internal controls and that the bank had relied on volatile funds. But how well had the responsible bank regulators assessed Continental’s situation, and should they have been more assertive in requiring the bank to change its lending and other high-risk practices?”

I passed the C.P.A. exam in 1986 and left the bank in 1988 to take a job as an accounting manager at a publicly held distributor of electronics components. It was a step up in pay and a chance to manage people.

The FDIC slowly re-privatized Continental Bank after the bailout by periodically selling its shares to the public. The last shares were sold and the bank completely returned to private hands in 1991. In 1994, the bank was bought by the old (West Coast) Bank of America.

To see how much and, yet, how little has changed for the banks since, it’s interesting to look at Continental’s 1984 peer group. According to the Comptroller of the Currency’s testimony the eight wholesale money center banks in the bank’s peer group were Bankers Trust, Chase Manhattan Bank, First National Bank of Boston, First National Bank of Chicago, Irving Trust Co., Manufacturers Hanover Trust Co. and Morgan Guaranty Trust Co.

Bank Boston, the successor bank of the First National Bank of Boston, was also acquired by Bank of America.

Nearly all the rest are now part of JP Morgan Chase.

My early professional education at Continental Bank significantly influenced my career and my attitudes about regulation and responsibility in financial services. Other alumni have gone on to bigger things than I did, though not always better.

Jon Corzine, for example, began his career in finance in 1970 as a portfolio analyst at Continental-Illinois National Bank in Chicago while he was in business school at the University of Chicago. Recent reports that Corzine emasculated MF Global’s chief risk officer, and that regulators dropped the ball overseeing the brokerage before it cratered, show that the problems I witnessed at Continental still haunt financial services.

Roland Burris was a vice president at the bank from 1964 to 1973. Burris is best known today as former Governor of Illinois Rod Blagojevich’s appointee to complete Barack Obama’s term as U.S. Senator after Obama became President. (Blagojevich described the Senate seat as being worth its weight in gold, though not in so many words.) But long before this ignominy, Burris started his career as the first African-American to examine banks in the United States.

And Andy Fastow and his wife Lea both worked for Continental Bank after earning MBAs from Northwestern University. Andy Fastow, as most readers know, eventually became CFO of Enron Corp. While at Continental, he completed the bank’s lending training program and was placed in the energy lending group to work on the new “structured finance” team. This is ominous in retrospect, and if you don’t see why, just Google “Chewco.”

By the time the bank was re-privatized, Continental Bank management had initiated several transactions intended to focus the bank solely on its strengths. Continental Bank’s delegation of the majority of its internal audit activities to PriceWaterhouse in 1991 was the first large-scale partial outsourcing of an internal audit function. Also in 1991, the bank signed a 10-year contract to outsource most of its information technology operations to IBM. It was the largest bank at the time to outsource IT, according to an article in the Chicago Tribune. Additionally, “the bank contracted out its entire legal department to the law firm Mayer Brown & Platt. It had already hired Marriott Corp. to run its cafeteria and LaSalle Partners to manage its buildings.”

The officers’ lunch buffet was also closed. A golden era had passed.

This column was originally published as a BankThink opinion piece December 23, 2011 to celebrate the first issue of American Banker more than 175 years ago.

See the original article >>

This Is What JPMorgan's London Whale Office Is Investing Your Deposits In Now

by Tyler Durden

As part of the Appendixed disclosures in the aftermath of JPM's London Whale fiasco, we learned the source of funding that Bruno Iksil and company at the firm's Chief Investment Office used to rig and corner the IG and HY market, making billions in profits in what, on paper, were supposed to be safe, hedging investments until it all went to hell and resulted in the most humiliating episode of Jamie Dimon's career and huge losses: it was excess customer customer deposits arising from a $400+ billion gap between loans and deposits (with shadow liabilities and assets offsetting each other).

After JPM's fiasco went public, the firm hunkered down and promptly unwound (or is still in the process of doing so) its existing CIO positions at a huge loss. However, that meant that suddenly the firm found itself with nearly $400 billion billion in inert, non-margined cash: something that was unacceptable to the CEO and the firm's shareholders. In other words, it was time to get to work, Mr. Dimon, and put that cash to good, or bad as the case almost always is, use.

So what has JPM allocated all those billions in excess deposits over loans, which as of the most recent quarter hit a record $477 billion and rising as shown in the chart below:

Courtesy of Fortune magazine we now know the answer - CLOs: that remnant of the credit bubble excess from the mid 2000s, and which has logically made a stunning comeback now that the second credit bubble nearly popped a month ago following a few unprepared remarks by Ben Bernanke, is what JPM is actively funnelling cash into. Yes, the CIO is buying CLOs... With your deposit cash of course.

From Fortune Magazine:

According to several people familiar with the deals, JPMorgan's London chief investment office, which last year lost more than $6 billion betting on credit derivatives, is in the process of inking deals to buy significant portions of collateralized loan obligations, which are structured bonds that are backed by groups of loans to below investment-grade companies.

John Timperio, a lawyer at Dechert who specializes in CLOs, says he is working on two deals right now in which JPMorgan (JPM) is expected to be the main buyer. One is for loans to mid-sized companies, which carry more risk, but higher yields. In another deal, JPMorgan is planning to buy nearly all of the highest-rated piece of the CLO. "It's a fairly large deal," says Timperio. "JPMorgan is back in this market."

As a reminder for those who may have forgotten, CLOs are nothing more than a levered way to make the TBTF circle jerk even TBTFer, as one bank will arrange the CLO (by providing cash to junk-rated firms), tranche it, and then sell it, with other banks almost always picking up the vast majority of the issuance. In doing so, the financial system ends up effectively enmeshing itself in cross-default provisions, and any liability-cum-asset impairment (because one bank's liability ends up being another bank's asset and vice versa in the most phenomenal circle jerk) reverberates and picks up as much speed and destruction as there is leverage in the system. Per Forbes:

Perhaps the most surprising thing about the CLO revival is this: The entities that have emerged as the biggest buyers of the packages of risky bank loans are the banks themselves. JPMorgan holds more CLOs than any of its rivals. In the past two years, the bank has nearly doubled its holdings of CLOs to $27 billion, as of the end of the first quarter, which was the last time it disclosed its holdings. According to its filings, the CLOs were purchased by JPMorgan's chief investment office, which is the unit where Bruno Iksil, who was nicknamed the London Whale, worked. Three people confirmed that JPMorgan manages its CLO portfolio out of its London office. JPMorgan's CIO unit, which invests the bank's excess reserves, is now headed by Craig Delany, who took over for long-time CIO chief Ina Drew, who left shortly after the bank's multi-billion losses were revealed. JPMorgan slowed its CLO purchases in the wake of those losses. But it appears the bank is in the process of ramping up their purchases again.

Why are banks so eagerly returning to the worst practices that led to the credit crisis (aside from Bernanke's zero cost investable and fungible cash)? Two reasons: regulatory arbitrage, and leverage, of course.

Almost everyone in the CLO market, including many bankers, say one of biggest reasons banks are buying CLOs has to do with regulations. Financial reform was supposed to stamp out regulatory arbitrage, in which banks are able to swap one similar asset for another in order to be able to increase their leverage, which generally increases risk.

But that hasn't happened in the CLO market. Under the new capital rules, which were approved by the Federal Reserve in early July, loans to corporations have a risk weighting of 100%. The AAA slices of CLOs, which are the portion of the deals banks typically buy, have a risk weighting of only 20%. That means banks can invest five times as much in CLOs as they can in the underlying high-yield loans with the same amount of capital. The additional funds come from borrowing, which increases a bank's leverage.

In other words, when risk is repackaged as a CLO, it affords the bank 5x more leverage on the underlying equity. As for the ultimate collateral: as noted above it is the security of junk-rated companies - those which have a bad habit of going bankrupt every so often.

So assume a 50 cent recovery on the underlying loan in a standard scenario when the recession comes back and the delayed wave of corporate defaults finally hits, and further assume 5x leverage using the CLO structure: it means a 90% wipe out on invested equity.

As for what is the source of invested equity? Why client deposits of course: deposits which traditionally has been used to match loan growth, and thus have faced far less risk of 100% wipeout. Deposits, which represent a loan by a client to the bank in exchange for interest or what used to be interest before Bernanke came along. Sadly, in the New Normal, a deposit is merely a loan to the bank that retains all of the downside (i.e., full loss net of whatever FDIC protection the government may provide) and none of the upside: something US banks have been quite happy to take advantage of.

Cyprus may have had a forced bail-in, but US banks have a better plan: go all in with deposit capital, and pray for the best. Should a worst case scenario hit, and deposits get a 90% wipe out, then... oh well. It was coming anyway.

And while some $30-40 billion of the CIO cash gambling investing may be accounted for, it means some $400 billion is still "out there."

See the original article >>

The Case For Frontier Farmland

By: Scott Baker

The following post ran just recently over at Pathfinder Ventures blog, an investment advisory and asset management firm focused on select Frontier Markets. Our own Scott Baker provided the dialogue.

FrontierAg5

The following content is provided courtesy of our colleague Scott.  As Scott is passionate about the case for investment in frontier agriculture – a point in which we share much common ground – we asked him to share some of his insight:

“Last week I had lunch with an executive of a Mongolian real estate firm, where the conversation turned to the topic of how difficult it is to find real estate in city centres around the world at attractive yields. The hunt for such an opportunity brought back fond memories of the early 2000’s, when prices in many developing countries were undervalued and before dovish monetary policy created a stampede of investors seeking yield in developing world real estate.

We agreed that Ulaanbaatar’s downtown core is one of the world’s last real opportunities, where cap rates in excess of 10% are not uncommon. However, yield compression is underway as Mongolia transitions from a country where money was put into the ground to one where wealth is generated from assets coming out of the ground (mining). Further, on 17 June of this year the government initiated a program offering 8.0% mortgages for 20 years, a trend that is already gaining significant traction and if sustained will soon provide upward pressure on both commercial and residential property prices.

Though, if you’re not going to come to UB to compete with the Mongolia Growth Groups and MAD’s of the world, where else can you turn? You certainly can’t look frontier market hotspots like Phnom Penh, Luanda, Yangon or Maputo, as real estate is already overpriced. For example, shop houses in Phnom Penh are selling for $500,000+ and you’re lucky if you can garner a cap rate of 4.0%. Unfortunately, for the time being the real opportunity in city centers has come and gone. In our opinion, today’s real opportunity lies in farmland.

A global re-balancing of agricultural demand is well underway as a rising middle class of two billion people in the developing world demands larger per-capita quantities of everything from cereals to proteins. As countries seek food security there are two trends, among others, that I expect to accelerate: acquisitions of western brands (e.g. Shuanghui’s recent acquisition of Smithfield Foods), and increased demand for frontier agricultural land.

Why frontier farmland? Land in developed economies is no longer attractive to investors seeking a respectable cap rate, as Iowa farm prices confirm. In the mid-2000’s land prices went parabolic (see chart below) for what I term “Grade A” farmland (defined as land with rich soils, ample water supply and nearby important infrastructure). Though the uptrend has continued since 2010 through increased leverage from debt financing, a stage of maturity is likely nearing. So, rather than jumping on the bandwagon at this point and receiving a harsh thrashing (pun intended) I am upbeat about “Grade B” farmland (That which has a higher perceived risk due to its location and relative lack of development, causing it to be undervalued) as the potential upside is enormous.

farmland-prices-300x278
Earlier this year I spent six months in Cambodia where market rates for agricultural concessions rank among the lowest in the world on a per-hectare basis, in some cases for as little as $500. The country’s red, loamy soils are ideal for growing rubber (a major cash crop in the region) and the market rate for operating plantations ranges between $10,000 to $20,000 per hectare. Investment in Cambodia is predicated on mean reversion between its two larger and more developed neighbors Thailand and Vietnam; that is, prices will have more significant upside due to higher prices in those countries. According to one of my local contacts, rubber plantations in those countries currently sell for as high as $50,000 per hectare.

Pathfinder Capital’s focus is on frontier markets where we see that significant upside still exists. Farmland and agribusiness, in select African and Asian nations, are two areas ripe with inefficiencies and lacking value-added services, resulting in sub-par yields and profits. Combined with the fact that the global agricultural community faces a demographic time bomb of aging farmers and slowing yield growth, the risk of both commodity and land values rising substantially continues to increase.

Therefore, we believe that capitalizing on this trend through aiding the increase of crop yields will lead to elevated cap rates and additional foreign investment.“

We’ll be discussing this subject more frequently in the near future, and tying it into an upcoming post on our current activities in southern Africa.

See the original article >>

Yearly Charts Signaled Major Trends

by Tom Aspray

It has been a good week for stocks even if they close lower today. In the middle of January, I reviewed the yearly charts of many of the key markets. From the ranges in 2012, the key levels for the stock market were the 2012 highs at: S&P 500–1474, Dow–13,662, Nasdaq 100–2878, and Russell 2000–869.

The Russell 2000 overcame the 2012 highs on the first trading day of 2013. The S&P 500 and Dow Industrials surpassed their 2012 high on January 17. The Nasdaq 100 confirmed on April 30 by finally exceeding the 2012 high.

The yearly ranges can be important in all markets as the USD/JPY surpassed its 2012 high in early January signaling a much weaker yen. It is down close to 16% for the year and has created some good opportunities in the Japanese stock market.

Therefore, for the rest of 2013, one should keep an eye on both the 2012 ranges, as well the current highs and lows for 2013.

chart
Click to Enlarge

Chart Analysis: The yearly chart of the S&P shows the breakout above the resistance at line a that connected the 2000 and 2007 yearly highs. This completed a 900-point trading range, which has upside targets over 2400.

  • The yearly chart of the S&P 500 (SPY) looks quite strong with January’s upside breakout.
  • For the Spyder Trust (SPY), its 2012 high at $148.11 was also overcome on January 17.
  • Basis the yearly chart, the next important support is at $142.41, which was the 2012 close.
  • For the Dow Industrials, the 2012 close was at 13,104 while the Dow Jones Transportation Average closed at 5307.
  • The yearly S&P 500 volume was the highest in 2009 but has since formed lower highs.
  • The on-balance volume (OBV) is now well above the 2012 highs, which is a positive sign.

The Comex gold futures closed 2012 at $1675.80, which was well above the 2011 close at $1566.80.

  • For 2013, this made the yearly range of $1798.10 and $1526.70 the important levels to watch.
  • The 2012 low of 1526.7 was violated when prices plunged on April 13.
  • Comex closed the day at $1501 and subsequently has dropped as low as $1179.
  • This is a drop of $322 per ounce since the 2012 lows were broken on a daily closing basis. The 2010 low is at 1044.
  • The yearly OBV has turned lower but did make a new high in 2012. It is well above its WMA.
  • The SPDR Gold Trust (GLD) closed 2012 at $162.01 with a yearly high of $174.07 and a low of $148.53.
  • The quarterly pivot for GLD is now at $129.89 with the S1 support at $105.92.
  • Comex silver dropped below the 2012 low at $26.07 on April 12, and it has a quarterly pivot at $21.97.

chart
Click to Enlarge

After all the press the dollar has received this year, many may be surprised by the relatively narrow ranges on the dollar index’s yearly chart.

  • The Dollar Index closed 2012 at 79.87, which was just below the 2011 close of 80.52.
  • The yearly chart shows that a doji was formed in 2012, which was a sign of indecision.
  • A 2013 close above 84.24 would trigger a high close doji buy signal.
  • The 2012 high at 84.24 has been slightly exceeded in 2013, which is a positive sign.
  • The yearly OBV is acting much stronger than prices.
  • The major yearly resistance is in the 88.80 to 89.71, which includes the yearly highs from 2008-2010.
  • The EUR/USD rate closed at 1.3193, which was a bit above the 2011 close of 1.2959. The 2012 low was 1.2012 and the high was 1.3486.
  • The 2012 high in the EUR/USD was exceeded on February 1 as it made a high of 1.3572. This is level to watch for the rest of the year with the 2013 low now at 1.2746.
  • A breakout of these ranges is likely to be significant.

Crude oil closed 2012 lower at $91.82, which was significantly below the 2011 close of $98.83. So far in 2013, crude oil has stayed between the 2012 high and low.

  • There is yearly resistance from 2012 at $110.55 with the 2011 high at $114.83.
  • The quarterly R2 at 107.57 is now being tested.
  • The quarterly pivot support is at 94.39 with further support at 91.82, which was the 2012 close.
  • For yearly support, this year’s low at $85.61 is the key level to watch.
  • If it were broken one would then focus on the 2012 low at $77.28 and then the 2011 low of $74.85.
  • The yearly OBV is rising and is not far below the 2011 high.

What It Means: Based on the yearly charts, the dollar and crude oil look the most interesting. It would likely take significantly higher rates to push the dollar index above 89.71 for a multi-year breakout that would have major implications.

Given the technical readings on crude oil, a move above the yearly resistance at 110.55 does look likely.

How to Profit: No new recommendation.

See the original article >>

Gold building a base as evidence of physical shortage mounts

By Alasdair Macleod

Precious metal prices continue to build a base, with increasing evidence of a shortage of physical metal. In London gold forward rates (GOFO) continue to be negative, which means that the market will pay you more interest on your gold (COMEX:GCQ13) than on your dollars. GOFO is telling us that strong demand for physical from Asia has cleaned out the London market.

The chart of one-month GOFO covering the period from before the banking crisis is shown below.

Before the banking crisis GOFO was positive, peaking at 5.3% in August 2007, reflecting a Libor rate of 5.6% giving a premium for Libor over the gold lease rate of 0.3%. This is normal. When the banking crisis hit and the Fed reduced interest rates to zero, one-month Libor fell to 1.4% on November 20, 2008, and one-month GOFO went negative for three days in succession and two-month GOFO for two of those days.

The collapse in GOFO coincided with the end of a 20% fall in the gold price, marking the start of the subsequent bull market when the gold price more than doubled. Today the gold price has also had a sell-off and GOFO has now been negative for nine days, indicating a higher level of price stress than in the dark days of the banking crisis. Furthermore GOFO is persistently negative for up to three months this time signaling the shortage of deliverable bullion is more acute than in November 2008.

While the forward market in London is showing stress, the same is true on the Comex futures market, where warehouse stocks are dangerously low. The combination of the two with publicly recorded short positions on Comex is an explosive mixture.

The Managed Money shorts on Comex (mainly hedge funds) seem to be completely oblivious to a trap that even a junior trader would recognize. The longs have survived several debilitating bouts of margin calls, so can be assumed to be unshakable, and the bullion banks are now net long, which is highly unusual. The only speculators are the shorts of which hedge funds are the largest identifiable category, and they will be unable to close their positions at anything like current prices.

The UK’s Daily Telegraph recently published an article written by a UK-based hedge fund manager, which concluded that gold’s fair value is $240 per ounce. If his thinking is common to the other Masters of the Universe (as hedge-fund managers were once known) then it explains their actions.

There was an old saying in the London Stock exchange: “Where there’s a tip there’s a tap.” In other words, if someone tells you to buy or sell something he is promoting his own vested interest. It is a pretty good rule of thumb.

My vested interest? I try to stick to the facts. Opinions from economists and traders are to be detected and avoided. I suggest you read the Telegraph article in that light.

See the original article >>

Bernanke "The Only Game in Town": Really?

by Charles Hugh Smith

Of the three games in town, only one isn't doomed: the real economy.


Last year, Senator Schumer (Democrat, N.Y.) famously told Fed chairman Ben Bernanke "You are the only game in town." Really, Senator? What about the real economy? Bernanke and the Fed's machinations are indeed the only game in town for the parasitic financiers, but unnoticed by the Senator, America's real economy is innovating away from the dead hand of the Fed and its toxic spew of free money to the predatory class.

There's actually three games in town: the financier game the Fed is playing that will end in collapse, the Federal government's borrow-and-blow trillions of dollars game that will also end badly, and the real economy, where millions of people don't give a rat's rear-end about Bernanke's latest attempt to placate the financial Monster Id he has created.

Bernanke is irrelevant to millions of people who are building the next economy beneath the rotting soggy mess of the financialized one Bernanke is attempting to resuscitate.

Here is Bernanke's game: Bernanke has managed to stretch Phase II into five years; Phase III will finally begin in the 2014-15 as the unintended consequences of Bernanke's save-the-financial-parasites game take the financial markets by the throat:


Serial asset bubbles blown by the Fed that always pop:


Here is the Federal government's game: Rapidly rising debt:


Diminishing returns on centralization and deficit spending:


Bernanke, Schumer, et al. are trying to revive the Financialization machine, but it's disintegrating as a result of its own toxic output. Meanwhile, the parts of the economy that view Bernanke, Schumer et al. as either impediments or as irrelevant are innovating and evolving.

See the original article >>

Sovereign-Debt Risk – Best and Worst

By tothetick

Sovereign debt is the bonds that are issued by national governments in foreign currencies with the intent to finance a country’s growth. The risk involved is determined by whether that country is a developed or a developing country, whether that country has a stable government or not and the sovereign-credit ratings that are attributed by agencies to that country’s economy. Countries that default on payment will have trouble getting loans in the future (unless you are called Greece, for example and then the troika will systematically have to give you a short back and sides as a haircut, trimming the debt you once had).

But, how are countries perceived as being more or less risky? Nobody would say that today the US economy is raring to go and things are picking up. Economic growth is too slow and unemployment is making few if any breakthroughs.

Take the example of the plight of Detroit today. Detroit is bankrupt and has filed for Chapter 11, in debt to the tune of $18.5 billion. Motor City once had a population of 1.8 million people (1950) but now it has dropped to a dismal 700, 000 today. Companies have upped sticks and moved out of Detroit, suffering from the gangrene of corruption and fraud and resulting in massive drops in fiscal revenue. The average household earns a salary of just $28, 000 a year and 36% of the population are currently living in poverty. Kwame Kilpatrick is now serving a prison sentence for corruption while he held the office of mayor in the town. Only half of the town has street lighting at the present time and criminality is the highest it has ever been for the past forty years. Hardly looks as if it is a sound economy and yet will that have an effect on the US credit rating?

Moody's

Moody's

But, on the other hand despite economic indicators in the field such as in Detroit, the rating agencies are optimistic. The question as to why they might be is a whole different kettle of fish, however. Let’s take the example of Moody’s. Moody’s changed the outlook of the Aaa US economy just a few days ago, replacing the negative outlook that has been slapped on the USA to ‘stable’. According to Moody’s, the Congressional Budget Office prediction is on target to see the budget deficit to fall to 4% of GDP (while it was 7% in 2012). Estimates show that the change in grading has something at least to do with the reduction in the quantity of money being allocated to Medicaid and Medicare. Medicaid will see a fall of $77 billion (2%) and Medicare a fall of $85 billion (1.2%) between 2014 and 2023. But, that’s not to say that spending on health as a proportion of overall spending is not set to rise. It is by 30% over the next decade.

The two examples of how bad and how good the USA economy is perceived and what is actually happening in the USA both have some effect on the perception of the USA by the rest of the world. But, does that have an effect on the risk associated with the country or not? S&P Capital IQ (McGraw Hill Financial) has just published a report showing the global sovereign debt of countries listing those that are the worst and those that are the best in comparison with last year. The report uses the cumulative probability of default (the probability of a country not being able to honor its obligations in terms of debts). So where does the USA stand today?

The USA is still one of the least risky sovereign credits in the world today. It has moved up from 5th position this time last year to 4th today. Its Cumulative Probability of Default (CPD) stands at 2.44% today. That improvement according to the report is due to the target that seems to be within reach regarding unemployment in the country dropping below 7% at some time in the near future.

The other countries are as follows:

Best

Creditworthiness: Norway 1st!

Creditworthiness: Norway 1st!

  • Norway is in 1st place and the country that has the least risk in the world today in the second quarter of 2013. It has a CPD of just 1.61%. The Norwegian credit rating is Aaa (stable).
  • Sweden comes in at 2nd place with a CPD of 1.94%. The Swedish credit rating is Aaa and stable (Moody’s).
  • Finland is in third position and like the two preceding countries there is no change in the ranking in comparison with 2012. It has a CPD of 2.32%.Moody’s credit rating is Aaa and Negative.
  • Switzerland is in 5th position just after the USA with a CPD of 2.7%, which is an improvement on last year’s 7th place. The Swiss credit rating is Aaa and stable.
  • Denmark is in 6th position with a CPD of 2.74%, dropping two places in comparison with last year. The Danish credit rating is Aaa and stable.
  • Germany also falls by one place with a CPD of 2.85%, in 7th place. The German credit rating is Aaa and stable.
  • Austria has a CPD of 3.49% and improves its ranking by two places (moving from 10th to 7th place). Austria has an Aaa-credit rating and is negative.
  • The UK enters the top ten in the ranking and has a CPD of 4.38%. The UK has a credit rating of AA1 and is negative.
  • The Czech Republic is in 10th position and also is a new entry in the rankings, with a PD of 4.76%. The Czech Republic has a credit rating of A1 and is stable.
Worst

Creditworthiness: Argentina Worst!

Creditworthiness: Argentina Worst!

The worst countries in the world in terms of probability of defaulting on the repayment of their debts is as follows:

  • Argentina is in 1st position and is currently the country that is most likely to default on its debt repayment in the world. It has a CPD of 81.62% and it was also in the same position last year. Argentina has been unable to meet debt repayments since 2001, defaulting as from 2002 on its external debt. Capital fled Argentina and brought about growing problems of borrowing money from that date onwards.
  • Cyprus remains in 2nd position again this year with a CPD of 65.51%. Cyprus was downgraded to junk status by rating agencies and it became impossible to find funding overseas. A €10-billion bailout was provided in March 2013 (on the proviso that the 2nd largest bank, Cyprus Popular Bank, would be closed down).
  • Venezuela is in third position and moves from last year’s 4th position with a CPD of 51.36% chance of defaulting. The presidential elections that took place in April were mired in doubts about the legitimacy of Maduro’s election. There are growing concerns over his ability to implement economic policies that are undermining governability of the country.
  • Greece is a new entry into the listing in 4th position and it has a CPD of 48.56%. Greece’s coalition government is in disarray. The people have taken to the streets amidst the crisis of the laying off of thousands of public service workers and their redeployment to other sectors. Unemployment has hit record levels and in particular youth unemployment which is reaching 60%.
  • Egypt remains in position 5 from last year with a CPD of 46.39%. New political volatility in Egypt means that there is still risk of defaulting on the payments. Furthermore, the economy there has seen very little change at all since Mohammed Morsi was voted into power. Now that he has been ousted, there is growing concern that this will worsen the situation of uncertainty in the country. Total foreign debt currently stands at $44 billion (94% of GDP) and this now looks set to rise in the wake of the coup.
  • Pakistan has a CPD of 45.79% and that is an improvement of 3 places from last year’s position 3. Their bad rating is due to political instability and falling currency reserves in the country. Also, the country will have to pay back $7.5 billion before 2015 to the International Monetary Fund. The ability to take economically-sound decisions is also hindered by the intertwined judiciary, the military and corrupt political leaders.
  • Ukraine moves up from being ranked 6th last year to 7th place this year with a CPD of 44.25%.
  • Portugal also moves up one place from 7th to 8th place with a 30.32% probability of defaulting. Portugal has also seen political tensions over the past few months. Borrowing costs have risen in the last few days to a 7-month high amid demands by Socialist opponents to the government to renegotiate the bail-out deal (€78 billion) with the EU. Unemployment is also at a record high of 18%.
  • Lebanon remains in 9th place with a 29.55% probability. Lebanon’s borrowing cost has increased to record levels over the past ten months as Hezbollah has joined in the war in Syria. The cost of ensuring the debt (which stands at $34 billion) increased as a consequence. This is the single-most important factor of risk for the world: the fact that Lebanon may be dragged into the Syrian conflict more and more.
  • Iraq is a new entry in 10th place with a 27.93% CPD.

    Creditworthiness

    Creditworthiness

So, the least risky countries are the Scandinavians and the worst countries in terms of defaulting are Latin American countries today in the 2nd quarter of 2013. How long will it stay that way? The problem with risk is that the countries that are the ones that have the highest risk of defaulting will no longer be able to find financing, or at most with great difficulty. That means that their situations will only become worse.

See the original article >>

Dollar falls as Fed taper bets recede, currency volatility wanes

By Joseph Ciolli and Lucy Meakin

The dollar weakened against most of its major peers after Federal Reserve Chairman Ben S. Bernanke damped speculation that a reduction of U.S. monetary stimulus was imminent.

The greenback also slid after the People’s Bank of China said it would remove limits on lending rates. The yen gained before upper-house elections in Japan. Indonesia’s rupiah weakened for a record 11th day as the central bank manages a gradual depreciation of the onshore exchange rate toward offshore levels. Bernanke told the Senate Banking Committee yesterday it was “way too early to make any judgment” as to whether a tapering of asset purchases would start in September.

“After Bernanke’s comments this week, it’s clear that the door is wide open for a number of different scenarios, including increasing asset purchases if that becomes necessary,” Omer Esiner, chief market analyst in Washington at the currency brokerage Commonwealth Foreign Exchange Inc., said in a phone interview. “The idea for a September taper is still tentatively on the table, but there is a risk that some softness in U.S. data might ultimately push that back to around December.”

The dollar declined 0.1% to 100.29 yen at 9:01 a.m. New York time after earlier appreciating as much as 0.4%. It has gained 1.1% on the week. The U.S. currency was little changed at $1.3103 per euro, headed for a 0.3% weekly decline. The euro lost 0.1% to 131.47 yen.

The greenback will trade within a range of $1.28 to $1.33 per euro for the coming weeks, according to Lee Hardman, a currency strategist at Bank of Tokyo-Mitsubishi UFJ Ltd. in London. It will probably rise to 102 yen in the next two weeks, before climbing to 110 within six-to-12 months, he said.

Bernanke Report

Bernanke yesterday delivered his semi-annual report on monetary policy to the Senate panel after telling the House Financial Services Committee the day before that he’ll take a wait-and-see stance on stimulus.

The U.S. central bank buys $85 billion of Treasuries and mortgage debt each month as part of its third round of quantitative-easing stimulus to cap borrowing costs. Bernanke said last month the purchases may slow this year and stop in the middle of next year if economic growth meets policy makers’ projections.

“Investors have been reassured that monetary policy will remain in place for the foreseeable future from the major central banks and that’s helping to restore some stability to broader financial markets,” Hardman said

Calmer Markets

JPMorgan Chase & Co.’s Global FX Volatility Index slid to a seven-week low. The measure of currency fluctuations declined to 9.79%, the least since May 29. It touched a one-year high of 11.96% on June 24.

The decrease in volatility shows markets have calmed after concern a reduction in Fed stimulus could start too early and damage global growth prospects, according to Christian Lawrence, a foreign-exchange strategist at Rabobank International in London.

“It’s a reversal of the spike,” he said. “Tapering is not tightening and it seems it took several weeks for this lesson to sink in.”

The Bloomberg Dollar Index, which tracks the greenback against 10 other major currencies, retreated 0.1%, set for a 0.4% decline this week.

“What’s going to be key, particularly following Bernanke’s comments over the last couple of weeks, is the rise in the dollar is going to be very data-dependent,” said Michael Sneyd, a currency strategist at BNP Paribas SA in London. “We think the dollar will continue to strengthen. Actually, at the moment there is quite a good opportunity” to buy the dollar, he said.

Sneyd spoke in an interview on Bloomberg Television’s “On The Move” with Manus Cranny.

Japanese Election

The yen headed for a weekly slide against all of its 16 most-traded peers tracked by Bloomberg. It dropped 1.6% against the euro, the biggest drop in four weeks, and 1% versus the dollar.

Japanese Prime Minister Shinzo Abe’s Liberal Democratic Party and its coalition partner New Komeito are on track to win more than 65 of the 121 upper house seats being contested, according to a poll published in the Nikkei newspaper on July 17. Victory will give the parties control of both chambers of parliament, strengthening the prime minister’s ability to carry out a three-pronged plan of monetary easing, fiscal stimulus and deregulation known as Abenomics.

“The three arrows of Abenomics have clearly gained traction in popularity, and one of the arrows is easy monetary conditions contributing to a weaker yen,” said Greg Gibbs, a senior currency strategist at Royal Bank of Scotland Group Plc in Singapore. A positive outcome for Abe will help him push through further easing that contrasts with “a stronger U.S. economy and tapering of their quantitative policy measures.”

Rupiah Retreats

The rupiah dropped 0.2% to 10,078 per dollar, after touching 10,126, the weakest since September 2009, according to prices from local banks compiled by Bloomberg.

“We expect pressure on the spot rate to continue,” said Thio Chin Loo, senior currency analyst at BNP Paribas SA in Singapore. “Bank Indonesia is releasing its hold. This allows pent-up dollar demand to go through.”

Bank Indonesia Deputy Governor Perry Warjiyo said last week that the monetary authority has supplied dollars to the market in the past two-to-three months while allowing the rupiah to slowly retreat.

Australia’s dollar advanced for the first time in three days as China, the South Pacific nation’s largest trading partner, said it would remove limits on lending rates.

The Aussie strengthened 0.5% to 92.15 U.S. cents.

See the original article >>

Gold gains a foothold after Bernanke’s dovish testimony

By Marcus Holland

Gold futures prices have been forming a based during the past week, and are poised to attempt to move higher.  Bernanke’s testimony on Wednesday and Thursday was perceived as relatively dovish, which eroded the value of the dollar and increased investors’ appetite for the yellow metal.  Mixed economic data in the U.S. allowed U.S. 10-year yields to decline toward 2.5%, which helped gold future prices gain traction.

Federal Reserve Chairman Ben Bernanke was on the hill Wednesday and Thursday giving his bi-annual testimony to both chambers of congress on monetary policy.  His prepared statements focused on the lack of solid U.S. employment and that bond purchases would remain consistent until economic conditions improved.

Perception seemed to have changed and U.S. yields now reflect less of a chance that the Fed will begin to taper its bond purchases in September of 2013.  Over the past week U.S. yields have declined from 2.70% to 2.50%.  The decline in yields has eroded the value of the dollar, which has allowed gold futures prices to edge higher.  One of the issues investors faced in early June was grappling with the Fed comments that bond purchases could be tapered in the near future while economic performance was moderating.  Now that Bernanke has clearly stated that QE will be tied to employment, market volatility should be reduced.

Economic global data was mixed during the past week with the U.K. showing employment strength and analysts reducing GDP prospects in the U.S.  The Claimant count in the U.K. printed better than expected, reflecting an economy that will show modest growth.  U.S. retail sales were worse than expected printing at .4% compared to .8% expected by economists.  Auto’s make up the bulk of the gains, as the ex-autos retail sales number showed contraction.  Growth projections in the U.S. are now less than 1% for the 2nd quarter, which does not warrant a tapering of bond purchase.

Chart courtesy of www.anyoption.co.uk.

Hedge funds have moved back into long futures positions according to the latest commitment of traders report released for the week.  According to the CFTC, managed money increased long positions by 3,300 contracts while they also increased short positions by 2,000 contracts.

The technical picture for gold futures prices is positive, but futures will need to recapture key resistance levels to gain momentum.  Resistance is seen near a downward sloping trend line near 1,300 and then former support levels near 1,324.  Support is seen near the 10-day moving average near 1,271.

Momentum on the August contract is accelerating as the MACD recently generated a buy signal as the spread (the 12-day moving average minus the 26-day moving average) has crossed above the 9-day moving average of the spread.  The index has moved from negative to positive confirming the buy signal.  The RSI (relative strength index) has climbed back to the 50 level which is in the middle of the neutral range.

See the original article >>

China likely to determine fate of dairy prices

by Agrimoney.com

Dairy values are to stay firm for now, although two Chinese dynamics – cuts to infant formula prices, and hefty levels of advance purchases – could yet pose a threat to values.

Dairy commodity prices "should stay supported near current levels" through the rest of the July-to- September quarter, given that supplies are "still fundamentally short" after the poor start to 2013 for production, the US Dairy Export Council said.

Milk production in the top five exporters – Argentina, Australia, the European Union, New Zealand and the US – fell some 2m tonnes, or nearly 3%, year on year in the March-to-May period thanks to a series of weather upsets.

Northern hemisphere output was constrained by cold springs in many countries, while drought dried up production in New Zealand, the top exporter.

"Oceania suppliers have nothing to sell," the council said.

'Bears watching'

However, whether prices can stay high into 2014 "may depend on the needs of China", whose 18% rise in dairy imports in the first five months of this year also played a big part in driving values at GlobalDairyTrade auction in April to a record high, which they remain within 10% of.

The cuts of some 10% by foreign dairy groups - Abbot Laboratories, Danone, Fonterra, Mead Johnson Nutrition and Nestle, as well as Hong Kong-listed Biostime International - to prices of infant formula products, amid a market investigation by Chinese authorities, could weigh on values of whole milk powder, a major ingredient.

"So far that doesn't seem to be the case, but it bears watching," the council said.

'Bought ahead quite a bit'

Furthermore, Chinese buyers may already have covered much of their needs by a 56% rise in whole milk powder purchases in the January-to-May period.

"The world's largest importer has already bought ahead quite a bit.

"We expect there will be some advanced buying toward the end of the year to get product in the pipeline under preferential tariffs from New Zealand in the new year," with China cutting import levies for purchases from New Zealand for a set quota at the start of every year.

"But with so much early shopping, overall whole milk powder import volumes may be close to year-ago levels over the balance of the year."

'Heightened competition'

Separately, National Australia Bank forecast prices remaining firm in Australia over the recently-started 2013-14 season, noting successive rises by processors to the values they are prepared to pay producers for milk.

"The offering of higher farmgate prices by processors reflects the heightened competition for milk in a tight supply environment and boosted confidence for stronger export demand this year, underpinned by a more favourable exchange rate," NAB said.

"Given this, we expect the average export dairy prices to rise by 2% in 2013-14."

See the original article >>

"just how bad the crash will be"

by Marketanthropology

Assuming the SPX continues to put more daylight between itself and the Meridian, we expect these updates will trickle to a halt. For the moment the market has roughly a 7% cushion for the balance of July after backtesting support in June. 
Although we typically don't rely heavily on trend lines for perspective, considering the pivotal history of rejection and support at the Meridian - this one we closely follow.

Click to enlarge images

Despite hitting the relief valve in May, the SPX is loosely following the last time it broke through the Meridian in May 1995.

Rounding things out from the backside of the globe, here's a daily comparative of our Shanghai series. Considering Krugman's timing yesterday and choice of words;

"You could say that the Chinese model is about to hit its Great Wall, and the only question now is just how bad the crash will be."

- we cherish the opportunity to take the other side.

See the original article >>

A bold G20 stance on economic growth could boost risk currencies

By Justin Pugsley

Financial stability, economic growth and jobs creation are likely to be top of the agenda at the G20 summit in Moscow and any commitment to closer global coordination over economic and monetary policies could prove bullish for commodity and risk currencies.

This week's G20 gathering of finance ministers and central bankers (though U.S. Fed Chairman Ben Bernanke is not attending) is taking place amid an increasingly complex economic tapestry. The U.S. Federal Reserve clearly wants to rein in its $85 billion a month bond purchasing program, while Japan is committed to a course of monetary and fiscal stimulus shock therapy.

In the meantime, China wants to purge speculative excesses and curb its shadow banking system, which could result in a recession in the world's second largest economy. As for the Eurozone, much of it remains locked in a depression.

Testimony on Wednesday from Bernanke probably did much to set the tone of the summit. This time he provided much greater clarity to the markets over the trajectory of its quantitative easing program. He effectively said that it would be dictated by the needs of the economy and that there was “no pre-set course” In other words, the jobs and inflation data would do the talking.

AUD/USD – A good barometer for commodity currencies

However, Bernanke did express concern over financial stability, namely that cheap money can fuel dangerous speculative excesses. This might be the real reason for the Fed's desire to phase out quantitative easing and is hoping the economy is strong enough to absorb the rise in 'real' interest rates that are resulting from this stance.

The Eurozone is likely to come under pressure to reverse its austerity programs a move that Germany has strongly resisted until now. However, Germany's own economy is beginning to flag reflecting in part China's slowdown and possibly greater competition from cheaper Japanese exports following JPY's devaluation. Given this backdrop, Germany might become more amenable to fiscal stimulus programs and to more aggressive monetary stimulus from the European Central Bank.

The market will also carefully monitor what the Chinese delegation says and will look for soothing words to suggest their economy will carry on growing despite the speculative purges.

A strong global commitment to economic growth and jobs creation from the G20 with a Fed that is even prepared to up its bond purchases if necessary should set the scene for a rally in currencies such as the AUD, NZD, CAD and GBP vs. USD. It would also be supportive of gold in the short-term, but probably wouldn't trigger a rally as it appears locked in a bear market for the time being.

See the original article >>

The S&P 500 is in the Shark Tank

by Greg Harmon

The S&P 500 made new closing highs yesterday and has been in the middle of a strong uptrend on a long term basis. But on a near term basis it is chum in shark infested waters. The chart below explains. The pattern playing out since the May 22 top has been a bearish Harmonic Shark. It has two alternatives and that is why it is in the middle of these shark infested waters. The first has triggered at 1677.04 and it is fastly approaching the second at 1698.74. The trigger for a reversal is a move lower, preferably in one candle back below 1677. Or if the 1698.74 triggers below that, even intraday

spx shark

would count. The initial price objective lower would be a 38.2% retracement of the range. So, if the move starts lower tomorrow the first target is at 1641.97. The second target is a retracement to the 61.8% movement lower or 1610.36. Both can happen and keep the uptrend in take on a longer term basis. As well, neither could happen and it could just keep going higher. One perspective, and it is your money. You decide.

>">See the original article >>

Joe Friday…Broadest of all markets, has 13-year breakout!

by Chris Kimble

CLICK ON CHART TO ENLARGE

The Wilshire 5000, the broadest of all U.S. Stock index's broke above a 13-year resistance line and retested the old resistance line as support and is pushing higher.

At the same time the NYSE Advance/Decline line is near all-time high levels (see inset chart).

Joe Friday...Broad market looks healthy above the breakout line.


See the original article >>

Commodity hedge funds suffer longest losing streak on record

By Tommy Wilkes

(Reuters) - Funds betting on commodity price moves have lost money every month since January, their joint longest losing streak on record, raising more doubts about their ability to make money at a time when the commodity "supercycle" may be over.

The average fund slid 3.58 percent in the first six months of the year, according to a widely watched Newedge commodity index. Funds have only suffered five consecutive losing months once before, in 2002-2003, the index shows.

Hedge funds market themselves as capable of making money in all markets, yet funds trading commodities as varied as gold, grains and gas, have failed to turn an annual profit in the last three years.

The weak performance will put more pressure on the industry to lower fees and introduce clawbacks, which enable investors to reclaim some performance perks paid to hedge fund managers in boom times if the returns they hope to achieve fail to continue.

Worries about cooling demand in key markets like China, and a huge shift in the supply-side from shortage to glut, has sent prices tumbling in recent years, and left many warning that the end of the commodity "supercycle" - the long period of rising commodity prices - is here.

"Historically most of these funds have been a levered beta play on the commodity cycle, or in some cases arbitrageurs of commodity spreads," Michele Gesualdi, portfolio manager at hedge fund investor Kairos, said.

"The end of the supercycle has hurt the first area, while the volatility and discrepancies that have arisen in forward markets have made life difficult for the second."

Adding to the sector's woes, hedge funds which trade other asset classes such as equities have rebounded this year, including those that trade mining and energy shares.

The $1 billion fund of Clive Capital, a firm which trades oil and ran about $5 billion at its peak, is down 3.5 percent to June 28, performance data shows. Krom River's Commodity Fund has lost 4.4 percent to end-June, while Brevan Howard's Commodities Strategies Fund is off 2.5 percent to June 28.

Krom River's chief executive Itay Simkin said that despite falling prices, commodities were still a very good investment due to production problems, urbanisation, decent economic growth rates and a lack of forward investment in mining.

Other funds mentioned in this story either declined to comment or could not immediately be reached for comment.

Funds trading bullion are nursing some of the heaviest losses. Gold has tumbled this year on expectations the U.S. Federal Reserve will cut back on its money-printing programme, which had driven gold to record highs.

John Paulson, the billionaire U.S. investor, has seen his gold fund, his smallest with $300 million in assets, plunge 23 percent in June and is down 65 percent this year.

Despite the losses, most managers are not down as much as commodity prices this year - the 19-commodity Thomson Reuters-Jefferies CRB index .TRJCRB fell 5.7 percent through end-June.

Some have also shone. After losing 30 percent in 2011 and 7.6 percent and a big chunk of his assets in 2012, Mike Coleman's Merchant Commodity Fund is up 24.2 percent this year.

But the bigger concern for commodity funds is proving they can consistently make money amid a sustained downward trend in prices.

The problem, investors and managers say, is that the long, gradual trend of rising prices has been replaced with shorter, more uncertain trends, in which prices can plunge suddenly, making it difficult to profit from their slide.

Commodity prices, down 22 percent from a 2011 peak, have entered bear market territory, while volatility - which some funds thrive on - has also fallen, challenging managers further.


Watch our Super Commodity system which is gaining even in 2013!

See the original article >>

Russia and the Next Oil Crisis

By: Clif_Droke

On the global market scene, Russia has been one of the major laggards this year. The Market Vectors Russia ETF (RSX), a reflection of the country's stock market, fell 22% from its high earlier this year. RSX was testing a three-year low not more than a month ago and seemed to be in danger of breaking below this major long-term support.

Keeping in mind that the stock market is the single best barometer of future business and economic conditions, as per the old Dow Theory saw, things looked pretty bleak for Russia this summer...that is until the country caught a break from a major development in the commodities market.

Fortunately for Russia, the price of oil has been surging the last few weeks. Russia's economy is heavily influenced by the oil price due to the country's reliance on oil and gas production and exports. As goes the oil price, so goes the Russian economy, according to conventional wisdom. It's not surprising then to see Russia's stock market rally in response to the recent oil price spike.

Crude Oil Daily Chart

Russia's gain, however, is America's loss. As the price of oil rises, it makes the cost of all fuels from diesel to gasoline more expensive. In turn, as fuel costs rise the prices for all consumer goods eventually increase. The gasoline price is a major factor in the U.S. economy and whenever gas prices become excessive it has negative repercussions for consumers. Consider the long-term trajectory of the gasoline price since 2008: after the credit crash five years ago, the gas price has rebounded and isn't far from its previous all-time high.

Gasoline Monthly Chart

The powers-that-be learned back in 1998 the folly of allowing oil prices to fall too low, for it nearly brought down Russia along with the rest of the global economy. Since then we've seen a global subsidization of the oil price to artificially high levels, and most particularly in the price of gasoline. Whenever things start to look bad for Russia, a rally in the energy markets always seems to come to her aid.

You may also recall that the high oil and gasoline prices of mid-2008 were the final catalyst that touched off the economic storm of that year. This isn't to suggest that a similar collapse is brewing, only that the bull market and economic recovery will eventually be imperiled if fuel prices are allowed to keep rising.

A couple of useful barometers to watch in order to gauge the extent of fuel price pressures on the economy are the stocks of FedEx Corp. (FDX) and United Parcel Service (UPS). FDX in particular is still holding up well, while UPS has taken a hit lately. Rising fuel costs always weigh on these two key economic indicators and if FDX and UPS start to flag this summer, we'll have a "heads up" that the fuel price increase will create problems for the economy.

Stock Market

The story of the week was the new high in the S&P 500 Index (SPX). The comeback of the SPX was remarkably fast, though this isn't unusual given the historical tendency for the "megaphone" chart pattern visible in the index to bounce back quickly. Traders may remember a similar megaphone pattern in the SPX from the year 2005; like the current pattern, the megaphone of 2005 had a quick and violent turnaround (see chart below).

SPX 1-Year Chart to May 1, 2006

A similar pattern is playing out this time around with the S&P retracing all of its losses from the past few weeks and culminating in new all-time high.

SPX Chart to July 12. 2013

A liberal rendering of the pattern's boundaries (as I've drawn here), would give us an estimated upside target of around 1,720 - certainly within reach and not entirely out of the question. Already the 1,680 minimum upside objective has been exceeded.

Gold

My late mentor Samuel "Bud" Kress would often use the phrase, "He's caught up in his underwear," to describe an investment advisor who was forced to backtrack after making a blown market call. It would seem that the latest victim of "caught in the underwear" syndrome is the French investment bank Societe Generale.

You may recall that SocGen made an extremely bearish call on gold over a month ago. Back in June, two analysts with investment bank Societe Generale predict that the price of gold will be at $1,200 within the next three months. SocGen's Jesper Dannesboe and Robin Bhar maintained that continued selling of gold by ETFs, coupled with a lack of jewelry demand, would result in the next leg down for the yellow metal.

Dannesboe and Bhar wrote: "We believe that the dramatic gold sell-off in April, combined with the prospect of the Fed starting to taper its QE program before year-end, has resulted in a paradigm shift in many investors' attitude towards gold. This is likely to result in continued large-scale gold ETF selling this year and next. ETF gold selling has averaged about 100 tons per month since the April sell-off. We expect continued ETF selling to exceed higher demand for jewelry/bars and coins. Therefore, we have revised lower our Q4 13 gold forecast to $1,200/oz."

SocGen's Bhar was forced to offer an explanation for gold's recent bottom and mini-rally by stating in a report this week that gold's biggest backwardation since 1999 prompted a "corrective rally" and that strong physical gold demand and "nearby tightness" will persist for the "foreseeable future." SocGen added, however, that negative investor sentiment on the metal still translates into a bearish intermediate-term outlook. The bank also maintains that gold will average $1,150 an ounce for 2014.

In the short-term, at least, the long list of ultra-bearish investment banks are slowly lining up in the short-term bullish camp. The lesson here, as I stated in previous reports over the last few weeks, is that when the investment banks and research analysts all line up on the bearish side of the aisle, the market is virtually guaranteed to disappoint their short-term expectations.

See the original article >>

Cocoa prices rise as grind data fuels deficit talk

by Agrimoney.com

Cocoa futures extended their rally, hitting their highest in nearly nine months in London, after the quarterly processing data season ended on a strong note, with the North American grind rising far more than investors had expected.

The cocoa grind in Canada, Mexico and the US reached 126,044 tonnes in the April-to-June quarter, up 11.8% year on year, the sharpest rise in three years, the National Confectioners Association said.

The increase was far more than the 2-5% increase that investors had expected, and followed unexpectedly strong data from Asia on Wednesday, showing a 2% rise to 153,792 tonnes in the regional grind.

Investors had expected a decrease in Asian volumes, citing high stocks of cocoa powder seen remaining following a buying spree last year, largely at higher values.

Such expectations had gained credence after the grind on Monday when the grind in Malaysia, Asia's top cocoa processor, was shown falling 3.1% to 72,191 tonnes, getting the quarterly cocoa grind reporting season off to a slow start.

'Demand recovering'

The North American data show that "global cocoa demand appears to be recovering further", Commerzbank said.

Indeed, the data could herald an upgrade by the International Cocoa Organization to its forecast of a 0.9% rise in world cocoa demand in 2012-13.

This figure "could prove too low after the latest processing figures from Europe, Asia and North America", the bank said.

"The supply deficit could therefore also be higher than the ICCO's currently expected 60,000 tonnes."

Data revisions ahead?

Expectations for supplies have also taken a knock with a report that Ivory Coast, the top producing country, is expecting a 1.4m-tonne crop in 2013-14, a drop of more than 100,000 tonnes on the result for this season, which ends in September.

This "would also suggest a supply deficit in the coming crop year", an idea which "should lend further upward momentum to cocoa prices", Commerzbank said.

Indeed, New York cocoa futures for September delivery gained 1.0% to $2,370 a tonne on Friday as of 07:00 local time (12:00 UK time), taking to 11% their recovery from a late-June low.

London futures for September reached £1,626 a tonne, the contract's highest since October, before easing back to £1,620 a tonne, up 14% from the late-June nadir.

The rally has also been spurred by Ivory Coast's revelation that it had sold 750,000 tonnes of 2013-14 cocoa forward, more than the market had expected and implying less selling pressure for the market to absorb ahead.

See the original article >>

The Stock Market – Shades of Early 2000?

by Pater Tenebrarum

The Most Speculative Sectors Are Going Wild

Yours truly remembers late 1999/early 2000 well. It was a time that could be best described as 'waiting for the tech crash'. One of the most striking features of the final blow-off surge of the tech mania was its sheer size (the final legs up in the 1920's bubble and the Nikkei bubble of the 1980s were far more subdued by comparison). However, what was even more fascinating was how thoroughly caution was thrown out of the window. Completely worthless paper started to rise, just as long as it could be argued that it had remotely to do with technology. The stories became ever more fantastic as time went on ('superconductor stocks', 'space stocks', you name it). The action finally moved into OTC BB listed and pink sheet stocks, the 'micro-cap' names, most of which no-one had ever heard before. Day traders (a large population at the time) took notice and began to scour the charts of these stocks for 'pretty looking' formations that may result in break-out moves. And rightly so, since many  such moves did in fact happen, even if the underlying companies had never produced a red cent in earnings or revenues, and had no realistic hope of ever doing so.  These days one no longer needs to expose oneself to the 'company specific risk' of micro-caps. Today there is an ETF for everything. Guess which one has just 'gone vertical'.


IWC-micro-capsThe Russell micro-cap ETF IWC goes 'parabolic'. Note the sudden surge in trading volume – click to enlarge.


Of course one must admit that the action these days is different from the full-blown mania of 2000, which was a near perfect reenactment of 1929 in terms of surging public participation and wildly bullish sentiment. Nowadays, even with the indexes at new highs, there is an undertone to the proceedings that feels different. The public is no longer mesmerized by stocks and the get-rich-quick mentality has definitely expired. These days it is mostly professionals bidding stocks up in the hope of greater fools letting them out 'when the time comes' (if all of them realize in real time when that dreaded day arrives, the market will of course go 'no bid'). All in all, it feels more 1937nish than 1929nish.

The micro-caps are accompanied in their manic surge by small cap indexes like the Russell 2000. Usually, outperformance by the Russell 2000 index is considered bullish, and most of the time rightly so. But one must not lose sight of the fact that when such outperformance becomes extreme, it can also constitute a warning sign (just as the normally bullish outperformance of the Nasdaq index constituted one in early 2000).


RUTThe small cap sector goes bananas as well – click to enlarge.


One reason to continue to look a bit askance at this extremely strong performance is the fact that speculators in stock index futures hold their by far greatest net long exposure in precisely this riskiest market sector. In the large and mini Russell contracts combined, this exposure has grown to a record value of $27 billion, by far the largest of any stock index futures contract.


RUT-CoT

A chart of the commitments of traders in Russell 2000 futures (big contract). The value of the total net speculative long position in large and mini Russell 2000 futures combined has reached a new record high of nearly $27 billion - click to enlarge.


Sentiment Divergences

Sentiment surveys generally show an amount of giddiness appropriate to the price action, but what may be more important than this fact is that there exist now both short and long term divergences with prices.

First a look at a short term divergence, between the AAII bull-bear ratio and the S&P 500 Index:


AAII ratioThe AAII bull-bear ratio has moved into extreme territory again, but more importantly, the recent peak represents a divergence from the late 2010 and early 2012 peaks – click to enlarge.


A longer term sentiment divergence can be (inter alia) seen in the Market Vane bullish consensus. Here we compare the 2007 situation to today's:


Market VaneMarket Vane's bullish consensus – a price/sentiment divergence between the 2007 peak and today – click to enlarge.


More Technical Divergences

When looking at the SPX, we were struck by two facts: for one thing, there is now a price/momentum divergence in place as a result of the recent brief correction. What may be more important though is that there is a divergence between the SPX and the strongest stock index in Europe, Germany's DAX. Of course all these divergences may still be erased, but they certainly are a 'heads up' one would do well not to ignore.


SPX-2

S&P 500 Index: momentum divergences and a divergence with the DAX index (the green line below volume) – click to enlarge.


Of course, none of this may matter – as our friend B.C. reminded us today, the SPX and the monetary base continue to track each other very closely, and as we all know, the monetary base is set to continue to rise for months to come.

However, as John Hussman has pointed out a little while ago, there is at least one data series that correlates even better with the US monetary base: the price of beer in Iceland.  Correlation does not always mean causation.


S&P 500 and Monetary Base 2009-The SPX and the US monetary base, via B.C. - click to enlarge.


And slightly off topic, in the context of odd correlations, we would be remiss not to tell our readers about this chart recently posted by 'Not-Jim-Cramer' on twitter. Finally we learn the true reason about global warming: it's not the fault of too much CO2 in the atmosphere, it is too much debt relative to GDP that is the culprit.


temperature anomalyNot-Jim-Cramer unmasks the true reason for global warming – click to enlarge.


Conclusion:

In our last update we pointed out that there were good reasons to be on alert for the possibility that a distribution pattern may be put in place. Since slight new highs have been made since then, no typical distribution pattern has formed yet (and the question whether a major peak has already been seen has been answered in the negative).

Nevertheless, the idea that we could at the very least be on the cusp of a bigger correction has actually been strengthened in light of the above. Especially the blow-off moves in the most speculative market sectors and the divergence between SPX and DAX strike us as important factoids in this context (recall also the previously discussed SPX/emerging markets divergence; it is the fact that divergences are showing up with very high frequency recently that is especially concerning). These are phenomena frequently observed  prior to major trend reversals.

Charts by: StockCharts, Sentimentrader, B.C., Not-Jim-Cramer

See the original article >>

Follow Us