Tuesday, March 29, 2011

OIL PREDICTS STOCK MARKET DIP

by McClellan Financial
Crude Oil Leading Indication for Stock Prices

March 25, 2011

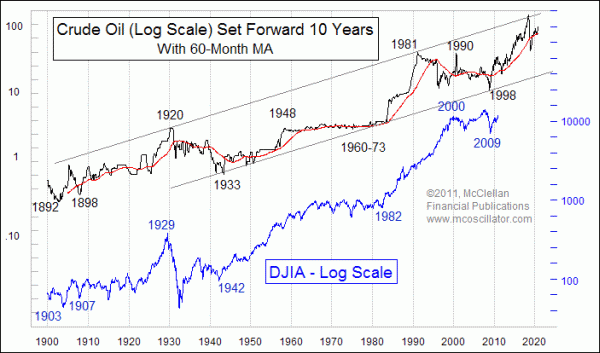
Just over a year ago, I looked at the 10-year leading indication that crude oil prices give for the stock market.  It is time to take another look at that relationship, especially in light of the trouble that it suggests is coming for stock prices.

This week’s chart shows again how the price plot of crude oil prices has done a great job of giving us a macro view of what the trend should be 10 years later for the stock market.  The periods when crude oil prices have moved sideways led to sideways periods for the stock market a decade later.  And the periods when crude oil has trended upward were followed 10 years later by big bull markets in the stock market.

So the fact that crude oil prices have gone from a low of $11/barrel in 1998 to now above $100 is an indication that we should expect a persistent uptrend for stock prices in the decade ahead.  But we should not expect it to be an unbroken uptrend.

When we zoom in closer, we see that oil’s price fluctuations can have important meaning for stock prices about 10 years later.  The timing is not perfect, but the dance steps generally get repeated.
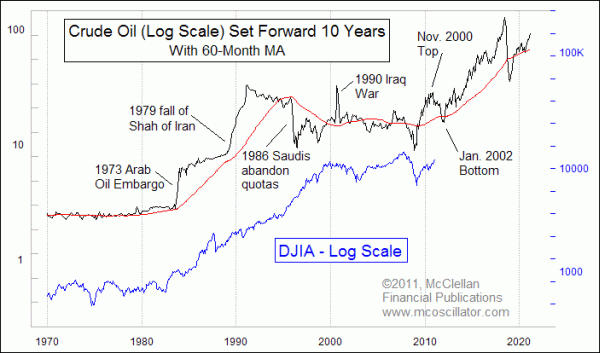
oil's leading indication for stocks since 1970
The one caveat to that principle is that oil price movements that are based on supply and demand forces tend to matter much more than oil price movements brought about by governmental or quasi-governmental forces.  The Arab Oil Embargo in 1973 got the big oil price rise started, but stocks did not match the magnitude of that rise or the additional up leg caused by the Iranian revolution in 1979.  And the oil price crash of 1986 that came about when Saudi Arabia abandoned the production quotas similarly did not bring stock prices down.

The 1990 Iraq invasion of Kuwait caused oil prices to briefly double, but we did not see an exact echo of that spike in the stock market.  When governments put a thumb on the scale and nudge oil prices away from where supply and demand factors would dictate, it does not show up as much 10 years later in the stock market.

Still, the background price pattern movements can clearly be seen as having been repeated in stock prices roughly 10 years afterward.  And now we are into the 10-year echo point of the big oil price decline from Nov. 2000 to January 2002.  So far, the Fed’s POMOs have kept the stock market going higher, so we have not yet seen the echo of that oil price decline being manifested in stock prices.  But given the decades of correlation between stock prices and oil’s leading indication, it is hard to imagine that we will be exempted from seeing some kind of echo of that oil price drop.  When the Fed stops doing POMOs in June, and when the stock market enters the part of the year when seasonality is much weaker, stock prices should finally be allowed to manifest an echo of that 2000-02 oil price decline.

The good news for long term investors is that later this decade we should see stocks echo the big rise in oil prices.  The bad news is that the most likely way for this to happen is not from stocks being worth more, but rather that the dollars needed to buy stocks will be worth a lot less thanks to the Fed inflating the monetary base.  So yes, in the late 2010s, your shares of stock will be worth more dollars.  But those dollars won’t be worth as much.

See the original article >>

ARE STOCKS MORE VOLATILE IN THE LONG-RUN?

by Cullen Roche

Traditional theory has often found that an investor will experience reduced volatility over the long-term.  The implication has led investors to buy into various long-term investment strategies that imply reduced risk.  This study (thanks to Abnormal Returns), however, from Lubos Astor and Robert Stambaugh of the Chicago School and Wharton, finds that stocks are more volatile over the long-term.  While volatility does not necessarily imply risk, the findings are interesting nonetheless.   I’ll expand on the findings in the coming days:
According to conventional wisdom, annualized volatility of stock returns is lower over long horizons than over short horizons, due to mean reversion induced by return predictability. In contrast, we find that stocks are substantially more volatile over long horizons from an investor’s perspective. This perspective recognizes that parameters are uncertain, even with two centuries of data, and that observable predictors imperfectly deliver the conditional expected return. Mean reversion contributes strongly to reducing long-horizon variance, but it is more than offset by various uncertainties faced by the investor, especially uncertainty about the expected return. The same uncertainties reduce desired stock allocations of long-horizon investors contemplating target-date funds.
We use predictive systems and up to 206 years of data to compute long-horizon variance of real stock returns from the perspective of an investor who recognizes that parameters are uncertain and predictors are imperfect. Mean reversion reduces long-horizon variance considerably, but it is more than offset by other effects. As a result, long-horizon variance substantially exceeds short-horizon variance on a per-year basis. A major contributor to higher long-horizon variance is uncertainty about future expected returns, a component of variance that is inherent to return predictability, especially when expected return is persistent. Estimation risk is another important component of predictive variance that is higher at longer horizons. Uncertainty about current expected return, arising from predictor imperfection, also adds considerably to long-horizon variance. Accounting for predictor imperfection is key in reaching the conclusion that stocks are substantially more volatile in the long run. Overall, our results show that long-horizon stock investors face more volatility than short-horizon investors, in contrast to previous research.
In computing predictive variance, we assume that the parameters of the predictive system remain constant over 206 years. Such an assumption, while certainly strong, is motivated by our objective to be conservative in treating parameter uncertainty. This uncertainty, which already contributes substantially to long-horizon variance, would generally be even greater under alternative scenarios in which investors would effectively have less information about the current values of the parameters. There is of course no guarantee that using a longer sample is conservative. In principle, for example, the predictability exhibited in a given shorter sample could be so much higher that both parameter uncertainty as well as long-run predictive variance would be lower. However, when we examine a particularly relevant shorter sample, a quarterly post-war sample spanning 55 years, we find that our main results get even stronger.
Changing the sample is only one of many robustness checks performed in the paper. We have considered a number of different prior distributions and modeling choices, reaching the same conclusion. Nonetheless, we cannot rule out the possibility that our conclusion would be reversed under other priors or modeling choices. In fact, we already know that if expected returns are modeled in a particularly simple way, assuming perfect predictors, then investors who rely on the post-war sample view stocks as less volatile in the long run. By continuity, stocks will also appear less volatile if only a very small degree of predictor imperfection is admitted a priori. Our point is that this traditional conclusion about long-run volatility is reversed in a number of settings that we view as more realistic, even when the degree of predictor imperfection is relatively modest. Our finding that predictive variance of stock returns is higher at long horizons makes stocks less appealing to long-horizon investors than conventional wisdom would suggest. A clear illustration of such long-horizon effects emerges from our analysis of target-date funds.
We demonstrate that a simple specification of the investment objective makes such funds appealing in the absence of parameter uncertainty but less appealing in the presence of that uncertainty. However, one must be cautious in drawing conclusions about the desirability of stocks for long-horizon investors in settings with additional risky assets, such as nominal bonds, additional life-cycle considerations, such as intermediate consumption, and optimal dynamic saving and investment decisions. Investigating asset-allocation decisions in such settings, while allowing the higher long-run stock volatility to enter the problem, is beyond the scope of this study but offers interesting directions for future research.

THE SPECULATIVE PREMIUM IN OIL IS TOO LOW

by Cullen Roche

Interesting findings from Goldman Sachs with regards to oil prices.  This comes from a recent research report from their Commodities Research Team.  In July of 2008 Goldman Sachs famously said the price of oil was not being distorted by speculators.  After a 75% decline in prices they changed their tune and said speculators had in fact distorted prices.  Their retraction said:
“Conversely, speculators bring fundamental views and information to the market, impacting physical supply management and facilitating price discovery. As a result, speculators have a loose relationship with price. In other words, as speculators buy, prices generally tend to rise, and vice versa. Accordingly, speculators also contributed to the extreme price movements over the last two years. For example, new data suggests that speculators increased the price of oil by $9.50/bbl on average during the 2008 run-up. Thus, speculators exacerbated the volatility that was nonetheless rooted in the fundamental imbalance.” (emphasis added)
As I’ve previously stated, I find it hard to believe that there is not a speculative element involved in the price of commodities today.  This is perhaps best seen in “commercial” participants who are now speculating in the markets by hoarding or using various commodities as collateral for financing operations.  Given their 2009 retraction, it’s not surprising to find that Goldman says there is a speculative premium in oil prices currently.  Perhaps more surprising, is their statement that the speculative premium is too small:
“In such an environment, it is not surprising that net speculative long positions in WTI crude oil reached a new record high of 391 million barrels. In comparison, when WTI crude oil prices peaked at over $145/bbl in July 2008, the net speculative long position in the light sweet crude oil contract (future and options) was less than 100 million barrels. We estimate that each million barrels of net speculative length tends to add 8-10 cents to the price of a barrel of crude oil.
Given that net speculative length has been about 100 million barrels higher since the political protests spread from Tunisia and Egypt to Libya (Exhibit 2), this suggests that the oil market has been pricing a $10/bbl risk premium into the price of crude oil due to concerns over potential political contagion to other oil producing states in the MENA region. This is consistent with the fact that Brent crude oil has been trading near$115/bbl in the recent period, $10/bbl above our 3-month target.”
“Crude oil prices fell sharply in a broad liquidation on Tuesday as demand concerns raised by the unfolding events in Japan briefly offset the supply concerns arising from the MENA region. However, net speculative length only declined by 15 million barrels, highlighting the strength of the MENA concerns. Further, as we discuss below, we expect that the increased demand for oil due to the loss of nuclear generation capacity in Japan will far outweigh the demand lost to lower economic activity. More specifically, we estimate that230 thousand b/d of combined residual fuel oil and direct-burn crude oil will be required to offset the nuclear generating capacity lost in Japan. We estimate that to lose a comparable amount of oil demand in Japan would require an 8.0% decline in Japan’s economic activity due to the earthquake and its aftermath.
Consequently, we continue to view a containment of the threat to oil production from the political unrest in the MENA region as the primary downside risk to crude oil prices in the near term, with a downside risk from current prices of near $10/bbl. However, at this time assessing the threat to oil production remains challenging, with the ultimate impact of the initiation of airstrikes this weekend by a coalition including the United States, France, and the United Kingdom enforcing a UN-sanctioned “no fly” zone in Libya still unclear. Further,with reports of protests in Syria and Yemen, hostilities at the Gaza/Israel border, and Saudi troops in Bahrain, the risk of political contagion remains.
These developments suggest that the $10/bbl risk premium may prove too modest, and as the world focuses on MENA and Japan, events continue to unfold elsewhere. This weekend brought reports of a 100 mile long oily sheen spotted on the waters off the US Gulf Coast,20 miles north of the site of last year’s Macondo leak. In the wake of last year’s leak,another leak in the deep water would certainly increase the risk of a reduction in supplies from the US portion of the Gulf of Mexico. Fortunately, the initial tests carried out by the US Coast Guard suggest the “oil sheen” is likely caused by large amounts of sediment, and not fresh oil.
Consequently, the balance of risks to our forecasts remains clearly skewed to the upside,with the primary risk to oil prices over the medium term coming from higher oil prices and their potential to slow the pace of economic recovery.”
See the original article >>

Follow Us