Tuesday, May 28, 2013

Evaluating 3 Bullish Arguments

by Lance Roberts

These are indeed interesting times that we live in.  As the markets elevate higher on the back of the global central bank interventions it is important to keep in context the historical tendencies of the markets over time.   It is not uncommon at major market peaks to see "irrational exuberance" begin to grip the markets.  In March of 2000, a foreign capital inflows drove markets higher, Jim Cramer came out with his 10 must own stocks for the next decade.   By the end of 2002, of the few that were still in business, the destruction of capital was enormous. 

In 2008, as the markets hit all-time highs from a credit/real estate liquidity push, the justification was a "Goldilocks Economy," valuations were significantly less than in 2008 and "market risk" had been fully diversified through derivatives.   Of course, by March of 2009, the bloodshed was enormous.

So, here we are once again with markets, driven by inflows of liquidity from Central Banks, hitting all-time highs.  Of course, the chorus of justifications have come to the forefront as to why "this time is different."

“This market is nothing like 2000!”

“You have to realize just how amazing the markets are right now.”

“The ‘Walls of Worry’ have all been knocked down.”

“The next stop for the markets is simply higher.”

“This market is unstoppable.”

“I haven’t seen a market like this in 30 years.”

These were all things that I either read, or heard, in just the past month.  I even read an article as to why that “This time is different – really!”

Here is an interesting statistic to think about for a moment.

The current rise in the stock market has gone uninterrupted for more than 190 days which is the longest period in the history of the stock market.

Think about that for a moment.

Over the last 113 years of stock market history we are now witnessing the longest rise – ever. Every single time in history, when the markets have gone on extended runs, they have NEVER, not once, lasted as long as the current artificially fueled advance.

There is no doubt that the current advance is quite amazing. However, it is not unstoppable. It will stop. It will correct. Of course, when it does, these same “book talking jacklegs” that made the statements above will have a litany of excuses has to why such a correction was unexpected.  Of course, those excuses won’t replace your lost capital.

Let's review the most common of the bullish arguments.

Valuations Are Cheap

Take a look at the first chart below. First, notice the recent run-up in the market at the far right of the chart. This price action is very abnormal; it is called a parabolic spike, but is similar to what was witnessed at the peak of every previous bull market advance.

However, and importantly, one the primary “bullish” arguments has been valuations. The argument is that stocks are “fairly valued” because valuations reverted to their long term average during the financial crisis.  That is true but also incorrect.

S&P-500-PE-Reversions-052813

If you take a moment to inspect the chart above you will see several very important points:

1) Never in history have valuations ONLY returned their long term average before setting off into the next secular bull market rise. 

2) When P/E reversions begin they continue until valuations have fallen well below the long term average.  As denoted by the blue arrows - bull markets begin with valuations around 5-7x earnings with dividend yields between 5-6%.  It is not uncommon, however, for there to be continued bounces in markets and valuations within the context of the longer term downtrend.  Currently, the markets are trading at 23x cyclically adjusted earnings and 19x reported trailing earnings (1666/87.69). Does that sound cheap to you? 

(Geek Note: You can NOT use forward operating earnings when comparing to historical valuations which are based on trailing reported earnings.   This is the mistake every media outlet consistently makes.)

3.) When markets are in the process of a long term valuation reversion (blue dashed boxes) it is not uncommon for markets to have rallies within the long term decline.  This was seen during the run-up from the 2002 lows which were also believed to be the next great secular bull market.  This is just part of the long term reversion process and resolution of excesses.

4.) It is not likely that this time is any “different” than what we have witnessed in the past. While the interventions by the Federal Reserve can certainly elevate markets short term – the underlying lack of economic and fundamental strength will continue to put downward pressure on the markets. Bottom line – valuations “ain’t” cheap.

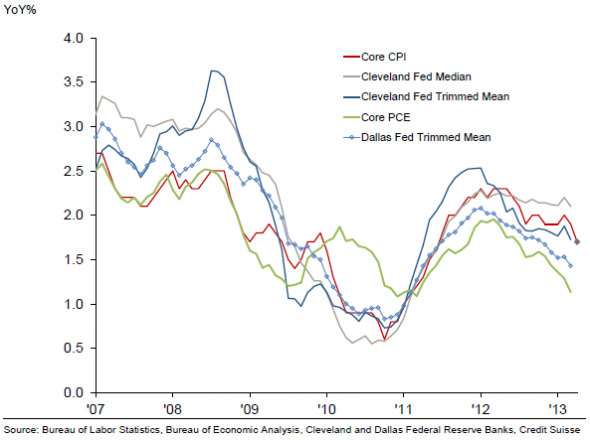
Earnings Have Peaked

Another key "bullish" argument has been the earnings and profitability of corporations. Let's take a close look at reported and operating earnings for corporations since the beginning of 2000.

(Note: The chart is only through the end of 2012 which is the last complete data set from S&P)

S&P-500-Earnings-052813

The problem is that the analysts that try and forecast what earnings are going to do in the future are always overly bullish. The chart below shows what analysts were predicting earnings to be for 2012 through 2013 at the beginning of 2012. What actually happened was markedly different.

S&P-500-Earnings-052813-2

As you can see in the chart above analysts are once again predicting an exceptionally strong increase in earnings per share over the next four quarters. This is a big part of the "bullish" thesis for the "cheapness" of stocks versus other assets.

This view is contingent on several things going right per Goldman Sachs:

1) That interest rates do not rising quickly collapsing the earnings yield gap.  This is a faulty analysis anyway as we will discuss momentarily.

2) That economic stagnation ends and organic growth returns.

3) A continued recovery in labor and housing that is already showing signs of peaking for the current economic cycle.

4) Continued Federal Reserve interventions.

5) Expectations that current valuations remain suppressed by rapidly rising earnings per share.

The chart below shows Goldman Sachs recent forward estimate projections.  The red lines represent the same trend of projections that were prominent during the last two earning cycle peaks.

S&P-500-Earnings-052813-3

All of these assumptions primarily tie back to a rebound in economic growth.  However, as the chart of our economic composite below shows, these estimates are likely to come up fairly short as economic strength wanes.

STA-EOCI-Index-052813

Earnings Yield Myth

The final “bullish” thesis argument is that earnings yield makes stocks a better investment than bonds. I have written about this particular myth several times in the past and you can read the entire article “The Fallacy Of The Fed Model” on the site.

“The bottom line here is that earnings yields, P/E ratios, and other valuation measures are important things to consider when making any investment but they are horrible timing indicators. As a long term, fundamental value investor, these are the things I look for when trying to determine "WHAT" to buy. However, understanding market cycles, risk / reward measurements and investor psychology is crucial in determining 'WHEN' to make an investment. In other words, I can buy fundamentally cheap stock all day long; however, if I am buying at the top of a market cycle then I will still lose money."

Fed-Model-052813

"It hasn't been just the last decade either with which the 'Fed Model' has continually misled investors. An analysis of the previous history of the concept shows it to be a very flawed concept and one that should be sent out to pasture sooner rather than later.

During the 50's and 60's the model actually worked pretty well as economic growth was strengthening.  Interest rates steadily rose as a stronger economic growth allowed for higher rates which enticed higher personal savings rates.  These higher savings rates were lent out by banks into projects that continued further stimulated economic growth.  However, following that model would have kept you out of the entire bulk of the 1980-90 secular bull market. 

Furthermore, while the model began to work again post the tech-wreck.  It kept you in stocks until after the 2008 crash, where you gave up all of your previous gains only to get back at the beginning of 2011.

The bottom line here is that earnings yields, P/E ratios, and other valuation measures are important things to consider when making any investment but they are horrible timing indicators. As a long term, fundamental value investor, these are the things I look for when trying to determine 'WHAT' to buy. However, understanding market cycles, risk / reward measurements and investor psychology is crucial in determining 'WHEN' to make an investment. In other words, I can buy fundamentally cheap stock all day long; however, if I am buying at the top of a market cycle then I will still lose money.”

Currently, that "yield spread" is contracting.  The problem, as stated above, is that if interest rates rise to 3% or 4% in the near future then the Fed Model will once again signal a move to bonds and out of stocks.

Rising interest rates are potentially a huge problem for the markets and the economy.  Rising rates increase borrowing costs, carrying costs, mortgages while reducing profitability, consumption and production.  If the prognosticators of a bond market reversion are “right,” like Bill Gross, it will not be good for stock market investors.

Riding The Bull

The Federal Reserve bond purchases are like a pool of water with only one outlet with only one place to flow - the equity market.  If you are an adept trader there is likely some money left to be made.  However, if you aren’t, you will likely wind up losing a large chunk of your principal balance when prices revert.

The market is currently at extensions that are usually only seen at major market peaks as I discussed recently:

“Market prices are subject to gravity (the long term moving average) and the longer the duration of the moving average the greater the 'gravitational pull' that exists.  One way to measure extremes of price movement is through the use of standard deviation. One standard deviation from the mean (average) encompasses 68.2% of potential outcomes within a given distribution of data which, in this case, are market prices.  Two standard deviations encompass 95.8% of all potential outcomes while three standard deviations encompass 99.8% of all potential outcomes."

The chart below shows a weekly chart, which is a very slow moving analysis, of the S&P 500 overlaid with Bollinger Bands which represent 3 standard deviations of a very long term (50 Week)) moving average.

S&P-500-BollingerBands-052313

“At the peaks of the "Internet Bubble" and the "Credit/Housing Bubble" the market never got significantly above 2-standard deviations.  Today, we are encroaching well into 3-standard deviation territory.  Standard deviation analysis tells us that roughly 99% of the potential movement in prices, from the bottom of the correction in 2011, has been achieved.  Furthermore, the extension of the market above the long term moving average is also at levels that have previously been associated with major market tops."

The current level of overbought conditions combined with extreme complacency in the market leave unwitting investors in danger of a more severe correction than currently anticipated.  A correction to the long term moving average (currently around 1465) would entail an 12.06% correction.  A correction to 3-standard deviations below the long term moving average (which is most common within a mean reversion process) would slap investors with 20.1% loss.

If you don't think a 20% loss is possible all you have to do is look back to the summer of 2011 when the "Debt Ceiling Debate" sent investors running for cover under the threat of a government bond default. (Oh, and by the way, that same debate is rapidly approaching in the next month or so.)

There is virtually no “bullish” argument that will withstand real scrutiny.  Yield analysis is flawed because of the artificial suppression.  Equity risk premium analysis, the subject of an upcoming post, is flawed for the same reason.  However, because the optimistic analysis supports the underlying psychological greed - all real scrutiny that would reveal evidence to contrary is dismissed.  However, it is "willful blindness" that eventually leads to investor sorrow.

We remain long the stock market, for now, as long as the markets remain in their bullish and positive trend. However, we do so with hedges in place along with very tight loss limits.  When the current "exuberant" trend ceases to exist so will our participation in the market.

As stated above, this is a dangerous market as the current extension is only seen at major market peaks, however, such extensions can go further, and for longer, than you can imagine.  The problem with markets, such as these, are that they resemble a game of "musical chairs” – unfortunately, the major market players will already be seated before the music stops leaving the average investor out of the game.

See the original article >>

What's next for wheat?

By Gary Kamen

July 2013 Chicago Wheat opened last week at $6.8125 per bushel and closed the week at $6.9750, but not before hitting a high of $7.09 for the week.

Global ending stocks for 2013/2014

In the May WASDE global ending stocks are projected to be at 186.4 million tons, up 6.2 million tons from last year. The 51.2 million ton increase in foreign production will more than offset the lower forecast production in the U.S. If recognized the forecast 701.1 million ton global production for 2013/2014 would be a record that is up 45.5 million tons from 2012/2013. So with the knowledge of global supplies, keep a sharp eye on how “big money” is posturing. U.S. Winter Wheat condition does not look as if it will take a toll on global supplies. Keep an eye on corn prices as a rising prices may help bring up wheat, but overall watch the strong trend down.

COT Data

The past week in the Disaggregated COT we saw the bearish posture continue with Producers dropping net shorts from -66,533 contracts to -41,459 contracts. And see how Managed Money added increased net shorts from -20,916 contracts to -46,565 contracts, now with a larger net short position than producers. And do not forget about the Swap Dealers moving from 106,031 contracts net long to 107,757 contracts net long. 

If you need help understanding how to understand how to use the NEW COT report to your benefit get instant access to my new e-book "What Lies Beneath ALL Trends". It is filled with eye opening information.Commercial Net Tracker instructions: This form tracks the Commitment of Traders (COT) data for the commodity futures market. This form "looks" at the most recent five weeks of COT data and provides visual indications of the data. A) If the current value is at a 12-month low, the cell will display a red/burgundy background. B) If the current value is at a 12-month high, the cell will display a green background. C) If the current value went from net negative to net positive, the cell will display a blue background (indicating a bullish condition). D) If the current value is both a 12-month high and also went from a net negative to a net positive, the background will be green. You should view the data with green backgrounds to determine if they also went from net negative to net positive.

Technicals

On the daily chart below you can see ADX is now at 24 reflecting a weak trend as the price action heads south of $7.00, and now is the time to look for the range. DI- is now just over DI+ with DI Differential under 5.00. Watch for an increasing DI Diff now to confirm the price drop will continue. Last week we saw Stochastics correct from oversold territory and MACD is now riding just below the signal line with no divergence.

Click to enlarge.

On the weekly chart you can see the drop below the 20-period exponential moving-average took place the week of Dec. 10, 2012 as you see “big money” move into a bearish posture and weekly ADX started moving above 20 and DI- crossed over DI- with and increasing DI Differential that followed.

Have a prosperous trading week.

See the original article >>

Timing the final bottom in silver

By Przemyslaw Radomski

We would like to start with a question from one of our subscribers today, as we believe that it is a good way to show the distinction between tools that help you spot what direction the market is about to move and those that are better suited to time the exact reversal point, which is – in current circumstances – the final bottom in gold, silver and the whole precious metals sector.

Q: (…) One thing that I do is to look for price divergence with RSI and MACD and that is evident in the charts. Price has hit a lower low and RSI and MACD have hit a higher high/low. To me that indicates a possible good time to buy GDX, GDXJ and mining stocks. This is a volatile time so it would be difficult to hold through this period.  (…) Also $BPGDM is at zero and can't go any lower. (…)

There are divergences in numerous indicators now - such as RSI and MACD - on numerous precious metals-related indices and for individual mining companies. This, however, has been the case for some time. For instance on the GDX ETF chart you can see that the early April low was accompanied by a higher low in the RSI indicator, and preceded by a move higher in MACD. The early March bottom was also accompanied by a higher low in the RSI indicator.

The point is that divergences are good in showing that a given move may be running out of steam, but are not that good when it comes to determining whether the bottom is in or not. With a reverse parabola in gold and a long-term cyclical turning point that we wrote about in our last essay, we are quite certain that the end of the decline is near, and that's all that the divergences confirm. They don't suggest whether or not the bottom is already in.

The Gold Miners Bullish Percent Index was indeed at the 0 level and it couldn’t go any lower (it’s a bit higher today). That's true. But miners can. This index was at 0 in 2008 when the final bottom was formed - that's true. However, that's just a one-time event. It has some predictive power, but it's not all that strong as it's not a tendency. Statistically, we would have to see about 30 cases or more to speak of an existing relationship. But putting statistics aside, we would have to see at least a few cases with the same or similar outcome to say that this could be a tendency. Consequently, while the Gold Miners Bullish Percent Index being at 0 is a contrarian bullish factor, we think that other methods of analysis are more important right now.

Having briefly discussed some of the tools to time the final bottom, let’s see such tools in action. Let's move on to today’s chart section with the analysis of the silver market. We will start with the very long-term chart (charts courtesy by http://stockcharts.com.)

Click to enlarge.

In this chart, we saw particular intra-week volatility but prices overall are not much higher, increasing by just $0.25. The week was pretty much flat and very little changed with respect to price or outlook.

Getting a closer look at this chart shows further similarities with the declines of 2008. We saw a 3 week consolidation period after the initial plunge before prices moved lower once again. Note how silver moved lower back then after initially correcting and closed the week close to the previous local low that ended the previous sharp decline. This is about where we are right now.

Based on weekly closing prices, we already have a breakdown below the early April low which is another confirmation of the similarity between now and 2008. The self-similarity now suggests increased volatility and a big decline ahead.

Now, let’s turn to silver:gold ratio as it is yet another tool that – thanks to self-similarities – helps us time the upcoming bottom.

Click to enlarge.

We saw no significant underperformance of silver this week. The ratio has pretty much traded sideways for several weeks now. Although there was a bit of inter-week under- performance, it is much less visible than what we would expect based on the declines seen in 2008. The implication is that the final bottom is probably not yet in.

In the short-term SLV ETF chart, once again we see that prices moved higher early in the week and this move was strongly invalidated on Wednesday with volume levels nearly as high as Monday and Tuesday combined. Prices did move higher on Thursday but volume levels were pretty much average, actually a bit weak if compared to volume levels of the past week, and less than one-fourth of what they were the previous day, so the move to the upside did little to change the overall outlook here.

Summing up, the situation on the silver market does not look all that bullish. The cyclical turning point suggests a bottom in a week or so but we feel a need to see this confirmed by other markets. Placing our trust in this tool alone does not seem sufficient at this time. Even though we see divergences between many indices and particular mining stocks and main technical indicators, they only support the claim that the final bottom is about to form, but give no direct clues as to when exactly it is going to be formed. Here, the self-similar patterns seem more reliable and the best idea in our opinion is to wait for more decisive signals.

See the original article >>

Leading indicator is limit down today, losing 25% of its value in 70 days!

by Chris Kimble

The Power of the Pattern reflected that a key economic asset could fall 50% in value back on 3/18, due to 20-year channel resistance and 75% bulls. (see post here)

Lumber was trading at $385 at the time, today lumber is limit down trading at $287, losing 25% of its value in 70 days!

CLICK ON CHART TO ENLARGE

The above chart reflects that 100% of the time Lumber hit the top of its trading channel, it has fallen at least 50% in value, over and over for the past 20 years! I doubt that many of you trade lumber and many of you might be saying...."why should I care about Lumber, I don't own it!"

Lets look at lumber a little closer...The bottom of the channel was hit in 1995, 2001 and 2009, not bad times to be looking to buy stocks at low prices. The last serious decline by lumber took place in early 2011. What did the S&P500 do after this lumber decline?  SPY declined 17%, peaking in May of 2011.

Lumber is not the "Holy Grail" of stock market indicators, yet often times it has paid to respect it at the top and bottom of this 20-year channel and its message for the stock market!

See the original article >>

Sugar proves not so sweet

By Sholom Sanik

Sugar prices continue to trend lower and are now trading at a three-year low. According to the International Sugar Organization (ISO), there will be a global production/consumption surplus of 8.5 million tonnes for the 2012-13 marketing year. The ISO forecasts another surplus for the new crop year, albeit a much smaller one. The bears are firmly in control – for now.

Three issues warrant careful consideration, though, and could confuse complacent bears.

The Brazil center-south region, where 90% of the county’s sugar is grown, is set to harvest a record cane crop. Sugar output is estimated to be more than 10% higher than last year. That is a tentative estimate, though. There are ample reasons for ethanol production to surprise on the upside. First, the mandated ethanol blend was bumped up by the government on May 1, to 25% from 20%. The government has pursued a rather aggressive campaign to increase ethanol usage. It has also cut sales tax on ethanol and raised petroleum prices. The current estimate for the ethanol/sugar ratio is about 60/40. Based on the incentives the government has initiated, it’s a good bet that the ratio will increase to favor more ethanol consumption.

The next issue is cost of production. At current world prices, sugar production is not a highly profitable business. Production costs vary widely, depending on the region and the particular mill. One estimate puts Brazilian production at between 17¢ and 22¢ per pound. This could have an immediate impact on mill production and could influence future planting intentions, unless, of course sugar prices begin to rise. In the near term, producing and selling ethanol would seem to be more profitable and will help shift the ethanol/sugar production ratio even higher. Where the option exists, farmers will decide to cultivate more profitable crops.

Finally, there is India. Over 50% of sugar growing regions lack the benefit of irrigation and rely strictly on rain. Some regions in the south and the west of the country that received less than half of normal rainfall levels last year are still suffering from drought. Early estimates for the quality of the June through September monsoon were optimistic. More recent forecasts put the arrival date at June 3, still within the normal range, but possibly late by a few days.

It is far too early to consider this forecast problematic. It should be pointed out, however, that the last weak monsoon in 2009 slashed Indian output and turned the typically self-sufficient sugar producer into a net importer of sugar. Sugar prices eventually soared to above 30¢ per pound.

While the effects of low sugar prices have not yet been felt in a huge way in Brazil, the disincentive has already manifested itself in India. As of a recent estimate, plantings for the 2013-14 crop are down 10% in some areas. Should this turn out to be an indication of a more widespread downturn in acreage, it would result in a drawdown of inventories. Total production would be about 22 million tonnes, down from 24.5 million tonnes in 2012-13 and about 1 million tonnes or more below domestic consumption. Ending stocks levels would be adequate to meet the domestic shortfall, but India would certainly have to halt its exports or risk drawing inventories down to a level that the government would clearly find unacceptable.

Chart 2 shows a sharp drop in open interest during April, but over the past couple of weeks the shorts came right back. Open interest is right back up near the top of the range. There was obviously some short-covering as the May contract headed off the board, but there was no wholesale shift of sentiment among commodity funds. Commitment of Trader data indicate that the net-short speculative position is back to its highs.

We’ve steered clear of recommending a long position in respect of a classic downtrend. We do believe, however, that what appears to be an overwhelmingly burdensome supply side can spin around in an awful hurry with any crop problems in India. That’s for the near term. For the longer term, we are confident that we will see smaller output from producing nations. Buy out-of-the-money call options. And whatever you decide, do not be short this market.

See the original article >>

Cotton falls on weak Chinese economic data and low demand

By Jack Scoville

General Comments:  Futures were lower again Friday in response to weak Chinese economic data and on demand concerns in general.  The export sales report last week was strong, but not strong enough to offset the bad news from overseas.  The weather has improved in all areas with some precipitation in Texas areas and drier weather in the forecast for the next few days for the Delta and Southeast.  Traders also were looking for new signs of demand, but are not finding much new.  Ideas are that the demand can continue for now as China moves to increase its stocks.  Planting conditions for the next crop remain a problem in the US.  Dry weather is forecast for the Delta and Southeast, and warm weather is expected in Texas this week.  Ideas are that farmers can get a lot of planting done with dry and warm conditions.

Overnight News:  The Delta and Southeast will see dry conditions or afternoon showers, but better rains this weekend.  Temperatures will average near to above normal.  Texas will get mostly dry weather, but showers are possible on Saturday.  Temperatures will average mostly above normal.  The USDA spot price is now 77.03 ct/lb.  ICE said that certified Cotton stocks are now 0.509 million bales, from 0.511 million yesterday.

Chart Trends:  Trends in Cotton are down with objectives of 80.90 July.  Support is at 80.10, 79.00, and 78.10 July, with resistance of 82.20, 82.90, and 83.60 July.

FCOJ

General Comments:  Futures closed slightly lower in consolidation trading after the rally Thursday in response to forecasts from NOAA for an active to very active hurricane season this year.  It was a positive close and a positive week, and more rallies are now possible.  Traders are wrestling with more reports of losses from greening disease on the one side and beneficial rains that have hit the state on the other.  Greening disease and what it might mean to production prospects continues to be a primary support ítem and will be for several years.  Irrigation is widespread, even with recent rains.  Temperatures are warm in the state.  The Valencia harvest is continuing.  Brazil is seeing near to above normal temperatures and dry weather, but some showers are possible late this week.

Overnight News:  Florida weather forecasts call for scattered afternoon showers through the weekend.  Temperatures will average near to above normal this week and near normal this weekend.  

Chart Trends:  Trends in FCOJ are mixed to up with objectives of 160.00 and 177.00 July.  Support is at 145.00, 144.00, and 139.00 July, with resistance at 150.00, 153.00, and 156.00 July.

See the original article >>

Play How Far Can Utilities Drop?

by Tom Aspray

The ability of the market to absorb the fairly heavy selling after weak openings on Thursday and Friday was a positive sign for the market that must make those on the short side of the market nervous. The stock index futures are showing strong gains in early trading.

As I reviewed in last Friday’s Week Ahead column, there is plenty of economic data out this week starting with the S&P Case-Shiller HPI before the opening, followed by Consumer Sentiment.

One sector that has been hit very hard in the past four weeks is the utility sector as the Select Sector SPDR Utilities (XLU) is down 6.3% from its high while the Spyder Trust (SPY) is down just 2.2% from its highs. This selling in one of the traditional safest sectors could be a reaction to the increasing bullishness of individual investors as they move to more speculative issues. Alternatively, it could be a sign of concern over some of the utilities’ high debt levels that could make them more vulnerable if rates do move higher.

A technical look at the widely followed utility ETF, as well as three utility stocks, suggests that they can still drop further over the next month or so. All three of these utility stocks have current ratios over 1.5. It is the ratio of current assets to current liabilities and provides a good measure of a company’s ability to pay its dividends over the next 12 months.

chart
Click to Enlarge

Chart Analysis: The chart of the Select Sector SPDR Utilities (XLU) yields 3.7%. It tested its weekly starc + band every week in April and last week’s 4% drop took it back to the weekly starc- band.

  • The 20-week EMA has also been tested, as well as the support from the early 2012 highs, line a. The quarterly pivot is at $37.75.
  • The 38.2% retracement support from the 2011 lows and the uptrend, line b, are both in the $35.50-$36 area.
  • The relative performance has been diverging from prices since late 2011, line c, as it just barely broke its downtrend at the April highs.
  • The RS line has just violated support suggesting it is still lagging the S&P 500.
  • The OBV has been much stronger as it moved well above the 2011 and 2012 highs early this year.
  • The weekly OBV has good support at line e, and the monthly OBV also confirmed this year’s highs.
  • Initial resistance now at $39.80-$40.40.

CMS Energy CMS Energy Corp. (CMS) is a $7.32 billion utility, which operates primarily in Michigan and currently yields 3.7%. It has a current ratio of 1.54.

  • CMS triggered an LCD three weeks ago (see arrow) and is down 8.2% from its high at $29.98.
  • The quarterly pivot is at $26.78 with the 38.2% Fibonacci support at $25.
  • The 50% support is at $23.43. Typically, high probability entry levels come between the 38.2% and 50% support level.
  • The relative performance did make new highs before reversing sharply and dropping back below its WMA.
  • The weekly OBV did confirm the price highs, and though it is declining, it is still well above its WMA and the support at line h.
  • There is resistance now in the $28.80 to $29.50 area.

chart
Click to Enlarge

Cleco Corp. (CNL) is a $2.80 billion electric utility that operates in Louisiana and Mississippi and currently yields 3.13%. It has a current ratio of 1.68.

  • CNL spiked to a high of $49.03 in early May and formed a doji. The following week an LCD was triggered.
  • The 2012 high at $45.30 is not far below current levels with the 38.2% retracement support at $42.11.
  • The 50% Fibonacci retracement support stands at $39.79.
  • The relative performance failed to make new highs with prices, line c, and is now testing support, line d.
  • The OBV is still holding up very well as it is trading near its recent highs.
  • The OBV is well above its WMA and the support at line d.
  • There is resistance for CNL at $48.80-$49.40.

Idacorp, Inc. (IDA) is a $2.43 billion utility that has a current dividend of $1.52 and a yield of 3.10%. It has a current ratio of 1.50.

  • IDA is holding close to its recent highs at $50.16 with the quarterly R1 resistance at $49.96. The R2 level is at $51.95.
  • The relative performance has been diverging from prices and is well below its WMA.
  • There is next support for the RS line at line f.
  • The weekly OBV did make marginal new highs this month though volume was high last week.
  • Good support for the OBV is at line g.
  • There is first good support for IDA at $45.67 with stronger at $43.50-$44 (line e).

What it Means: As I pointed out in Eyes On Income, the current trend for yields is higher as short- and long-term rates are trying to complete weekly bottom formations.

The current outlook suggests that the utilities could drop another 5-8% over the next month or so. I think this will be a good buying opportunity, especially for the income investor.

For example, if CMS Energy Corp. (CMS) drops to $24.25, its yield would rise to 4.2% from 3.70% currently. I now only have a recommendation in the Select Sector SPDR Utilities (XLU), but will be watching the key levels of support for the others.

How to Profit: For Select Sector SPDR Utilities (XLU), go 50% long at $37.14 and 50% at $36.34, with a stop at $34.91 (risk of 5%).

See the original article >>

Reading Tea Leaves after The Nikkei Sell-off

By Michael Lombardi

The one-day sell-off last week in Japan’s equities market with the benchmark Nikkei 225 plummeting more than seven percent in one day should not be ignored; in fact, the drop may be a harbinger of things to come. I don’t have a crystal ball, but my market sense is tingling.

The reality is that the sell-off in the equities market was not a surprise, given that the Nikkei has advanced 70% over the past six months. And this advance was driven largely by Prime Minister Shinzo Abe’s aggressive 10-year stimulus strategy to jumpstart the dormant Japanese economy.

Yet what was more concerning was the lack of a follow-through by the Nikkei equities market after the sell-off, as the index rallied a mere 0.9% the following day.

Nikkei equities market

Chart courtesy of www.StockCharts.com

The market’s fear is that if the selling continues on the Nikkei, this could drive down confidence in the equities market and trigger deeper losses on the horizon, including declines in domestic trading.

The Japanese equities market could easily go lower, given the advance so far.

For Prime Minister Abe, should the Japanese equities market reverse course and decline, the move would likely erode confidence in Japan and test Abe and the country’s resolve.

In my view, as I have discussed in these pages in my previous commentary on Japan (read “Japan Not Home-Free Despite Strong GDP”), the country’s aggressive fiscal and monetary policy is not a sure bet to get Japan out of its economic abyss.

In fact, the aggressive printing of money in Japan will create a bloated national debt level on the country’s balance sheet, which is already one of the weakest in the world.

The ability to drive the economy by spending trillions may work in the upcoming years, but I wouldn’t feel good about amassing the amount of debt that Japan is.

The sell-off in the Nikkei equities market could make investors uneasy on this side of the Pacific.

Domestically, the market is concerned about the Federal Reserve looking at a possible reduction of its bond-buying program as early as June during the Federal Open Market Committee (FOMC) meeting that is scheduled for that month.

The fear is that more selling in the Nikkei equities market may trigger deeper losses to come not only in Japan, but elsewhere; so there may be some apprehension to jump into stocks at this point.

The chart of the S&P 500 below suggests that a possible correction may be in the works, as shown by the ovals. Note also that in 2012, the S&P 500 gained a mere seven points from May 1 to October 31—historically the weakest six months for stocks, according to the Stock Trader’s Almanac—but advanced 13.4% for the year, so we could be headed for some slack.

S&P 500 chart

Chart courtesy of www.StockCharts.com

I would want to see a bigger sell-off here before considering injecting new capital into stocks.

Again, while the advance has been financially rewarding, I still feel a correction is on the horizon. A big sell-off could be an opportunity to buy.

See the original article >>

Wall Street climbs 1 percent on central bank comments

By Ryan Vlastelica

  • Traders work on the floor at the New York Stock Exchange, May 21, 2013. REUTERS/Brendan McDermid

    Reuters/Reuters - Traders work on the floor at the New York Stock Exchange, May 21, 2013. REUTERS/Brendan McDermid

NEW YORK (Reuters) - Stocks rallied more than 1 percent on Tuesday as supportive comments from central banks around the world reassured investors that monetary policies designed to support the global economy would remain in place.

Equities have been closely tethered to monetary policy, with major U.S. indexes last week posting their first negative week since mid-April on lingering concerns that the Federal Reserve may scale back its stimulus measures sooner than expected.

Both the Bank of Japan and the European Central Bank reaffirmed that their policies would remain in place. On Monday, when U.S. markets were closed for the Memorial Day holiday, ECB Executive Board member Joerg Asmussen said the policy would stay as long as necessary. On Tuesday, BOJ board member Ryuzo Miyao said it was vital to keep long- and short-term interest rates stable.

"Investors want to make sure that everyone is in the same boat, since monetary policy has been the mother's milk of the rally so far this year and there was some concern that policy would be changed or amended," said Paul Nolte, managing director at Dearborn Partners in Chicago.

Monetary stimulus has contributed to Wall Street's gains this year, with the S&P 500 up almost 17 percent. Analysts have also cited earnings growth and relatively cheap valuations as reasons investors have used any market decline as a buying opportunity, helping lift both the S&P and Dow to a series of new highs.

Cyclical sectors, closely tied to the pace of economic growth, are likely to advance on any sign of continued supportive policies. Bank of America rose 1.6 percent to $13.45 while Citigroup Inc was up 2.2 percent at $51.61.

The Dow Jones industrial average <.dji> was up 170.22 points, or 1.11 percent, at 15,473.32. The Standard & Poor's 500 Index <.spx> was up 20.02 points, or 1.21 percent, at 1,669.62. The Nasdaq Composite Index <.ixic> was up 46.86 points, or 1.35 percent, at 3,506.00.

Investors will be watching the S&P's 14-day moving average of 1,647.91. On Friday, the benchmark index briefly fell below that level though it subsequently rebounded and closed above it. If the index remains below that level for a protracted period, it could portend waning momentum.

In the latest economic data, consumer confidence jumped far more than expected in May, climbing to 76.2 from a revised 69 in the previous month. Analysts were looking for a reading of 71.

Home prices rose 1.1 percent in March, according to the latest S&P/Case Shiller data. Analysts were looking for a rise of 1 percent.

Luxury retailer Tiffany & Co reported adjusted earnings and sales that beat expectations, sending shares up 4.8 percent to $79.81, the biggest percentage gainer on the S&P.

Abercrombie & Fitch Co late Friday reported a wider-than-expected quarterly loss, though the loss narrowed from the previous year. Shares rose 1.4 percent to $50.80.

With 486 S&P companies having reported, 66 percent have topped earnings expectations, about even with the 67 percent beat rate over the past four quarters. Only 46 percent of companies have beaten on revenue, lower than the 52 percent rate over the past four quarters.

Omthera Pharmaceuticals soared 96 percent to $13.27 after AstraZeneca agreed to buy the company for $443 million. U.S. shares of Astra gained 2.4 percent to $53.42.

See the original article >>

Lagging Energy stocks break from bullish ascending triangle!

by Chris Kimble

CLICK ON CHART TO ENLARGE

I shared with Premium members last week that a bullish ascending triangle was taking place in Energy ETF (XLE) and that a breakout should be owned.  XLE has reflected relative weakness compared to the S&P 500 over the past 90 days, reflected in the lower left inset box.

This breakout is a positive for XLE, which could cause XLE to reflect some relative strength compared to SPY in the upcoming weeks. 2008 highs are the next key resistance level for this ETF, around 10% above current prices.

See the original article >>

VIX readers start to weigh on stock market uptrend

By Jeff Greenblatt

Many of you know me as the guy who nailed the turn of the 2007 bear market six months ahead of time. What I told many of you in April 2007 was an important time window was developing for September/October that had the potential to be the most important turn of the decade. I was wrong. It turned out to be the most important turn of our lifetime. Up to that time, our work had nailed just about every important market turn since 2001. I had good mentors. I learned a lot about market timing from Bob Prechter. I’ve been in this market timing game for over 14 years and rarely have we missed an important window on any important index. I’m not meaning to pound my chest; just trying to prove a point, so bear with me for a minute.

Let’s face it. The star of the game is always Gann or Fibonacci. It’s never me. The best any of us could hope to do is identify and recognize when the windows materialize.

Fast forward to October 2012 where we had the next great time window that was five years off the 2007 top and 10 years off the end of the Internet bear bottom. Certainly we got the reaction but in no way was it what bears hoped for. Were they capable of more? Who knows? They got marginalized so badly in 2011. But there was a correction and then a bottom when members of Congress got together for that photo opp at the beginning of the fiscal cliff negotiation.

We got that turn as the sneaky bull turned up again. A major window was marginalized. Then we had the next turn in March at the Gann master time window. We got that turn too, as Europe peaked, but that selling cycle didn’t last either. What gives? A couple of weeks back we hit 233 days off the June low from a year ago. We are also beyond 233 weeks off the November 2008 bottom in the NDX.

The best I can come up with here is that market timing doesn’t work anymore. To corroborate that view the VIX has been super low for almost a year and a half. That doesn’t work anymore either. It seems that we’ve reached a new era where traders expect low volatility and are getting it. Markets continue higher so obviously we don’t need to pay the VIX any attention.

In fact, because market timing and the VIX don’t work anymore, we must come to admit the Random Walk crowd was right all along. Malkiel and his buddies were on the money all along. You know them. They are the guys who tell you to be invested all the time so you won’t miss the six biggest days in the market because you can’t time markets. In fact we can go so far as to say technical analysis doesn’t work either. Perhaps we should just do what the fundamental crowd suggests and just buy good companies.

So because you know me as the ultimate market timing guy, if I’m coming here to tell you market timing doesn’t work anymore you should consider using me as a contrary indicator, right? If I’m telling you all this, I must be losing my mind, right?

April Fools.

It’s not even April.

Okay, now that I got your attention, let’s get to brass tacks. There’s a point to this discussion. The more this rally goes on, the more you are going to hear from folks that in fact, truly the VIX doesn’t work anymore and we’ve reached a new era of low volatility. You might as well hear it from me first than from some talking head on television who couldn’t tell a flag pole from a flag pattern.

First of all, the VIX does work, it’s an iron law. When it gets low it will cause the market to turn eventually. We have good precedent for this. It bottomed at the end of 2006 and it took roughly 7 months (the Russell) to get the first important turn. So if you want to be lulled into complacency, be my guest. It’s just going to take the patience of a saint to see this turn.
Here’s the problem with the timing cycles right now. The SPX is in the path of least resistance up.

Those of you who follow my work know I got long term bullish probably before most people. Our take on the 2011 turn was it was likely to be of intermediate level damage but not likely to challenge the 09 Haines bottom. That’s because we had numerous calculations that suggested the 09 bottom was a generational low. So far, that has worked. We are seeing the payoff to all of those calculations and symmetries right now. In fact, market timing does work because that wonderful photo opp we had in November with Boehner, Pelosi, Reid and Mitch McConnell happened within a day of the NASDAQ being down 386 points in about 39 days. See, the problem isn’t that market timing doesn’t work. The problem is its only validating on the bullish side.

But one of the problems we are having getting a turn is Andrews on this chart and I want you to think of Andrews the same way you would the Jetstream on The Weather Channel. Once it gets above the mid line, the stream is heading a certain way and it will take more than a few measly time windows to reverse a freight train. That’s why all of nice symmetry we’ve seen since March has bit the dust.

Then we have another problem. I’m not going to comment here on the AP, Benghazi or the IRS scandal. All I’m going to tell you is the psychology has been so negative on the 24/7 news cycle you could cut it with a knife. That kind of sentiment acts as a crowding out effect for those of you who’ve take econ 101. People can’t get euphoric when they are upset with the news. If they can’t get euphoric they aren’t going to top the market out.

But last week we finally did get a reaction to the 233 week window off the November 08 bottom. To this point it’s been mild. I do think we can see a continuation of it and even get a shake of the trees but in no way do I think THIS is the one we’ve been looking for.

What about the answer to the bigger time windows? I’m looking at a few big ones again and I’m really concerned about them. By the end of August we’ll be 161 months off the Internet bubble peak. At the same time we’ll be 233 weeks off the March 09 bottom. These are the biggest windows of the year. Simply because they come around September one had to respect them. Since we have a freight train now, it’s feasible we could be at the back end of a cycle that is completing and we all know when a cycle completes it becomes a one way market. It’s hard to imagine the markets will stay up another 3 months but it’s the end of May and these markets still have any number of upside targets.

So what should we be concerned about? It’s the bond market that worries me. It’s seriously off its high and in recent posts I’ve shown you the longer term chart which is very choppy and I think has the potential to accelerate interest rates to the upside much quicker than the market would like. So what we accomplished last week was a trial balloon by Bernanke to see how markets would react to the potential of the Fed taking away the sugar addiction. The market didn’t like it and that’s why we got that smaller reaction to the 233 week window. But the Fed also left the end of QE open to speculation as to not really upset the apple cart.

Truth of the matter is the Fed really isn’t even in control in the first place. When long term money really wants to turn, it’s going to turn and there’s a possibility it already did. Remember last year when the crowd got really noisy about the end of the bond market bull? They were wrong of course but now that the bond market has dropped from 149 to 142 we don’t hear much talk about the end of a 31 year bull market. That has me really concerned. When the bond market goes, all those people who bought in for fixed income are going to get killed on the principal.

If it somehow manages to stay up and it really needs to hold the 142 level because it’s an excellent demand imbalance point which launched the last rally, it’s only another 3 months to those bigger time windows. Those are the ones I’m watching and since they materialize just at the time of year markets can have a dangerous reaction, now is not the time to get complacent.

See the original article >>

Charts Imply the Threat of Deflation is Still Present

By Dominic Cimino

Although it feels like the threat of deflation has generally been discarded by the investment community, charts seem to imply the threat remains. Even as investors, analysts, and some at the Fed appear more preoccupied with impending inflation, a select group of charts infer that central banks do not have deflation thoroughly at bay. Let's take a look.

The first chart we'll consider is the Goldman Sachs Commodity Index. Notice how the index's all-time high was placed back in 2008! A much lower interim high was subsequently placed in 2011, and a well-defined descending bearish trend channel is in place on the weekly bar chart.

Click to View
Click for a larger image

The next chart is a weekly bar chart for wheat futures. Although wheat future prices are in an established cyclical uptrend defined within the bullish trend channel, prices are precariously close to channel support and are nearly 50% off the all-time high set in 2008.

Click to View
Click for a larger image

Crude oil futures continue to trend below the trend line resistance highlighted in red; while subsequent lower interim highs have been placed in 2011, 2012, and thus far in 2013. The market is currently 36% below the all-time high placed in 2008.

Click to View
Click for a larger image

Copper futures have moved below the trend line support (e.g. in red), and have placed lower interim highs since placing their all-time high in 2011.

Click to View
Click for a larger image

Spot gold prices have moved lower out of the consolidation area of 2011-2013, and are well below the all-time high which was placed in 2011.

Click to View
Click for a larger image

Finally, the U.S. Dollar Index, which when weak can infer inflation, placed its low in 2008, and has recently firmed up once again after moving through the bearish trend line (e.g. in blue) one year ago.

Click to View
Click for a larger image

In conclusion, I'm not guaranteeing deflation or discounting future inflation. Certainly anything is possible during this unprecedented time. I merely want to showcase some charts that are trending lower at the moment, and possibly indicating that a deflationary threat may still exist. Central bank efforts appear to have lifted some nations' stock market values, but key tangible commodities are struggling to move higher; and I believe this should continue to be monitored.

See the original article >>

A Golden Opportunity

by Market Anthropology

In what has become a rite of spring for us - we emerge from the torrent well fed and docile. After feeding in the stream as precious metals bears for the better part of the year - we may even want to be their friends this time.
Although still looking for traction to take hold in the miners, the GDX:GLD ratio comparative we have highlighted since January appears to be tracing out a low with the divergent momentum characteristics we had expected.
All things considered - we'll let you know if nature gets the best of us and we decide to eat our new companions. Until then - consider us golden. 

See the original article >>

Is This Why Europe Is Rallying So Hard?

by Tyler Durden

Spanish and Italian stocks are up 3% this week, European sovereign bond spreads are compressing like there's no tomorrow, and Europe's VIX is dropping rapidly. Why? Aside from being a 'Tuesday, we suspect two reasons. First, Hungary's decision to cut rates this morning is the 15th central bank rate cut in May so far which appears to be providing a very visible hand lift to risk assets globally (especially the most junky)' and second, Spain's deficit missed expectations this morning (surprise), worsening still from 2012 and looking set for a significant miss versus both EU expectations (and the phantasm of EU Treaty requirements). As the following chart shows, Spain is not Greece, it is considerably worse, and the worse it gets the closer the market believes we get to Draghi firing his albeit somewhat impotent OMT bazooka and reversing the ECB's balance sheet drag. Of course, direct monetization is all but present via the ECB collateral route and now the chatter is that ABS will see haircuts slashed to keep the spice flowing. What could possibly go wrong?

Equity markets are melting up...

The Hungarian National Bank became the 15th central bank to reduce the policy rate this month after Israel cut borrowing costs yesterday. Hungary cut the main rate by 25bps to 4.5%, having already lowered it by 100bps since the start of the year. As Bloomberg's Niraj Shah notes, the IMF has warned further cuts may weaken the forint and undermine financial stability.

Spanish Tax receipts and contributions to tax-funded welfare Social Security system through April fell 5.3%; and Interests paid by central govt to service debt rose 11.8% through April from year-earlier period. Spain may be the least likely of any EU country to bring its budget deficit below the region’s ceiling of 3 percent of GDP after the gap widened to 10.6 percent of GDP last year. The IMF forecasts the nation’s debt-to-GDP ratio will rise 7.6 percentage points this year and 5.8 points next year to 97.6 percent, the biggest increase in the euro area.

The European Commission may give Spain, Italy, France and Slovenia extra time to reduce their budget shortfalls tomorrow.

See the original article >>

Percent Change Week over Week

by CME

5 Questions That Every Market Bull Should Answer

by Lance Roberts

There have been a litany of articles written recently discussing how the stock market is set for a continued bull rally.  The are some primary points that are common threads among each of these articles which are that interest rates are low, corporate profitability is high and the Fed's monetary programs continue to put a floor under stocks.  The problem is that while I do not disagree with any of those points - they are all artificially influenced by outside factors.   Interest rates are low because of the Federal Reserve's actions, corporate profitability is high due to accounting rule changes following the financial crisis and the Fed is pumping money directly into the stock market as I discussed yesterday:

The stock market has rallied sharply in direct correlation to the expansion of the Fed's balance sheet yet economic growth has floundered much to the dismay of the Federal Reserve.  As I discussed recently:

"The increases in excess reserves, which the banks can borrow for effectively zero, have been funneled directly into risky assets in order to create returns.  This is why there is such a high correlation, roughly 85%, between the increases in the Fed's balance sheet and the return of the stock market."

Fed-Balance-Sheet-VS-SP500-050913

With this in mind I do have a few questions that would like to ask in order to stimulate your thinking?

Employment

Employment is the life blood of the economy.  Individuals cannot consume goods and services if they do not have a job from which they can derive income.  Therefore, in order for individuals to consume at a rate to provide for sustainable, organic (non-Fed supported), economic growth they must be employed at a level that provides a sustainable living wage above poverty level.  This means full-time employment that provides benefits and a livable wage.   The chart below shows the number of full-time employees relative to the population.  I have also overlaid jobless claims (inverted scale) that shows despite media headlines to the contrary - falling jobless claims does not mean improving employment.

Employment-fulltime-joblessclaims-051413


Question: Does the current level of employment support the current rise in asset prices?


Personal Consumption Expenditures (PCE)

Following through from employment; once individuals receive their paycheck they then must consume goods and services in order to live.  Personal Consumption Expenditures is a measure of that consumption and comprises more than 70% of GDP currently.

PCE is also the direct contributor to the sales of corporations which generates their gross revenue.  So goes personal consumption - so goes revenue.  The lower the revenue that comes into companies the more inclined businesses are to cut costs, including employment, to maintain profit margins.

The chart below is a comparison of the annualized change in PCE to the S&P 500 index.  Notice the current divergence of the index from PCE.

PCE-SP500-051513


Question: Does the current weakness in PCE support the current rise in asset prices?


Import / Export Prices

As we continue to "follow the money" it is important to review what corporations are receiving for the goods and services that are being exported as well as what they are paying for goods and services being imported.  More than 40% of corporate profits today come from the exports of goods and services.  Therefore, declines in prices received from exported goods directly affect profit margins.  However, declines in prices of imported goods and services are a positive for profitability.  The chart below looks as the difference between export and import prices.   When net prices are rising that is a positive for profitability, again at the top line of the income statement, and a negative when they are falling.

Export-Prices-vs-Economy-051413


Question:  Are very negative net export prices supportive of the current market?


Corporate Profits As % Of GDP

Following the corporate profit story we can look directly at corporate profits.  Companies are currently at the highest level of profitability in history and is one of the key stories behind the "ongoing bull market" premise.  However, that profitability has come at the expense of "Main Street" as employment and wages have not risen.  I have discussed this recently stating:

"Suppressed wage growth, layoffs, cost-cutting, productivity increases, accounting gimmickry and stock buybacks have been the primary factors in surging profitability. However, these actions are finite in nature and inevitably it will come down to topline revenue growth. However, since consumer incomes have been cannibalized by suppressed wages and interest rates - there is nowhere left to generate further sales gains from in excess of population growth."

Profits-Employees-040113

The decline in economic growth epitomizes the problem that corporations face today in trying to maintain profitability.  The chart below show corporate profits as a percentage of GDP relative to the annual change in GDP.  As you will see the last time that corporate profits diverged from GDP it was unable to sustain that divergence for long.

Corporate-Profits-051413


Question: How long can corporate profits remain diverged from weakening economic growth?


Margin Debt Vs. Junk Bond Yields

As stated above the Federal Reserve's expansion of the balance sheet has investors ignoring the underlying fundamentals as asset prices rise with reckless abandon.  The complete lack of "fear" in the markets combined with a "chase for yield" has driven "risk" assets to record levels with stocks at all-time highs and junk bonds sporting record low yields.  This has been amplified as investors have taken on ever increasing levels of leverage.   The chart below shows the relationship between margin debt (leverage) and junk bond yields.  Margin on stocks is at levels last seen at the peak of the market in 2008 with yields on junk bonds at levels at levels never before witnessed.  This didn't end well last time as the reversion in the assets triggered repeated margin calls leading to a cycle of forced liquidations. 

Margin-Debt-Junk-Yields-051413-2


Question:  What is the possibility of this divergence being maintained indefinitely?


Being bullish on the market in the short term is fine - you should be.  The expansion of the Fed's balance sheet will continue to push stocks higher as long as no other crisis presents itself.   However, the problem is that a crisis, which is ALWAYS unexpected, inevitably will trigger a reversion back to the fundamentals.

As I stated in "Clues To Watch For The End Of QE Infinity":

"...with margin debt at historically high levels when the 'herd' begins to turn it will not be a slow and methodical process but rather a stampede with little regard to valuation or fundamental measures. As prices decline it will trigger margin calls which will induce more indiscriminate selling. The vicious cycle will repeat until margin levels are cleared and selling is exhausted.

The reality is that the stock market is extremely vulnerable to a sharp correction. Currently, complacency is near record levels and no one sees a severe market retracement as a possibility. The common belief is that there is 'no bubble' in assets and the Federal Reserve has everything under control."

Take a moment to compare what you have heard, and read, with the questions presented here.  Draw your own conclusions and invest appropriately.


See the original article >>

Inflation, Deflation & QE

By Frances Coppola

Inflation is dead.  Well, in the US, anyway:

fc1

What is curious is that the US is doing QE. Lots of it. Which is supposed to raise inflation, isn’t it?   Then there is Japan. Japan recently embarked on an extensive QE programme designed to raise inflation to 2%. Here’s the path of Japanese inflation:

fc2

It’s very easy to see where QE started. It’s when inflation fell off a cliff. Well, ok, it might have done that anyway, I suppose. Correlation doesn’t equal causation, and all that. But it is curious.

Japan has, of course, done QE before. A look at the inflation path for the period 2001-2006, when Japan was doing QE, doesn’t suggest a close relationship between QE and inflation.

fc3

The initial impact seems to have been deflation, though again we could do with a counterfactual. But for the rest of the period QE seems to have had little impact on inflation. In fact a researcher at the IMF concluded that QE’s effect on inflation was small.

The UK does appear to buck the trend, since it experienced above-target inflation ever since commencing its QE programme, still the largest in the world relative to GDP although it is currently suspended. Though it is interesting that throughout 2012, when the Bank of England was doing QE, CPI was falling – it picked up in November 2012 when QE stopped:

fc4

But this isn’t quite what it appears. The UK’s CPI was pushed up by tax rises, student tuition fee increases (what on EARTH are they doing in measures of CPI anyway?) and above-inflation rises in near-monopoly privatised utilities which are subject to government price controls. Yes, really. Government not only allowed those above-inflation rises, it encouraged them in the name of investment – though why it thinks utilities should invest for the future now when it isn’t doing so itself is a mystery. And the other significant component of CPI in the UK is imports of essential items, notably oil. I suppose you could blame this on QE to some extent, because of its tendency to push up world commodity prices – but externally-driven cost-push inflation wasn’t exactly what was wanted, was it? Anyway, the poisonous combination of external factors and government mismanagement pushed inflation up while real incomes have been falling. How to squash domestic demand in one easy lesson…..the effect on retail sales, for example, is horrible.

When you strip those effects away from the UK’s CPI, it appears that inflation is dead there too. The Bank of England has been doing exactly this: it has “looked through” CPI to see the underlying deflationary trend. Not that it is planning any more QE at the moment. It is waiting to see how the Funding For Lending scheme works: this takes a different approach to reflating the economy involving new short-term government debt issuance rather than money – on the face of it a promising approach though to my mind it still relies far too much on damaged banks for its effects. But it seems the Bank is also thinking about negative rates.

Given the considerable evidence that QE does not raise core inflation in the countries doing it, it is a mystery to me why people are still talking as if it does. Bullard, for example, saying he thought the Fed’s QE programme should continue until inflation hit 2%. And the Bank of Japan supposedly targeting 2% inflation, though no-one really believes it (or do they? it seems “inflation expectations” in Japan are up….). And all the talk of inflation being a serious risk from QE exit, as if QE exit is going to happen any time soon. Yes, Bernanke is talking about “tapering off”. That isn’t exiting QE. It’s stopping it. Exiting QE (by which I mean returning the purchased assets to the private sector) is about as easy as ending capital controls and, like capital controls, will take years and years if it happens at all. And while inflation remains low there is no reason whatsoever to exit QE. If, in some future universe, inflation were to spike due to bank profligacy in the presence of enormous bank reserves, it is reasonable to suppose that inflation-targeting central banks would promptly drain those reserves by selling the purchased securities. Yes, I know the bond vigilantes dispute the existence of a market for such a large quantity of securities, but the private sector sold them in the first place, so why wouldn’t they buy them back? Really the idea of a buyers’ strike on central bank sales of securities makes no sense at all. The problem would be managing the pace of sales, taking into account impacts on inflation and on government finances.

So QE is NOT INFLATIONARY. Not now, and not ever. Let’s put a stake through the heart of the idea that central bank “recklessness”, as some people call it, will cause massive inflation.

The chart evidence above seems to show that if anything, QE has deflationary rather than inflationary effects. (yes, I know, correlation isn’t causation, counterfactual….). But it has been difficult to come up with a convincing explanation for this. This post is my first attempt. I do not pretend to have a complete answer, and for that reason I am creating an open space on the Coppola Comment blogsite where the debate can continue and people can pool information and ideas on this subject.  We must find the answer….because if I am right, then QE is one of the biggest policy mistakes in history.

In my view the apparently deflationary impact of QE is due to what Stephen King calls its “unwanted redistributive effects”, so is an indirect rather than direct effect. As the Bank of England noted in its review of QE’s distributive effects, QE benefits the asset-rich at the expense of the income-dependent. To understand this, it is necessary to look at the context in which central banks do QE. The typical picture is of a stagnant economy with high unemployment, a high household savings rate (actual savings or debt deleveraging), risk-averse companies that are reluctant to invest, and – crucially – a damaged financial sector.

QE supports asset prices. Clearly, this most benefits those who own assets – who tend to be the rich and the old. In the aftermath of the 2008 financial crisis QE prevented catastrophic deleveraging and economic collapse: it was an emergency response to a desperate situation.  But since then, the debate has moved on, the benefits of supporting asset prices now are by no means clear and there appear to be all manner of unintended consequences.

QE is supposed to nudge investors towards riskier investments by raising the price of safer ones. And it is succeeding in this: bond prices are at an all-time high and the stock market is reaching for the moon. This is supposed to reduce the cost of investment for those firms that can raise funds on the capital markets – i.e. larger companies. It doesn’t help small businesses who don’t have access to capital markets. That assistance was supposed to come through bank lending – but banks don’t want to lend to risky businesses at the moment. But it doesn’t seem that the reduction in borrowing costs for larger companies has encouraged them to invest for the future either. On the contrary, it seems they have been buying other assets….notably their own shares. There has been a swathe of share buy-backs in the corporate world, partly paid for with their extensive cash hoards and partly funded with cheap borrowing from the capital markets. Debt for equity swaps are all the rage. This does nothing whatsoever to improve growth, employment or income.

So we have a broken transmission mechanism. We often hear about a broken money transmission mechanism due to damaged banks, but we don’t often hear about a broken EMPLOYMENT transmission mechanism due to damaged corporates. Far from QE support of asset prices enabling companies to invest for the future and employ lots of people, it encourages them to indulge in financial jiggery-pokery to shore up their balance sheets and maintain directors’ incomes, while using high unemployment and government wage support systems as an excuse to force down wages. The sheer amount of spin from corporates about lack of investment opportunities is exceeded only by their constant moaning about quality of labour. You would think that the developed countries offer no opportunities for future profits, despite their skilled and flexible workforces and supportive infrastructure. And governments pander to this: they fund skills development programmes to compensate for the training that companies aren’t doing, they cut benefits to force people to take on more work – any work, however unsuited to their skill set and however badly paid – and they cut corporate taxes as yet more encouragement to invest and employ. Yet unemployment remains stubbornly high, productivity is poor and and hours of work are falling.

In the case of smaller businesses – and more generally in Europe, where businesses depend more on bank lending – the problem is the broken money transmission mechanism. The fact is that damaged banks won’t lend to riskier prospects, especially when they are under regulatory pressure to de-risk their balance sheets: interest rates on lending to small businesses remain high despite the considerable support extended to banks by governments in the developed world.  QE has provided banks with huge amounts of excess reserves – but it hasn’t given them a reason to lend productively. As with corporates, QE simply gives banks an opportunity to shore up their balance sheets and maintain directors’ remuneration. Banks, too, tried to spin their lack of SME lending as due to a shortage of good quality opportunities – but NIESR’s recent research gave the lie to that.

So the broken financial and corporate transmission mechanisms mean that QE does not reflate the real economy. That alone would make it pretty ineffective. But it doesn’t make it actually deflationary. To understand why the fact that it encourages hoarding and risk-averse behaviour means deflation, we need to complete the loop from companies starved of investment to an economy starved of demand.*

It does not matter whether a company is starved of investment because banks won’t lend to it, or whether it starves itself of investment through exploiting QE-induced distortions in the financial markets. The effect is reduced productivity, which pushes through to reduced wages. If the cost of capital is such that using low-cost labour is cheaper than investing in machines, unemployment may fall, but so will productivity as workers have to use less efficient tools. Similarly, if it is cheaper to use poorly-paid temporary, part-time, casual and self-employed workers than to recruit full-time staff, unemployment will also fall – but average hours worked will also fall. In both the UK and US we are seeing increasing under-employment and reducing productivity: unemployment is high in both countries, but not as high as it might be if average hours worked were higher. For me this indicates a pattern of low corporate investment in both capital and people.

Under-employment and falling productivity force down real incomes. Add to this the effects of fiscal tightening in both the UK and the US, which hit working people on middle to low incomes disproportionately, and to my mind you have a significant hit to aggregate demand which is sufficient to explain deflation in both countries. Both UK and US governments believe that monetary tools such as QE can offset the contractionary impact of fiscal tightening. But this is wrong. Fiscal tightening principally affects those who live on earned income. QE supports asset prices, but it does nothing to support incomes. So QE cannot possibly offset the effects of fiscal tightening in the lives of ordinary working people - the largest part of the population. In fact because it seems to discourage productive corporate investment, it may even reinforce downwards pressure on real incomes. And when the real incomes of most people fall, so does demand for goods and services, which puts downward pressure on prices, driving companies to reduce costs by cutting hours, wages and jobs. This form of deflation is a vicious feedback loop between incomes, sales and consumer prices, which in my view propping up asset prices can do little to prevent.

Ah, you say, but most people own assets, don’t they – through their pensions and in the form of houses. This is true. And it is fair to say that QE props up the value of both pension investments and real estate. But it depresses returns on savings.** Depressing returns is supposed to encourage people to spend instead of save. But when people are saving for their old age, and they see their savings whittled away in the form of below-inflation returns, they are likely to save MORE, not less. They will cut discretionary spending to increase pension saving. This I think is partly the cause of the apparently deflationary effect of QE in Japan. Japan’s households have high savings rates because they have to save for retirement as there is no state safety net. In the US and UK the effect may be less, because both these countries have substantial state pension & benefits provision for the elderly. But….those schemes are unfunded, and future taxation may be unable to support claims on those schemes. Therefore governments persistently “talk up” the need to save for old age. It seems likely, therefore, that the combination of increased pressure to save for retirement and depression of returns on savings is encouraging people in the US and UK to increase savings at the expense of discretionary spending too. Once again it seems that the combination of QE with other things is deflationary, though that doesn’t necessarily mean QE itself is.

Then there is real estate. Homeowners benefit from Government propping house prices with various forms of QE. This support is explicit in the US at the moment, since the Fed is buying agency MBS, though perhaps less obvious in the UK. But QE supports real estate prices even if only government debt is purchased. The rising price of safe assets pushes investors not just towards riskier investments, but also towards safer ones….most notably prime real estate, which has risen considerably in value. Supporting house prices through QE, coupled with low rate policies that (especially in the UK) have kept mortgage rates for existing borrowers very low, has prevented mortgage defaults and supported aggregate demand. But there is a cost. Rental values are high, which hurts people who don’t own property – the young, and people on low incomes. There is little evidence now of wealth effects from property prices increasing spending, as used to be the case prior to the financial crisis: people simply aren’t taking out second mortgages to release equity for consumer spending at the moment. Fingers have been well and truly burned, and uncertainty around jobs and income means that people are reluctant to take on more borrowing….after all, if your income is falling and/or uncertain, servicing debt is a constant worry, and taking on more (unless you have to) is madness.

Overall, therefore, QE looks deflationary to me. Or if not actually deflationary in itself, at least completely ineffective as an offset to contractionary fiscal policy and fear-driven hoarding by companies and households. And there is one particularly poisonous effect that I mentioned in passing earlier in this post. The excess liquidity caused by QE, and shortages of the safe assets being purchased, encourages investors not only into riskier assets, but also into alternative safe ones. There is a lot of cash hoarding going on…..and I’ve noted already that QE drives up the price of prime real estate. It also interferes with the pricing of metals, which has implications for production costs in manufacturing industries. And spikes in the prices of foodstuffs and oil have also been attributed to QE. If this is true, then QE is toxic, because it increases the price of the essential goods that people need in order to live. But as with all things QE-related, it’s not that simple….after all, commodity prices are falling at the moment. What is clear, though, is that QE causes enormous distortions in financial markets which are not fully understood and which create fear, uncertainty and instability in the financial system. This could be justified if its effects were evidently beneficial. But it is by no means clear that they are.

From where I stand, QE looks like a very bad bet indeed. The benefits are uncertain and the downside risks huge. In my view it should be stopped. But you may not agree – and I know that many people are much more positive about QE. If you believe that overall its effects are beneficial to the economy, please do comment. Or even submit a post of your own arguing the opposite case.

And here is a final thought. It’s all very well criticising QE, but what should we do instead? After all, we have stagnant economies, damaged banks, risk-averse corporates, highly-indebted households, high unemployment, under-employment, low productivity and falling real incomes. Doing nothing is not an option. If QE is a disaster, what is the alternative?

See the original article >>

Follow Us