Tuesday, September 16, 2014

How Financial Bubbles Fester And Burst—Even As The Fed Says Not To Worry

by David Stockman

In today’s post Wolf Richter offers some solid insights on the dynamics of financial bubbles which merit further comment. The starting point is to recognize that once they gain a head of steam, financial bubbles tend to envelope virtually every nook and cranny of the economy, creating terrible distortions and destructive excesses as they rumble forward. In this instance, Wolf Richter explains how Silicon Valley has once again (like 1999-2000) been transformed into a rollicking capital “burn rate” machine that has spawned a whole economy based on striving for bigger losses, not better profits.

This latter development—- currently exemplified by 44 VC start-up companies in the IPO pipeline with a valuation of more than $1 billion each, despite no earnings and scarce revenues—-is indicative of late stage bubble dynamics. Say January 2000!

Needless to say, our monetary central planners remain hopelessly bubble blind—- still professing to see no significant speculative excesses because they are looking in the wrong place. Janet Yellen, for instance, keeps insisting that stock valuation multiples are still well within “historic ranges”. So do not be troubled.

Well, she’s talking about the global big cap stocks represented in the S&P 500 and is buying the Wall Street ex-items hockey stick that projects $125 per share next year (15.8X) after you exclude recurring “non-recurring” losses; and also after setting aside various asset write-offs that reflect the penchant for capital destruction (job restructurings, plant and store closures and excess purchase price or goodwill charges) that has become epidemic in big company C-suites during the era of bubble finance.

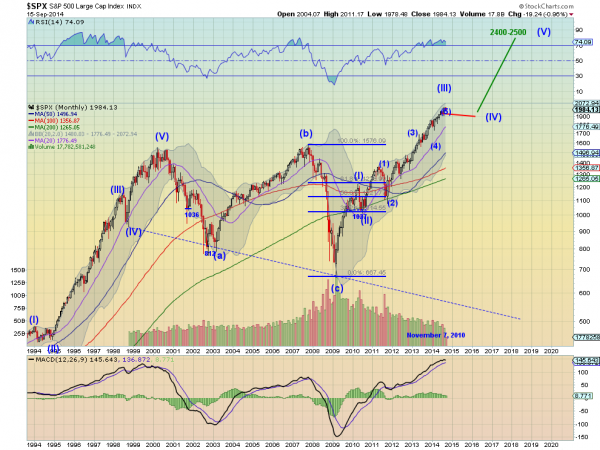
So the bubble blindness starts here. The very last thing you can believe is Wall Street’s version of the so-called broad market multiple—especially near the end of a Fed money printing cycle. When the S&P 500 peaked at 1570 in October 2007, for example, Wall Street’s forward-looking ex-items hockey stick was about $115 for 2008—-or hardly 14X.  Nothing to worry about there. It was all good and in the historic range.

Until it wasn’t, and the index hit 670—-a 57% plunge—-17 months later. And by the way, ex-items earnings for 2008 came in more than 50% lower—–at about $55 per share, and only $15 per share on an honest GAAP basis.

In the course of my research for The Great Deformation I looked at that period in detail, aggregating the boom period of 2007 and most of 2008 with the bust of early 2009 and the recovery thereafter through the end of 2010.

For the four-year period as a whole, the Wall Street sell side claimed ex-item earnings of $2.42 trillion for the entire basket of big cap global companies. And that was the sum of what actually happened, not the hockey sticks projected for each up-coming year. On average over the period, therefore, the broad market traded at 17.3X ex-items EPS—not “cheap”, as Wall Street had claimed prior to the bust, by any means.

But that’s Wall Street’s version of “earnings”. You would think the Fed would at least give some weight to the fact that in its wisdom, Washington spends several billion per year at the DOJ and SEC prosecuting companies and executives for violations of GAAP—sometimes even hairline infractions. So presumably there is something valuable in adherence to honest and consistent corporate accounting and disclosure.

But when I looked at the same four years (2007-2010) for the S&P 500 based on what companies had actually reported to the SEC in their filings, rather than the manicured version of their earnings touted by Wall Street, it turns out the cumulative net income was only $1.87 billion on a GAAP compliant basis.

So based on the financial reports vouched for by CEOs and CFOs not wishing to risk a spell of hospitality at one of  Uncle Sam’s country club’s, S&P 500 earnings were a staggering $550 billion less than the street version. In truth, therefore, the Wall Street version of earnings was over-stated by nearly 30%, and the broad market traded at an average multiple of 23X during this four year period.

This is another way of saying that the market—especially near a bubble top—-is always held to be “not yet fully valued” and tends to trade reliably at about 15X the sell-side’s ex-items hockey stick. And it means absolutely nothing.

At the present moment, in fact, LTM earnings for the S&P 500 are about $100 per share based on GAAP and historically consistent treatment of pension accounting. The market is pushing 20X honest reported earnings, therefore, and is sitting exactly where it was in the fall of 2007. Back then reported earnings peaked at $85 per share—about 18.5X the market top reached during the last Fed bubble.

Self-evidently, the monetary politburo has learned nothing in the interim. And that is especially so for Janet Yellen who spent the spring and summer of 2008 at Fed meetings opining about the to-and-fro of “in-coming” macroeconomic data without even noticing that a ferocious explosion was brewing on Wall Street.

Yet this time the fallacy of Wall Street’s ex-items hockey stick is even more blatant and transparent. During the period since late 2011, the stock market has risen nearly 50% yet reported S&P earnings per share are up hardly 10%. And virtually, the entirety of even that plodding gain is attributable to the surge of corporate buybacks in the interim. Indeed, as the WSJ reminded yesterday, the run rate of share repurchases in the first half of 2014 had nearly regained the blow-off level of 2007.

Beyond that, the corporate profit margins embedded in the $100 per share of GAAP earnings posted for the LTM through June had soared beyond the 2007 peak and was now in financial terra incognita.

So even if we had not experienced an unprecedented 68 straight months of zero interest rates that must now be normalized in the years ahead, and a global boom that is coming unwound everywhere from China and Japan to Turkey, Europe and Brazil, why would you consider a 20X multiple on the big cap stocks “well within the range of historical experience”?

But the next point is even more telling.  The S&P 500 is the last place where the bubble finally manifests itself. During the 66 months since the March 2009 bottom, when the S&P 500 rose by 200%, the speculative precincts of the stock market have soared by orders of magnitude more. The Russell 2000, for example, peaked at a gain of nearly 260%, and, of course, the biotech and social media indices went off the charts, registering gains north of 300%.

What happened, therefore, is blatantly obvious.  As the venture capital world cashed-in during the mid-cycle surge, Silicon Valley was flooded with winnings from IPOs and a tsunami of new institutional capital looking to get on the bandwagon. This, in turn, fueled an outpouring of more start-ups, bolder VC valuations and, soon, a plentitude of candidates for the parade of earning-less and increasingly revenue-less IPOs.

As detailed by Wolf Richter below, even the leading venture capitalists now recognize that the insanity of the dotcom era has re-emerged. One of these days, even the monetary politburo may notice.  But by then it will be too late. Again.

By Wolf Richter At Wolf Street

Not everything is hunky-dory in the world of stocks. The S&P 500, which has been hovering near its all-time high and hasn’t experienced a decline of 10% in three years, has been the focal point of breathless media coverage. But beneath the surface, the stocks of smaller companies are being put through the meat grinder.

Bloomberg found that 47% of all stocks in the Nasdaq have skidded at least 20% from their 12-month high; 40% of the stocks in the Russell 2000 and, chillingly, 40% of those in the Bloomberg IPO index have made that same trip south. They’re now languishing in their own bear-market purgatory. Investors have been fleeing these companies for months. I wrote about that phenomenon in May, but it has gotten worse since.

Yet, 44 startups that have not yet gone public and have not yet been acquired have valuations of over $1 billion, with five of them in (or nearly in) the $10 billion club. Uber tops the list with a valuation of $18 billion. And Snapchat, one of these $10-billion outfits, doesn’t even have revenues yet.

It’s at this confluence of excess and exuberance on one side and sub-surface carnage on the other that a voice from the venture capital world speaks up: Bill Gurley, a partner at Benchmark and investor in Uber, Zillow, OpenTable, and others, lamented in an interview with the Wall Street Journal the “excessive amount of risk” piling up in Silicon Valley: “In some ways less silly than ’99 and in other ways more silly than in ’99,” he said.

That comparison to the final outburst of craziness of the dotcom bubble before it blew up is ominous, even for him. But not for the entrepreneurs out there today, of whom perhaps as many as 60% or 70%, he said, “weren’t around in ’99, so they have no muscle memory whatsoever.”

And he pointed at the result of nearly free money sloshing into Silicon Valley, and why all excesses end badly: when startups are raising hundreds of millions of dollars, as they are these days, they’re encouraged to spend it, and so they speed up their “burn rate.”

And I guarantee you two things: One, the average burn rate at the average venture-backed company in Silicon Valley is at an all-time high since ’99 and maybe in many industries higher than in ’99. And two, more humans in Silicon Valley are working for money-losing companies than have been in 15 years, and that’s a form of discounted risk.

These “excessive amounts of capital” lead to trouble as startups are getting used to reckless spending.

And that can be seriously, negatively reinforced by the capital market. In the software-as-a-service world, where the risk is potentially among the highest, Wall Street has said it’s OK to lose tons of money as a public company. So what happens in the board rooms of all the private companies is they say, “Did you see that? Did you see they went out and they’re losing tons of money and they’re worth a billion? We should spend more money.” And there are people knocking on their door saying, “Do you want more money, do you want more money?”

They do want more money. To justify the additional capital, these companies, which often don’t have revenues and can’t even imagine what it would be like to generate enough cash internally to survive, increase their burn rate. They move into digs with more expensive leases, and hire more people and increase their compensation, and they serve delicious free lunches…. Excessive capital reinforces every mortal sin a business can commit [read... How the Surge of Hot Money Pushes San Francisco to the Brink].

And so Gurley rephrased what bankers have known for eons – that bad loans are made in good times. The way he sees it “bad business behavior is coincidental with the best of times in our field.” Excessive amounts of capital nurtures this bad business behavior and covers it up and distracts from the core of what a business should do. Incentives get distorted and priorities take a turn for the bizarre. Everyone who has been around the scene with open eyes has seen the symptoms. “So, the crazier things get, the worse people execute,” he said.

Excessive amounts of capital lead to a lower average fitness because fitness, from a business standpoint, has to be cash-flow profitability or the ability to generate cash flow. That’s the essence of equity value. And so I think we get further and further away from that in the headiest of times.

The excesses are spreading around. Now landlords in San Francisco that are charging “two or three times what the rent was three years ago” are demanding 10-year leases, he said. If they thought rents would continue to go up, they wouldn’t try to lock in the current rates for ten years. They know something the startup world has learned in 2000 and 2001 but has already forgotten. But their strategy won’t work.

When the money flow dries up, “the types of gymnastics” that these companies would have to do “to readjust their spend is massive.” When the prior tech bubble imploded, “half the companies went bankrupt, and they couldn’t pay the lease over the 10-year period.” Many of these companies simply evaporated after they’d blown through their investors’ money. In 2001, tech companies announced nearly 700,000 job cuts. And this time? Excessive amounts of capital thrown around willy-nilly by giddy investors with grandiose hopes at companies with puny if any revenues and endless losses always ends badly.

How much does it cost to manipulate the entire IPO and startup market? Not much. And it’s getting cheaper! It was leaked that VC firm Kleiner Perkins Caufield & Byers would sprinkle $20 million on Snapchat. But the tiny deal would raise Snapchat valuation to $10 billion. Read… Pump and Dump: How to Rig the Entire IPO Market with just $20 Million

See the original article >>

Festival Franciacorta


AspettandoFestival2014

Not All That It Seems

by Lance Roberts

It’s a slow day in the neighborhood as the world awaits the Janet Yellen’s post-FOMC meeting press conference. It is almost like the old “Batman” series with Adam West when they would get to the end of the show and leave you with a “cliffhanger:”

“It’s a questionably unquestionable situation…

Are the markets prepared for a shocking answer…

Will Janet Yellen announce the final end to QE? Or electrify the bulls with more accommodation?

Can Yellen’s eloquent elocution energize the markets…or will she magnetize the bears?

Tune in next time Fed fans…Same Fed time…Same Fed channel”

While we wait in breathless anticipation for the next clue, I do find it interesting there is a rising belief that things have returned to some level of normalcy. As I noted yesterday, the bullish mantra is alive and well, and analysts have all turned their eyes skyward with price targets reaching as high as 2800 for the S&P 500 as noted by Jeffrey Saut at Raymond James:

“Since 1989 the S&P 500’s earnings have grown by 6.15% annually. Extrapolating that into 2020 implies earnings of $183.36 (see chart on the next page). Using the historical median P/E ratio of 15.5x yields a price target of 2842 in 2020.

Estimated-Earnings-Growth-091514

While the technical trends remain firmly intact, which confirms the bullish trend and encourages portfolios to be more heavily tilted towards equities at the current time, there are certainly some underlying issues that are concerning. Here are a couple worth noting.

Artificial Drivers

According to the Wall Street Journal:

“Companies are buying their own shares at the briskest clip since the financial crisis, helping fuel a stock rally amid a broad trading slowdown. Corporations bought back $338.3 billion of stock in the first half of the year, the most for any six-month period since 2007, according to research firm Birinyi Associates. Through August, 740 firms have authorized repurchase programs, the most since 2008."

Stock-Buybacks-091614

"The growth in buybacks comes as overall stock-market volume has slumped, helping magnify the impact of repurchases. In mid-August, about 25% of non-electronic trades executed at Goldman Sachs Group Inc., excluding the small, automated, rapid-fire trades that have come to dominate the market, involved companies buying back shares. That is more than twice the long-run trend, according to a person familiar with the matter.

Companies with the largest buyback programs by dollar value have outperformed the broader market by 20% since 2008, according to an analysis by Barclays.”

This is something that I addressed a while back in “4 Tools Of Corporate Profitability.” While analysts have ballyhooed over surging corporate profits, they have come at a great expense to the average worker. Those profits, driven initially by massive cost cutting and then stock buy backs, are artificial in nature and why prosperity for the bottom 80% of the economy has remained elusive.

Wages-Profits-Ratio-091614

[Note: While corporate profit “margins” rose in the second quarter to new all-time highs, it is interesting to note that corporate profits did NOT.]

The primary issue with both cost cutting and share repurchases is that they are both “finite” in nature. With the ability to cut costs primarily exhausted and share repurchases showing signs of slowing; the primary question for market bulls will be the driver for profit margins in the months ahead? If you were hoping for global growth, you might be a disappointed.

China and Europe Stumble

It is important to note that roughly 40% of domestic corporate profits are derived from the major global trading partners of Japan, China and the Eurozone. It should not be surprising, particularly in today’s globally interlinked economies, that no country can remain an “island” indefinitely. Yet, it is currently believed the the U.S. can remain "decoupled" from the rest of the world.

From Business Insider:

China-Economy-091614-2

“Let's do a quick fly-around of all the disappointing metrics.

  • Analysts expected industrial production to rise 8.8%, but it came in at 6.9%. That's down from 9.0% print in July.
  • Retail sales rose 11.9% instead of 12.1% as expected and 12.2% in July.
  • Fixed-asset investment was up 16.5% versus 16.9% expected and 17.0% previously.

All of this spells trouble, and here's some more: Housing sales were 11% year over year through January to August, versus a 10.5% drop in the first seven months of the year. According to Bloomberg economist Tom Orlik, that slowing in the housing market has been the main driver of all of this discontent.”

More importantly, according to Reuters:

“China's foreign direct investment fell to a low not seen in at least 2-1/2 years in August, underscoring the challenges to growth facing the world's second-biggest economy.

The weak investment data came as China's economic growth appears to be hitting a soft patch after a bounce in June, with indicators ranging from imports to industrial output and investment all pointing to sluggish activity.”

Considering that China is a large user of domestic exports, and a large provider of imports (particularly for you Apple product iFans), the weakness underscores real global economic activity.

However, it is not just China that is struggling but the Eurozone as well. The Eurozone is the single largest trading partner of the U.S., so it is very important to keep an eye on what is happening there. France, Italy and Spain, among others, have been struggling ever since the financial crisis, however, Germany has been a strong leader and the primary support to Eurozone’s stability.

It now appears that Germany’s “Wirtschaftswunder,” or economic miracle, is coming to an end, via Reuters:

“In recent weeks, the economy that proud German politicians have taken to describing as a ‘growth locomotive’ and ‘stability anchor’ for Europe, has been hit by a barrage of bad news that has surprised even the most ardent Germany skeptics.

The big shocker came on Thursday, when the Federal Statistics Office revealed that gross domestic product (GDP) had contracted by 0.2 percent in the second quarter.”

Dislocations between the U.S. economy and that of the Eurozone have occurred in the past but did not last long.

GDP-US-EuroZone-081414

Therefore, either the Eurozone will find the source of a strong economic rebound or the U.S. is going to see slower growth in the months ahead. Currently, it is the latter that is most probable.

The Extinction Of Bears

Despite evidence that global weakness is mounting, the bullishness on Wall Street is at record levels.

As I wrote last week:

"It is a bad sign for the market when all the bears give up. If no-one is left to be converted, it usually means no-one is left to buy.” - Pater Tenebrarum

That quote got me thinking about the dearth of bearish views that are currently prevalent in the market. The chart below shows the monthly level of bearish outlooks according to the Investors Intelligence survey.

Bearish-Sentiment

The extraordinarily low level of "bearish" outlooks combined with extreme levels of complacency within the financial markets has historically been a "poor cocktail" for future investment success.

It is an interesting time in which we live. The financial media has no concern of negative outcomes, Wall Street has growth priced in that has never occurred in history, and there is NO expectation of a recession built into any forward assumptions. We have indeed discovered financial “Utopia,” or at least that is what is currently believed. I can only conclude with quote from Benjamin Graham via John Hussman:

“During the latter stage of the bull market culminating in 1929, the public acquired a completely different attitude towards the investment merits of common stocks… The answer was, first, that the records of the past were proving an undependable guide to investment; and, second, that the rewards offered by the future had become irresistibly alluring.

An alluring corollary of this principle was that making money in the stock market was now the easiest thing in the world. It was only necessary to buy ‘good’ stocks, regardless of price, and then to let nature take her upward course. The results of such a doctrine could not fail to be tragic.”  -  Benjamin Graham & David L. Dodd, Security Analysis, 1934

See the original article >>

China Launches CNY500 Billion In "Stealth QE"

by Tyler Durden

It has been a while since the PBOC engaged in some "targeted" QE. So clearly following the biggest drop in the Shanghai Composite in 6 months after some abysmal Chinese economic and flow data in the past several days, it's time for some more. From Bloomberg:

  • CHINA’S PBOC STARTS 500B YUAN SLF TODAY, SINA.COM SAYS
  • PBOC PROVIDES 500B YUAN LIQUIDITY TO CHINA’S TOP 5 BANKS: SINA
  • PBOC PROVIDES 100B YUAN TO EACH BANK TODAY, TOMORROW WITH DURATION OF 3 MONTHS: SINA

Just as expected, the Chinese "derivative" currency, the AUD, goes vertical on the news, and the S&P 500 goes vertical alongside:

For those confused what the SLF is, here is a reminder, from our February coverage of this "stealth QE" instrument.

* * *

The topic of China's inevitable financial crisis, and the open question of how it will subsequently bail out its banks is quite pertinent in a world in which Moral Hazard is the only play left. Conveniently, in his latest letter to clients, 13D's Kiril Sokoloff has this to say:

Will the PBOC’s Short-term Lending Facility (SLF) evolve into China’s version of QE? While investor attention has been fixated on China’s deteriorating PMI reports and fears of a widening credit crisis, China’s central bank is operating behind the scenes to prevent a wide-scale financial panic. On Monday, January 20th, 2014, when the Shanghai Composite Index (SHCOMP, CNY 2,033) fell below 2,000 on its way to a six-month low and interest rates jumped, the central bank intervened by adding over 255 billion yuan ($42 billion) to the financial system. In addition to a regular 75 billion yuan of 7-day reverse repos, the central bank  provided supplemental liquidity amounting to 180 billion yuan of 21-day reverse repos, which was seen as an obvious attempt to alleviate liquidity shortages during the Chinese New Year. However, it is worth noting that this was the PBOC’s first use of 21-day contracts since 2005, according to Bloomberg. Small and medium-sized banks were major beneficiaries of this SLF, as the PBOC allowed such institutions in ten provinces to tap its SLF for the first time on a trial basis. A 120 billion yuan quota has been set aside for the trial SLF, according to two local traders.

The central bank also said it will inject further cash into the banking system at regularly-scheduled open market operations. This is a very rare occurrence, as it is almost unprecedented for the central bank to openly declare its intention to inject or withdraw funds at regularly-scheduled open market operations. Usually, these operations only come to light after the fact.

The SLF was created as a brand new monetary tool for the central bank in early 2013 and was designed to enable commercial banks to borrow from the central bank for one to three months. Since its creation, however, the SLF program has been used with increasing frequency by the central bank.

The latest SLF is remarkable for two reasons: First, as mentioned earlier, this SLF was expanded to allow provincial-level small- and medium-sized banks, for the first time, to tap liquidity from the central bank.  As local financial institutions are usually both the major issuers and holders of local government debt, the expansion of the SLF to include local financial institutions opens a new channel for liquidity to flow from the central bank to local governments. This may suggest that the central bank, which is now on high alert for systemic risk, is willing to share some of the burden of local government, though on a very selective and non-regular basis.

The second key reason is embodied in the following central bank announcement: “[we will] explore the function of the SLF in setting the upper band of the market interest rates.” In other words, in the event that interest rates spike higher due to a systemic crisis, the central bank can intervene, via the SLF, to bring rates back down if it so desires. In addition, the PBOC did not disclose any set cap on the SLF, implying that unlimited liquidity could be provided as long as the market’s rate spike exceeds the bands set by the PBOC.

...

Most important, the SLF appears to represent the PBOC’s strategy to avert China’s widely-publicized local government debt and banking-system problems. It is  worth noting that even though local government debt amounts to 30% of GDP and is growing at an alarming rate, China’s central government is relatively underleveraged, with a debt-to-GDP ratio of only 23%, which is significantly lower than the emerging-market average. Therefore, Beijing has considerable unused borrowing capacity to share some of the debt burden taken on by local governments, which would have the additional positive impact of lowering borrowing costs for those governments.

See the original article >>

Are Low Volatility ETFs Topping Out?

by Tom Aspray

The Dow Industrials and Dow Utilities managed slight gains Monday while the selling was the heaviest in the Nasdaq and small-caps. The market internals were solidly negative with the declining stocks leading the decliners by a 2-1 margin on the NYSE.  The NYSE Advance/Decline Line has dropped further below its WMA after confirming the recent highs.

Most of the focus remains on the bond market and the dollar as yields are holding just below their recent highs. In line with the recent dumping of junk bond ETFs, the 10-Year T-Note yield has risen sharply. They are just below the strong resistance in the 2.625%-2.660% so short-term pullback in yields would not be surprising. The December Dollar Index has been trading above its weekly starc+ band for the past three weeks and is therefore also in a high risk buy area.

In my weekend ETF review, I noted that most of the low volatility ETFs had a rough week.  This class of ETFs was designed to hold up better in down markets and allow investors to sleep better when a market is correcting. Of course, investors must be willing to accept lower returns than a benchmark like the S&P 500 when the market is strong.

Each of these three low volatility ETFs has a different focus but their charts may be sending an important message.

Click to Enlarge

Chart Analysis: The PowerShares S&P 500 Low Volatility (SPLV) has assets of $4.59 billion with an expense ratio of 0.25%. It has a current yield of 2.40%.

  • SPLV was up 23% in 2013 including dividends, compared with the 32% gain in the S&P 500.
  • It holds the 100 stocks in the S&P 500 with the lowest realized volatility over the past twelve months.
  • The weekly chart shows that the ETF failed to surpass the July high at $32.73 in early September.
  • The strong reversal last week is consistent with a top, with the quarterly pivot at $34.70.
  • The weekly starc- band is now at $37.00.
  • The longer-term downtrend in the RS line is consistent with its underperformance versus the S&P 500.
  • In a bear market, you would expect it to show positive RS analysis.
  • The heavy volume in July dropped the weekly OBV below support at line c.

The daily chart of PowerShares S&P 500 Low Volatility (SPLV) also shows a top formation, as it formed lower highs in early September, line d.

  • The daily starc- band is now being tested.
  • The key support on the daily charts, line e, is now in the $34 area.
  • There is short-term resistance at $35.08 with stronger at $35.50.
  • The daily RS analysis shows some signs of bottoming, line g.
  • A move through its downtrend, line f, would be the first sign that it was becoming a market leader.
  • The daily chart more clearly shows the volume spike of over 14 million shares on July 21.

Click to Enlarge

The iShares MSCI EAFE Minimum Volatility (EFAV) has $1.24 billion in assets with an expense ratio of 0.20% and a yield of 3.28%. It is focused on the lower beta and volatility stocks across 22 developed countries, excluding the US and Canada.

  • It has 15% in the top ten holdings with Novartis AG and the Hang Seng Bank, Ltd. the top holdings at just over 1.5%.
  • The weekly chart shows that EFAV completed a triangle formation, lines a and b, in April.
  • EFAV is currently up 5.6% YTD and is testing the quarterly pivot at $63.71.
  • The monthly projected pivot support is at $63.08 along with the weekly starc- band and the breakout level (line a).
  • The weekly RS made a new low last week and is in a well-established downtrend, line c.
  • The volume has increased recently as the weekly on-balance volume (OBV) has dropped below its WMA and support at line d.
  • The next support is at the long-term uptrend, line e.
  • The 20-day EMA is at $64.67 with the monthly pivot at $64.91.

The iShares MSCI Emerging Markets Minimum Volatility (EEMV) selects its holdings from the MSCI Emerging Markets Index. It has a yield of 2.47% with an expense ratio of 0.25%.

  • It has over 200 holdings with just over 15% in the top ten holdings.
  • It is up 6.43% YTD and the weekly chart shows that it just triggered a LCD sell signal on Friday.
  • The monthly projected pivot support at $61.07 is now being tested.
  • There is further support in the $60-$60.50 area with the quarterly pivot at $58.91.
  • The sideways action in the relative performance, line g, suggests it is keeping pace recently with the S&P 500.
  • The weekly OBV broke its downtrend, line h, in early May.
  • The OBV is still holding above its WMA.
  • The declining 20-day EMA is now at $62.38 with further resistance at $63.00.

What it Means: The weakness in these low volatility ETFs could be interpreted in several ways. Does it mean that those who bought these more cautious ETFs are moving into more aggressive instruments, which could be a positive sign?

Alternatively, are these more risk adverse investors just getting out of the market altogether?

Too early to tell, but of the three, iShares MSCI EAFE Minimum Volatility (EFAV) looks the best.

See the original article >>

Silver: Fed will write the next chapter

By Matt Weller

Since peaking around 21.60 in early July, silver has sold off consistently for the past two months.

By last week, the gray metal had drifted all the way down to test the critical support zone around 18.25-50; this level represents the 4-year low in silver (COMEX:SIZ14) and has provided meaningful support on three separate occasions over the last 14 months. Now, metal traders are wondering, “Will this level finally break, or is another rally to above $20 in the cards?”

As we go to press, the short-term technical picture favors the bears. As the 4hr chart below shows, silver has been in a bearish channel for over two weeks now. Just this morning, the metal peeked out above the channel, but was quickly rejected back lower, creating a large Bearish Pin Candle,* or inverted hammer pattern.

This candlestick formation shows a sharp shift from buying to selling pressure and is often seen at near-term tops in the market. With the RSI still well within bearish territory, the sellers could look to drive the metal back into the key 18.25-50 support area later this week. Only a break above today’s high at 18.85 would shift the near-term bias to the topside for another run back toward $20.

Meanwhile, the fundamental side of the ledger is a bit murkier. With a plethora of high-impact economic data scheduled for the last 72 hours of the week, volatility will likely be elevated for all trading instruments. While both Scotland’s independence referendum and the ECB TLRTO auction will be important, the marquee event for silver will be tomorrow’s Fed decision and statement.


Source: FOREX.com

Another $10B taper of the QE program is all-but-inevitable, so the key variable will be whether the central bank tweaks its statement to suggest that it may raise interest rates sooner. We’ll have a full Fed preview out later today, but if the Fed statement suggests earlier rate hikes are possible, the dollar may rally and silver could fall back into 18.25-50 support. On the other hand, a status-quo statement and press conference would disappoint dollar (NYBOT:DXZ14) bulls, likely leading silver to break out of its bearish channel and target $19 in the short-term and potentially the $20 level in time.

*A Bearish Pin (Pinnochio) candle, or inverted hammer, is formed when prices rally within the candle before sellers step in and push prices back down to close near the open. It suggests the potential for a bearish continuation if the low of the candle is broken.

See the original article >>

Take your grains numbers with a bit of salt

By Jim McCormick, Ryan Ettner

Corn  (CBOT:ZCZ14)

Corn finally found a small bounce today which could have been partially due to cold temps seen over the weekend, but also likely had something to do with the FSA releasing a new estimate tomorrow. While the FSA number is destined to move closer to the USDA number, the August number was so low that tomorrow’s number could still be seen as short term bullish. These early FSA estimates are known for being far from what their final number ends up being, so let’s take tomorrow’s number with the appropriate grain of salt. While this FSA number could continue light support it will be facing some large early harvest numbers this week.

Bulls:

  • Look for the FSA to come in with a number to offer a little more support tomorrow morning
  • Rains could push back some early yield reports until next week for the Midwest, this can slow sellers short term
  • Right now the best support should still come from a lack of sellers, today’s bounce was only light short covering

Bears:

  • Trade went a long way to point out this early FSA estimate should not be heavily considered
  • Today’s bounce was mainly light short covering which should still appear to bears as a good opportunity for selling a bounce
  • Both rainfall and temps look to improve this week after today’s rains move out, early yield reports might be delayed but should start to come in soon

Soybean (CBOT:ZSX16)

The bean market began the week on a volatile note to begin the week’s trade. The overnight session opened weaker as some of the frost premium that was put into the market Friday was taken out. The weekend’s cold snap didn’t have a major impact on this year’s crop as many Northern Border States saw a mid-30s frost but no killing freeze Saturday morning. We have had reports of a few locations that were hit with some temps cold enough to freeze the crop but these areas seem to be isolated and we think these losses will have minimal impact on the nation numbers.

Today’s NOPA crush was pretty much a nonevent as it represents old crop beans and does have much of an impact on the new crop story. The actual August crush of 110.633 million bushels was just under the average guess of 111.636. This was 0.1% over last year in the same month. For the old crop year, Sep 2013 – Aug 2014 the NOPA numbers total 1.652 billion. With about 79 million bushels from the non-NOPA crushers we estimate the year at 1.730 billion. That is right on USDA’s latest estimate.

In other news today that gave the market a boost, traders were talking about how they expect the Chinese buying delegation to sign purchase documents with the US Soybean Export Council today. This is a signing ceremony for the purchases that were announced Thursday, Friday, and today. The trade should not get excited as this is a regular annual visit but some no doubt will try to spin the news as bullish. This procurement is simply a head start on the 29 million tonnes that we see China buying this year.

In news out of South America Analysis firm, Safras e Mercado, on Friday estimated the Spring 2015 harvest at 95.9 million tonnes. This is the largest estimate we have heard yet. USDA’s latest is a 94 mt estimate, still much larger than the 87.5 mt it suggests from this past year’s harvest.

The FSA will be releasing their updated numbers tomorrow morning. The trade will be trying to use these numbers to determine if the NASS will be making adjustments to the planted acres on upcoming reports. The data is incomplete as they have until the end of the year to collect all the data from producers but market bulls will no doubt try to spin the report friendly. With the early yields results we have been seeing losing some acres this year shouldn’t have a big impact IF the NASS would make acreage adjustments. Traditionally there is about a 1.5 million difference between the FSA numbers and the final NASS numbers.

Weekly inspections came in at 255,020 which as within the trades expected range of 150,000 to 275,000 tonnes. Allendale continues to look for beans to fall to the $9.35 area when the fall low is scored and would recommend not chasing rallies. Producers should continue to sell into price rallies if they occur.

Wheat (CBOT:ZWZ14)

Wheat finished lower today pressured by harvest for the spring wheat which has started in some areas. Quality is a concern for the spring wheat this year but we are not seeing the buying we have been recently which could be a concern for the long Minneapolis short Chicago spread. We heard of a few larger wheat buyers looking for wheat overnight but not from the U.S. as a key supplier.

Export inspections were within trade estimates today as we have seen some buyers taking delivery of U.S. as global quality has been a concern with too much rain in some areas this spring. Following the USDA report last week we need to look for the end of the month small grains summary for additional wheat news but at this point a lack of new news is being viewed as bearish.

Ukraine and Russia have failed to spark much buying interest recently and it doesn’t appear like this issue is going to materialize right now. Once of the things we can note is that funds do not seem to be adjusting their position over the last few weeks as we saw some light adding to shorts last week but did not see the Chicago contract break as hard as the KC or Minneapolis which could suggest some light fund buying supporting the wheat.

As we break into planting any sort of delay or very early frost could affect wheat prospect which could support this market but we are not expecting a trend changing rally at this point. Continue to look for sideways to lower trade as we are going to see some pressure if corn starts to break hard into its harvest.

  • Saudi Arabia buys 610,000 tonnes of hard wheat from Europe and Australia
  • Wheat inspections were 545,621 tonnes within trade estimates

See the original article >>

The Price of Scottish Independence

by Jeffrey D. Sachs

NEW YORK – Though the world’s eyes now are on Scotland’s referendum on independence from the United Kingdom, Scotland is not alone in seeking to redraw national boundaries. There are independence movements in many other parts of the world; indeed, 39 new states have joined the United Nations since 1980. Many more aspirants are waiting in the wings, and would likely be encouraged by a Scottish “Yes” vote.

The Scottish pro-independence campaign is based on four claims. The first is cultural: to protect and strengthen the identity of the Scottish people. The second is ideological: to move Scotland toward a Scandinavian-style social democracy. The third is political: to bring democratic governance closer to the people. And the fourth is economic: to lay claim to a larger share of North Sea oil and gas.

UK political leaders and many European governments are strongly urging the Scots to vote against independence. Scottish independence, the “No” campaign argues, would bring few if any of the claimed benefits; on the contrary, it would cause many economic calamities, ranging from financial panics to the flight of jobs and industry from Scotland. Moreover, an independent Scotland might be excluded from the European Union and NATO.

What should the rest of the world think about this debate? Should the Scottish independence campaign be hailed as a breakthrough for claims to cultural identify and self-governance? Or should it be viewed as yet another source of instability and weakness in Europe – one that would increase uncertainty in other countries and parts of the world?

Secession movements can, no doubt, cause great instability. Consider the regional and even global turmoil over Kosovo, South Sudan, Kurdistan, and Crimea. Yet national independence can also be handled peacefully and smoothly. The 1993 division of Czechoslovakia into the Czech Republic and Slovakia – the famed “velvet divorce” – imposed no significant or lasting costs on either successor state. Both accepted the division, and, knowing that their future lay within the EU, focused their attention on accession.

Here, then, is a plausible and positive scenario for an independent Scotland. The rest of the UK (called the “RUK” in the current debate), including England, Wales, and Northern Ireland, would quickly and efficiently negotiate the terms of independence with Scotland, agreeing how to share the UK’s public debt and public assets, including offshore oil and gas. Both sides would be pragmatic and moderate in their demands.

At the same time, the EU would agree immediately to Scotland’s continued membership, given that Scotland already abides by all of the required laws and democratic standards. Similarly, NATO would agree immediately to keep Scotland in the Alliance (though the Scottish National Party’s pledge to close US and British nuclear-submarine bases would be a complication to be overcome).

Both Scotland and the RUK might agree that Scotland would temporarily keep the British pound but would move to a new Scottish pound or the euro. If such monetary arrangements are transparent and cooperatively drawn, they could occur smoothly and without financial turmoil.

But if the RUK, the EU, and NATO respond vindictively to a Yes vote – whether to teach Scotland a lesson or to deter others (such as Catalonia) – matters could become very ugly and very costly. Suppose that a newly independent Scotland is thrown out of the EU and NATO, and told that it will remain outside for years to come. In this scenario, a financial panic could indeed be provoked, and both Scotland and the RUK would suffer economically.

The key point is that the costs of separation are a matter of choice, not of inevitability. They would depend mainly on how the RUK, the EU, and NATO decided to respond to a Yes vote, and how moderate a newly independent Scotland would be in its negotiating positions. If cool heads prevail, Scottish independence could proceed at a relatively low cost.

The dangers of national secession are much greater in places without overarching entities like the EU and NATO to constrain the situation among the successor states. In such circumstances, unilateral claims of independence opposed by the national government or a sub-national unit often lead to a breakdown of trade and finance – and often to outright war, as we saw in the breakup of the Soviet Union, Yugoslavia, and most recently, Sudan.

In those cases, separation was indeed followed by deep economic and political crises, which in some ways persist. Indeed, in the case of ex-Yugoslavia and the former Soviet Union, the EU and NATO absorbed some but not all of the successor states, thereby raising major geopolitical tensions.

International politics in the twenty-first century can no longer be about nation-states alone. Most key issues that are vital for national wellbeing – trade, finance, the rule of law, security, and the physical environment – depend at least as much on the presence of effective regional and global institutions. Even if Scotland declares independence, it will – and should continue to be – bound by a dense web of European and global rules and responsibilities.

I am personally sympathetic to Scotland’s independence as a way to bolster Scottish democracy and cultural identity. Yet I support independence only on the assumption that Scotland and the RUK would remain part of a strong and effective EU and NATO.

Certainly, a Yes vote would put an even higher premium on effective EU governance. But, if the EU and NATO were to “punish” a newly independent Scotland by excluding it, real disaster could ensue, not only for Scotland and the UK, but also for European democracy and security.

See the original article >>

Another Reason the S&P 500 Could Reach 2500

by Greg Harmon

I spent a few minutes with Jeff Macke at Yahoo Finance last week talking about the S&P 500. I was a little afraid to meet him so I tried to be polite. In that interview I discussed how the current price action looked like consolidation on a longer term chart, but that 2390 was a good long term target. The full story and interview can be seen here. But there was one chart I left out because I did not want to scare him. Here it is.

spx

The chart above shows the Elliott Wave interpretation of the S&P 500 since 1993. If you don’t know Elliot Wave Principles see a 5 Wave impulsive structure in the direction of a trend followed by a 3 Wave corrective pattern. Within both the 5 and 3 Wave patterns the waves alternate positive and then corrective. The pattern can then repeat or do something else. This 5 Wave pattern played out from 1993 to 2000 followed by a 3 Wave correction that ended in March 2009.

Since then the new 5 Wave impulsive pattern has been running and it looks like Wave III has just completed. Moving into Wave IV might then be scary and cause worry of a pullback, and it could. But another principle of Elliot Wave is that is Wave II is a corrective pullback, then Wave IV often corrects mainly though time. It is flat. The Final Wave V then would project higher approximately the same length as Wave I, or to the 2400-2500 area.

As it turned out Jeff Macke was a very nice guy and friendly. And I hope you see now that Elliott Wave does not have to be scary either.

See the original article >>

Cash Only: Why Hoarding Cash Has Been A Savvy Move

by Chelsea Global Advisors

There are only two times in your life when you will need money: now and later. Hopefully, you are prepared for both occasions and if not, don't worry - there is plenty to go around! Cash, like all other asset classes, has time-varying preference and utility curves. Cash seems to be in ample supply when it's not needed and scarce when it is in high demand. Does this mean that there is now little demand for cash since cash balances are, by all accounts, at record highs? Or does it mean that there is just not all that much worth buying - so the cash tends to pile up? To turn the page, this analyst believes that today's high cash balances are the result of savvy moves by both companies and individuals that rightly anticipated U.S. dollar appreciation.

Older academics may refer to today's U.S. economy as a having a "Monetary Overhang," or a liquidity surplus. Monetary Overhang is a Soviet era term describing a situation where consumers and State Owned Enterprises (SOEs) accumulated cash in excess of desired amounts simply because there was a lack of ability to spend. In other words, there was little worth buying at advertised prices. How much are we talking about here? I loosely estimate there are about $4.7 trillion dollars of a monetary overhang - cash that is looking for a purpose. Here are my numbers:

(Trillions of USD)

Cash held by U.S. S&P firms [Source] $ 1.80

Cash held in U.S. money market accounts [Source] 2.70

Free cash balances in U.S brokerage accounts [Source] .20

Total $4.70

[I purposely excluded bank deposits - circa $10.2 trillion per Fed Weekly H.8 from the above analysis, since these sums tend to be used to facilitate operational transactions such as paying bills. However, I recognize that this point is highly debatable, and many people use deposits as a savings vehicle.]

Interestingly the savants over at JPM recently estimated excess liquidity at near five trillion U.S. dollars based upon their proprietary regression model. I do not have access to their paper, but you can find a summary here. So the numbers are big and are at extreme levels. There may be a bit of double counting here - U.S. corporations can place funds into money market accounts, but the larger point remains: there is a lot of cash that is looking for a home. A quick diversion is in order here. To be an effective metric of excess savings or liquidity, the measure must provide an a priori equilibrium value. That means you need a benchmark value to compare current readings against a reference value. For corporations, that tends to be about 1% of sales; for Banks it is whatever the Fed says it should be…or enough cash to cover 30 days' worth of contractual and contingent cash flows. For individuals, it is about one years' worth of average earnings.

Why are corporations and individuals so willing to hold cash at zero nominal rates and negative real rates? The textbook answer is, of course that there is always a precautionary hoarding of cash in times of high economic uncertainty. However, according to the team of Baker, Davis and Bloom, who attempt to quantify the degree of economic uncertainty, there is a bear market in ambiguity! Specifically, their three-factor model of uncertainty is near an all-time low. That fact may or may not tally with your situation and observations or indeed with reality. Still we are a long way away from the agonizing days of 2008-2009, so it remains puzzling why investors have parked so much cash on the sidelines. Before moving on, we should remember that holding idle cash provides many option like benefits, such as the ability to quickly invest as new opportunities arise, but also comes with a premium, i.e. the lost opportunity cost - which is somewhat counterintuitive, has rarely been lower!

Chart #1 Uncertainty Index(click to enlarge)

Excess cash held by corporations and individuals is expectedly, concentrated in just a few hands. Large mega-cap technology companies like Google, Apple and Microsoft mostly control (own) the large cash balances at S&P 500 companies. Cash placed by individuals in money market funds is also decidedly concentrated. Since the year 2000, cash placed in U.S. money market funds has grown by 47% whilst the number of individual shareholder accounts has fallen by 45%. [Source: ICI Statistics]. It is the same story with excess cash held as free credit balances in brokerage accounts, a luxury that few people can enjoy.

Consequently, excess cash is mostly held by large, sophisticated companies and individuals. These folks have seen the relative value of their cash appreciate by nine percent, despite zero interest rates during the past few years due to U.S. dollar appreciation. These cash-rich companies and individuals can now deploy their appreciated dollars abroad to purchase relatively cheap foreign assets. Assets in the rest of the world have rarely looked so appealing for a U.S. dollar based investor.

What changes or factors will encourage or force companies and individuals to reduce their cash holdings? Here are four that I think are most relevant:

1. Higher than expected inflation and or central banks engineering real rates deeper into negative territory

2. Attractive opportunities to purchase real and financial assets at home or abroad

3.Government confiscation of excess savings by higher tax rates or by implementing a wealth tax

4. Hubris leading to the acquisition of trophy assets at inflated prices i.e. irrational exuberance

Stockpiling of cash for the last three years has proved profitable or at least not a performance drag, despite low nominal rates, for both companies and individuals thanks to USD appreciation. Stick with cash if you think that trend will continue and you are looking to invest in non-dollar assets. If, on the other hand, you cannot take advantage of the strong U.S dollar, a supposedly risk free cash position is, in fact, very risky.

See the original article >>

Keys To International Investing: Momentum And Low Volatility

By Nick Kalivas

Although the twin headwinds of economic and geopolitical uncertainty are buffeting international markets, stocks in developed international markets invite closer examination. Historically low interest rates, supportive central bank policy, relatively attractive valuation and the chance for returns to experience mean reversion - or a move back toward average - may frame an opportunity for international developed market equities to outpace the S&P 500 Index.

Catalysts for potential outperformance

Let's explore four reasons why international developed market equities appear attractive, in my view.

First, I believe the potential for mean reversion in price return argues for improved performance. The price return ratio spread between the S&P 500 Index and MSCI EAFE Index is flirting with highs last seen in 1971 and 2000, and is moving toward the upper end of the range seen since 1970. As the graph below illustrates, the price ratio spread is 1.04, which is 1.78 standard deviations above the mean.1 Normalization in the spread relationship could suggest stronger relative performance for the MSCI EAFE Index.

International Equities: Mean Reversion in Price Return May Signal Improved Performance

Source: Bloomberg L.P., as of Aug. 29, 2014

Second, monetary policy is diverging among the Federal Reserve (Fed), European Central Bank (ECB) and Bank of Japan (BOJ). There is speculation that the ECB will provide additional stimulus at a time when the Fed is tapering and ending its bond-buying program. Meanwhile, the BOJ is continuing to add liquidity to offset the impact of a sales tax hike and solidify a rise in inflation and economic growth. I believe this divergence in monetary policy argues for a strong dollar, which may benefit the profit outlook for European and Japanese exporters.

Third, historically low sovereign yields in the eurozone and Asia may improve the valuation proposition of Eurozone and Japanese stocks. Moreover, low rates could cause investors to look at equities for income. As of Aug 29, 2014, the German and Japanese 10-year treasury yields were trading at less than 90 basis points and 50 basis points, respectively.1

Finally, valuation appears attractive.The MSCI EAFE Index is trading at a discount price/earnings ratio of about 1.25 versus the S&P 500 Index, and it has a dividend yield of 3.35% -more than triple the yield on a German one- year note.1

Accessing international developed markets

Against the backdrop of ongoing geopolitical tensions, uncertain growth prospects in Europe and Japan and a likely search for yield, investors may want to talk with their financial advisors about gaining access to these markets through a combination of momentum and low volatility stocks. Here's why:

  • The momentum factor may give investors exposure to the potential upside in a bull market.
  • The low volatility factor may help mitigate the downside during periods of market turbulence.

A combination of the two factors may offer investors a way to better manage what could be a friendly environment for equities, while helping them to control risk.

Learn more about PowerShares S&P International Developed Low Volatility Portfolio (NYSEARCA:IDLV) and PowerShares DWA Developed Markets Momentum Portfolio (NYSEARCA:PIZ), which offer exposure to these factors in international markets.

Source

  1. Bloomberg L.P., as of Aug 29, 2014

Important Information

There are risks involved with investing in ETFs, including possible loss of money. Shares are not actively managed and are subject to risks similar to those of stocks, including those regarding short selling and margin maintenance requirements. Ordinary brokerage commissions apply. The fund's return may not match the return of the underlying index.

Shares are not individually redeemable and owners of the shares may acquire those shares from the funds and tender those shares for redemption to the funds in creation unit aggregations only, typically consisting of 50,000, 75,000, 100,000 or 200,000 shares.

Investments focused in a particular industry are subject to greater risk, and are more greatly impacted by market volatility, than more diversified investments.

Equity risk is the risk that the value of equity securities, including common stocks, may fall due to both changes in general economic and political conditions that impact the market as a whole, as well as factors that directly relate to a specific company or its industry.

A basis point equals 1/100th of 1% and is used to denote the change in a financial instrument.

See the original article >>

Diversification At Its Best

by Jason Draut

Stocks are flying high and equity markets feel like a low-risk, high-return, can't-lose investment right now. Each sell-off stops after just a few percentage points of decline and then moves on to new all-time highs. At the same time, most people think the 30-year Treasury bond has excessive interest rate risk for very little yield. Aren't all the experts saying we are headed for higher interest rates and therefore a sell-off in bonds? With a yield of 3.3%, the 30-year Treasury bond is not exactly something people get excited about.

Nonetheless, let's investigate the benefits of holding long-dated Treasuries as a diversifier for stocks. To analyze this, we take two well-known ETFs, SPDR S&P 500 ETF (NYSEARCA:SPY) and iShares 20+ Year Treasury Bond ETF (NYSEARCA:TLT), and use monthly returns to compare the performance and risk of various portfolios with different amounts of each of these two assets. To start we can look at the two assets in isolation, i.e., a portfolio of 100% SPY vs 100% TLT. We want to know about the portfolios' returns as well as their risk. To do this we look at several statistical measures:

  1. Annualized returns
  2. Annualized volatility (standard deviation of the monthly returns scaled by the square root of 12)
  3. Maximum drawdown (worst peak-to-trough performance in full sample)
  4. Sharpe Ratio (annualized excess return over 3-month T-bills divided by annualized volatility)

These measures can give us a good sense of how the portfolios' risk and returns compare. Before getting to the statistics, here's a chart of the two assets total returns since 1992 for some context on how the assets have performed over time. The ETF returns are taken from Yahoo! Finance. In order to have data that was contemporaneous and covers as much history as possible TLT's benchmark returns are used as a proxy before its 2002 inception date and similarly SPY's benchmark returns prior to its 1993 inception. The TLT benchmark started in February 1992, so this study begins that month as well. The chart below shows the pre-tax account value for a $100 investment in each asset starting in February 1992. The y-axis is on a log scale so that a 1% change in value in 1992 looks the same as a 1% change in value in 2014.

(click to enlarge)

Now let's look at the various statistics to see how the two assets perform by the numbers. In terms of returns and risk (volatility) the two assets are similar with SPY having slightly higher returns as well as slightly higher volatility. They turn out to have almost exactly the same Sharpe ratio, but the differentiator comes when looking at drawdowns. SPY has experienced a 51% drawdown (2007-09) whereas TLT's maximum drawdown was only 22%.

(click to enlarge)

Despite all the fears of rising interest rates, at Wynn Capital Management we think equities are at a greater risk of a major drawdown. Even looking at the largest interest rate increase on record in the late 1970s (1977-1981) the 30-year Treasury bond lost about 25% in that four year period (estimated using simple bond model in Excel) after taking interest payments into account. Given the currently low interest rate of 3.3%, long-dated Treasuries don't have quite the safety net from high interest payments (the 30-year Treasury bond yield was over 7% in 1977), but they are also very unlikely to have interest rates move up as quickly as the 1970s given the current low level of inflation, especially the low wage inflation.

Now let's investigate what happens when we combine SPY and TLT into a mixed portfolio. For all the results below, we rebalance the portfolio back to the starting weights each January. Let's start with a fairly small addition of TLT to SPY, say 80% SPY and 20% TLT.

(click to enlarge)

The results are impressive. Adding a lower total return asset to the 100% SPY portfolio actually increases the total return! This is a result of the annual rebalancing that buys more of the asset that has underperformed and sells the asset that outperformed in the prior year. Each year we buy one asset at a discount and sell the other at a premium. The outperformance of the 80/20 portfolio versus the 100% SPY portfolio is certainly not guaranteed going forward, but we can expect annual rebalancing to outperform over a market cycle versus the investor who buys the 80/20 portfolio at the beginning of the cycle and never rebalances. Along with the somewhat surprising results in portfolio returns, the realized volatility of the portfolio drops significantly from the 100% SPY volatility level. It is basically the same as the 100% TLT portfolio. This is due to the wonders of combining uncorrelated assets in a portfolio (diversification!). If you look back at the first time-series chart of total return, you will see that when SPY goes down, TLT often (but not always) goes up. They are actually slightly negatively correlated in the 22-year data sample used in this study. Given this increase in returns and decrease in risk it is no surprise that the Sharpe ratio goes up significantly. The maximum drawdown decreases basically in proportion to the volatility since the equity risk dominates the portfolio risk for this ratio of stocks to bonds (80/20).

Next let's do this same analysis for a portfolio with a larger proportion of bonds. We take the standard 60/40 ratio as our final example, so we rebalance the portfolio to 60% SPY and 40% TLT at the beginning of each calendar year.

(click to enlarge)

The advantages or rebalancing continue to keep the total returns above either of the individual assets, and the level of volatility comes down even more. The mixed portfolio's realized volatility continues to drop and the Sharpe ratio continues to rise. As the bond asset starts to contribute to portfolio risk the maximum drawdown starts to decrease faster than the volatility does. Continuing to increase the percentage of TLT in the portfolio causes these trend to continue until we get to an SPY weight near 40% where the annualized volatility falls to about 8.3%. The Sharpe ratio peaks just above 0.75, again this occurs when the portfolio mix is near 40% SPY and 60% TLT. At this level the maximum drawdown falls all the way to 16%, below either individual asset's maximum drawdown. Now that is diversification at its best! The annualized total returns for this 40/60 portfolio are basically equivalent to the 100% SPY portfolio at 9.5% (Thank you, Annual Rebalancing!). The fact that the volatilities of the two assets are similar is quite important for gaining these benefits of diversification. Using a lower volatility bond asset, like the iShares Core US Aggregate Bond ETF (NYSEARCA:AGG), the maximum drawdown and Sharpe ratios don't improve nearly as much until the portfolio holds well over 50% AGG, and then returns fall noticeably as well.

Before you go buying a big chunk of TLT, you must remember that at the beginning of February 1992 the 30-year Treasury bond had a yield of 7.8%. It's no coincidence that TLT has returned 8.0% annualized since then. Future returns of Treasuries are highly dependent on their current yield, even when you roll the bonds to keep the maturity constant as TLT does. That is a topic for a separate article, but the basic idea is that if you roll the 30-year bond each year into the next 30-year bond (something akin to what TLT does), you will take some loses if rates rise in a given year, but you will then have a higher yielding asset and these two effects largely cancel each other out over the long-term. We expect TLT to return about 3% annualized over the next 20-30 years, not the 8% we have seen in the past 20 years. This does not tell us much about the fund's returns next month or next year only that we can expect around 3% over the long term. At the same time the US equity market has had many 20-year periods where annualized total returns were under 5% (see Crestmont Research for a great summary of historical S&P 500 returns). Given current valuations, it would not be a surprise if the next twenty years fell into that category for equities, so don't think 3% for a long-term return is all that bad in today's market environment either! Forecasting long-term equity market returns is yet another topic for a separate article so we won't go any further into that. Investigating the benefits of diversification across uncorrelated assets is really the goal here. Let's close with one final chart that shows the two mixed portfolios total realized returns over time alongside SPY and TLT. It illustrates the main points of this article in a single picture.

(click to enlarge)

The two mixed portfolios give up some of the gains in equity bull markets, but they make up for it with smaller losses in the bear markets. This can allow an investor to sleep better at night with less volatility and smaller drawdowns. We think it's worth the reduced upside in euphoric bull markets. Finally, the concepts of diversification and rebalancing discussed here also apply to larger groups of assets, but we chose to use SPY and TLT to illustrate the effect in a simple and clear way. We are not suggesting that this two-asset portfolio is all there is to building a diversified portfolio. It's really is just the beginning.

See the original article >>

Great trade on Tesla (TSLA)


TSLA Beautiful Sell Short set-up on Tesla (TSLA) with our strategy Super Stocks, gained 6.84% yesterday.

Sell ​​the highs and buy the lows is priceless!

Markets’ Rose-Tinted World

by Mohamed A. El-Erian

LAGUNA BEACH – This has been an unusual year for the global economy, characterized by a series of unanticipated economic, geopolitical, and market shifts – and the final quarter is likely to be no different. How these shifts ultimately play out will have a major impact on the effectiveness of government policies – and much more. So why have financial markets been behaving as if they were in a world of their own?

Apparently unfazed by disappointing growth in both advanced and emerging economies, or by surging geopolitical tensions in Eastern Europe and the Middle East, equity markets have set record after record this year. This impressive rally has ignored a host of historical relationships, including the long-established correlation between the performance of stocks and government bonds. In fact, correlations among a number of different financial-asset classes have behaved in an atypical and, at times, unstable manner.

Meanwhile, on the policy front, advanced-country monetary-policy cohesion is giving way to a multi-track system, with the European Central Bank stepping harder on the stimulus accelerator, while the US Federal Reserve eases off. These factors are sending the global economy into the final quarter of the year encumbered by profound uncertainty in several areas.

Looming particularly large over the next few months are escalating geopolitical conflicts that are nearing a tipping point, beyond which lies the specter of serious systemic disruptions in the global economy. This is particularly true in Ukraine, where, despite the current ceasefire, Russia and the West have yet to find a way to ease tensions definitively. Absent a breakthrough, the inevitable new round of sanctions and counter-sanctions would likely push Russia and Europe into recession, dampening global economic activity.

Even without such complications, invigorating Europe’s increasingly sluggish economic recovery will be no easy feat. In order to kick-start progress, ECB President Mario Draghi has proposed a grand policy bargain to European governments: if they implement structural reforms and improve fiscal flexibility, the central bank will expand its balance sheet to boost growth and thwart deflation. If member states do not uphold their end of the bargain, the ECB will find it difficult to carry the policy burden effectively – exposing it to criticism and political pressure.

Across the Atlantic, the Fed is set to complete its exit from quantitative easing (QE) – its policy of large-scale asset purchases – in the next few weeks, leaving it completely dependent on interest rates and forward policy guidance to boost the economy. The withdrawal of QE, beyond being unpopular among some policymakers and politicians, has highlighted concerns about the risk of increased financial instability and rising inequality – both of which could undermine America’s already weak economic recovery.

Complicating matters further are the US congressional elections in November. Given the likelihood that the Republicans will continue to control at least one house of Congress, Democratic President Barack Obama’s policy flexibility will probably remain severely constrained – unless, of course, the White House and Congress finally find a way to work together.

Meanwhile, in Japan, the private sector’s patience with Prime Minister Shinzo Abe’s three-pronged strategy to reinvigorate the long-stagnant economy – so-called “Abenomics” – will be tested, particularly with regard to the long-awaited implementation of structural reforms to complement fiscal stimulus and monetary easing. If the third “arrow” of Abenomics fails to materialize, investors’ risk aversion will rise yet again, hampering efforts to stimulate growth and avoid deflation.

Systemically important emerging economies are also subject to considerable uncertainty. Brazil’s presidential election in October will determine whether the country makes progress toward a new, more sustainable growth model or becomes more deeply mired in a largely exhausted economic strategy that reinforces its stagflationary tendencies.

In India, the question is whether newly elected Prime Minister Narendra Modi will move decisively to fulfill voters’ high expectations for economic reform before his post-victory honeymoon is over. And China will have to mitigate financial risks if it hopes to avoid a hard landing.

The final source of uncertainty is the corporate sector. So far this year, healthy companies have slowly been loosening their purse strings – a notable departure from the risk-averse behavior that has prevailed since the global financial crisis.

Indeed, an increasing number of firms have started to deploy the massive stocks of cash held on their balance sheets, first to increase dividends and buy back shares, and then to pursue mergers and acquisitions at a rate last seen in 2007. The question is whether companies also will finally devote more cash to new investments in plant, equipment, and people – a key source of support for the global economy.

This is a rather weighty list of questions. Yet financial-market participants have largely bypassed them, brushing aside today’s major risks and ignoring the potential volatility that they imply. Instead, financial investors have trusted in the steadfast support of central banks, confident that the monetary authorities will eventually succeed in transforming policy-induced growth into genuine growth. And, of course, they have benefited considerably from the deployment of corporate cash.

In the next few months, the buoyant optimism pervading financial markets may prove to be justified. Unfortunately, it is more likely that investors’ outlook is excessively rosy.

See the original article >>

Finding Fashion in Asian Small Caps

by Liliana Castillo Dearth

Investors looking for the kind of growth that up-and-coming smaller companies can deliver can’t afford to ignore Asia. We see exciting niche opportunities there—but finding them requires patience and on-the-ground expertise.

This summer we visited with more than 70 senior executives at small- and mid-cap companies in seven Asian countries, including developed economies such as Japan and Singapore and emerging markets like the Philippines and Vietnam. There are opportunities in all of these countries.

But we’re not talking about household names.

Fewer than half of the firms we visited have much brand recognition outside the region—only 40% conduct “road shows” abroad to publicize security offerings to potential foreign investors. So, it’s easy for investors who don’t dig deeply into the Asian SMID-cap landscape to miss opportunities.

Taiwan’s Rising Textile Stars
Among the potential hidden gems, in our view, are some of Taiwan’s textile makers. Many of these firms have made significant investments in functional fabrics—materials ideal for athletic apparel that’s useful and fashionable. These investments are starting to pay off, thanks to a surge in global demand for fashion-forward sportswear.

The demand comes primarily from members of the fitness-conscious millennial generation, defined as people born between 1980 and 2000. Millennials put a premium on healthy living and the latest styles—they eat well, exercise often and want to look good doing it.

In a recent report, Goldman Sachs estimated that health-conscious and hyperactive millennials will, over the next five years, go from being the smallest spenders on consumer staples and discretionary items to the biggest spenders, with average annual growth of 3%–4%. Baby boomers’ spending on these items, by contrast, will decline by about 2% a year over the same stretch.

What’s more, Euromonitor International estimates that global sales of sports apparel, which have been rising steadily since 2007, will total $219 billion in 2018, compared with $162 billion last year (Display).

We think all of this adds up to healthy growth potential for textile firms with the ability to supply Nike, Under Amour and other athletic apparel and footwear makers with clothing that’s both functional and fashionable.

Catering to the Wellness Generation
During our travels, we found that the brightest stars in Taiwan’s textile universe are working closely with their clients to roll out fashion-forward athletic gear that can also be worn in casual, everyday settings.

For many, that effort has involved working with designers such as Stella McCarthy and Jason Wu—one of Michelle Obama’s favorite designers—to produce appealing garments with bright colors and stylish digital prints; threads that look as good as they feel.

The savviest companies are also innovating and filing for patents. Among the focus areas are polyester blends that pull moisture away from the body instead of retaining it, and fabrics that protect against sun, water and cold weather. As functional fabric orders from top global retailers pile up, astute firms are investing in production capacity to accommodate the thinner, stronger fabrics consumers want—capacity that’s still lacking in the region.

Production: Getting Cheaper and Greener
Many firms are also putting their money to work by investing in new factories in Southeast Asia. Labor costs there are lower than in China, home to most current production. Cambodia and Vietnam are attracting significant investment, as tariff-free export arrangements with Europe, Japan and the United States have the potential to increase profit margins. We noticed that firms are also devoting more investment to automated equipment that will speed up production and cut costs.

Savings on the labor front will be critical for the textile winners: Stricter wastewater treatment standards in China, Vietnam and elsewhere will require investment in green technologies. Among these is water-free dyeing, a process that eliminates wastewater altogether. In our view, firms that have the technical and financial know how to address these issues are most likely to pull away from the pack.

We think investors may be able to earn a similar sort of competitive advantage by looking closely at Taiwan’s textile sector and its most promising up-and-coming firms. SMID-cap stocks around the world tend to get less research coverage than large-caps. As we’ve noted, that’s especially true of many Asian firms with limited global name recognition.

While flying below the radar can make these stocks more volatile, it also creates more chances to capitalize on growth potential that the broader market hasn’t discovered yet. In investing, as in fashion, it pays to be ahead of the trend.

See the original article >>

The Government Europe Deserves?

by Daniel Gros

BRUSSELS – With the final allocation of portfolios within its executive branch, the European Commission, the European Union has completed its change of guard. The process took almost four months, following the European Parliament election in late May, and the end result was inevitably based on a series of compromises – to be expected for an EU of 28 prickly nation-states.

Indeed, the proper functioning of EU institutions requires that no important constituency (left or right, East or West, and so forth) feels left out. And the new European Commission looks rather strong, given that more than 20 of its 28 members previously served as prime ministers, deputy prime ministers, or ministers. People who have held high political office at home find it worthwhile to come to Brussels.

But most attention has focused on the EU’s three top positions: the President of the European Commission, the President of the European Council, and the High Representative for external affairs.

The Commission’s new president, Jean-Claude Juncker, was the first ever to be selected based on his faction’s strong showing in the European Parliament election. As a seasoned Brussels insider, he was not one to move the crowds. But sometimes this can be an advantage. An insider knows best how to reconcile contrasting interests and how to get the institutional machinery moving again, as Juncker showed with his deft handling of the distribution of tasks among the individual Commissioners.

Selecting the president of the European Council required considerable time and horse-trading, with Polish Prime Minister Donald Tusk emerging as the final choice. But, though Tusk now has an important-sounding position, the European Council President decides nothing. The president mainly presides over the meetings of the EU’s national leaders, and an incumbent’s influence depends on his or her ability to set the agenda and facilitate compromises.

The experience of the previous incumbent, former Belgian Prime Minister Herman van Rompuy, in dealing with his own country’s fractious coalitions proved very useful when he had to persuade national leaders to make decisions during the euro crisis. Tusk will have to achieve something similar in the face of the new challenges confronting Europe today, which include Russian aggression in Ukraine, the rise of terrorism in the Middle East, and a stagnant economy at home.

On the EU’s most immediate challenge, posed by Russia, Tusk will have to broker decisions with leaders from countries that feel immediately threatened (like his own) and those for which economic ties with Russia outweigh any threat to European security, which they feel to be remote. On the economy, he must reconcile the priorities of full-employment Germany with those of Greece and Italy, which remain in the grip of recession and sky-high unemployment. Being able to converse directly with the Council’s members, mostly in English, might be the biggest immediate challenge, as he admitted immediately.

The appointment of the Italian foreign minister, Federica Mogherini, as High Representative of the Union for Foreign Affairs and Security Policy has been widely questioned, owing to her limited executive experience in foreign policy. But, since the de facto invasion of Ukraine in late August, her government has changed its position on Russia, and she has sought to convince many critics that she knows the problems facing Europe well (her university thesis, for example, was about political Islam).

But can she lead? Europe’s foreign service, the European External Action Service (EEAS), is a huge bureaucracy, which must be managed well if it is to be effective. And, though the head of the EEAS has been dubbed the “EU’s foreign-policy chief,” Mogherini should be seen as its CEO, with key decisions taken by the member states’ leaders when they convene in the European Council. Her lack of managerial experience is thus her key weakness, and she will have to find a strong team to support her.

But there is at least one encouraging, if hidden, signal from Mogherini’s appointment: The fact that the European Central Bank President Mario Draghi is also an Italian was not an impediment. This implies that the ECB presidency is not counted among the posts to be distributed according to nationality quotas, and that Draghi’s nationality is not regarded as having influenced his decisions in any way.

Leaders of the EU’s institutions have to be political entrepreneurs if they are to leave a mark on history. Their decision-making power is limited. But they can often frame the choices and broker coalitions to push the existing boundaries of European integration. None of the EU’s top three new faces (Juncker, Tusk, and Mogherini) has a track record in this sense. Evidently the national bosses like it that way.

The most sobering message from the appointment process is thus that the member states’ leaders will not suffer anyone who might rock the boat and push integration forward. There will be little movement toward the “ever closer union” envisioned in the Treaty of Rome. That might come as a relief for those in the United Kingdom and elsewhere who fear domination by Brussels, but it can only dismay those who hope that, despite its sluggish economy and declining population, Europe can become a relevant global actor.

See the original article >>

Follow Us