 |
Tuesday, April 8, 2014
Control your risk with simple and winning rules – SuperStocks trading signals for 9 April
| Super Stocks Trading Signals Report | |
| Latest Free Trading Alerts for 9 April | Download Historical Results |
| Open position value at 8 April $ 4,302.86 | 2014 P/L +3.70% |
| Mixed long/short open position | In true signal service, attachments reports are sent to customers also via email, in the evening after the markets close. Those who wish to receive them during the demo, please send me their email address. |
| We are happy to offer free signal service for Super Stocks until the end of March | Please send me your email address so I can invite you on my server to do the demo. Mail me to take the offer and start the free service until the end of March michele.giardina@quantusnews.com |


| Material in this post does not constitute investment advice or a recommendation and do not constitute solicitation to public savings. Operate with any financial instrument is safe, even higher if working on derivatives. Be sure to operate only with capital that you can lose. Past performance of the methods described on this blog do not constitute any guarantee for future earnings. The reader should be held responsible for the risks of their investments and for making use of the information contained in the pages of this blog. Trading Weeks should not be considered in any way responsible for any financial losses suffered by the user of the information contained on this blog. |
Will The 'Mini Stimulus' Save China's Sputtering Economy?
By IG Australia
Why Bitcoin is Important
By: Chris Tell
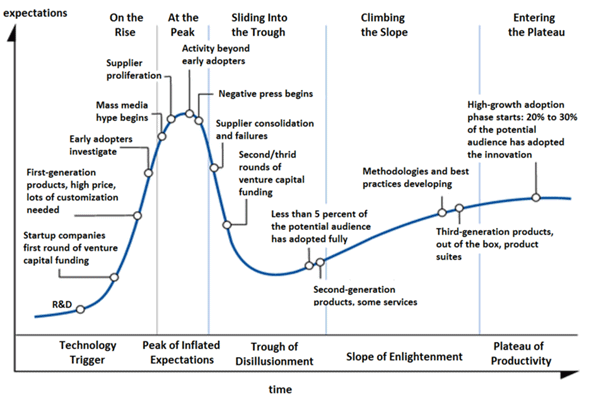
| Bitcoin is the anti currency”; “Bitcoin, the currency of the future”; the “currency of the resistance”; “Bitcoin is a Fad”; “Bitcoin is a fraud”; “Bitcoin is a currency for drug dealers, kiddy fiddlers and terrorists.” These are some of the opinions I’ve heard thrown around when discussing Bitcoin. I have no particularly original insights into Bitcoin, and I won’t pretend to understand the technology behind it. I can barely understand how my coffee machine makes such great coffee. This is the complexity of the world. Firstly, let me say that we think Bitcoin is “cool”. I love disruptive technologies. 5000 years ago shipping changed the world. I discussed this in depth in an article entitled Predicting Prosperity. I alluded to the “Guano age” of the 1800′s which was destroyed by the advent of nitrate-based fertilizers. The Internet, at least, the Internet that most of us know has only really existed since the mid-90′s, and even then VOIP and data streaming were far from common. Technologies which we take for granted today have often only been around for less than a decade. Yet we’re all comfortable enough with them. In the 1990′s the first fibre optic cables where being laid allowing for what would become the world wide web. Who could have known who was going to profit and who was going to fail? When a friend introduced us to Bitcoin nearly 4 years ago now we were busy, looked quickly at it, decided we didn’t understand it and dismissed it as quackery of some kind. This despite our friend being a man we hold in very high regard. Hindsight, as they say is 20:20. It was still very early days in Bitcoin history. Fast forward to today and we’ve spent more time learning about digital currency (not Bitcoin per se) and this is how we see it. The Mania Circumstances change, technology changes, environment changes but human behaviour never changes. I found the chart below from Gartner. It provides us with a visual image of what I’m talking about.
Please note that I’m not a Bitcoin bull or bear. I think people miss the point behind Bitcoin and that point is simply that Bitcoin is at its core a technology. That technology has been replicated to a large extent with dozens of other digital currencies. As such there is no particular moat around Bitcoin other than first mover advantage. First mover advantage in technology is not always all it’s cracked up to be, heck Netscape had first mover advantage to right? The value lies not in Bitcoin but in the technology. Technology is a market I can understand and play in. Trading, or rather gambling on what price a Bitcoin should trade for isn’t. How useful then is the technology? As Goldman Sachs IT analyst Roman Leal argues:
I don’t care who you are, these sorts of numbers are compelling and the odds favour this technology being utilized in the future. I believe that the technology is here to stay. That doesn’t mean that Bitcoin is here to stay. I have no idea but I do think that the cat is out of the bag in terms of the technology. How Best to Play It The market is currently disillusioned with the price of Bitcoin. It’s collapsed from well over $1,000 to just over $400 today. The companies we’ve been speaking to, who not 6 months ago had all the arrogance of a pimply-faced teenager who’d found the powers of tequila and testosterone, today sport far humbler valuations! The sector is ripe for discerning investment and we’re actively exploring private equity in this sector. Our friends at Pathfinder Capital have setup the first FSA regulated crypto technology fund. We think they are on the right track! Target the companies building the ecosystem and the platforms that will drive innovation. Let others try to figure out which “currency unit” will win. |
Most Volatile Stocks on Earnings
by bespoke
| Each quarter just before earnings season, we provide a list of the stocks that have historically seen the biggest moves on their earnings report days. In our Interactive Earnings Report Database (available to Bespoke Institutional members), we have the price action around earnings for every company that has reported over the last 13 years. This allows traders and investors to easily track how specific companies trade on earnings. From our database, we created the chart below that shows the average one-day change on earnings by sector. (For companies that report before the open, we use that day's change. For companies that report after the close, we use the next day's change.) As shown, the average one-day change on earnings for all stocks in our database is 5.41%, so in general, you can expect the average company to move +/-5.4% on the day of its earnings report. Unsurprisingly, Technology stocks are the most volatile around earnings, with an average one-day change of +/-7.14%. Consumer Discretionary stocks are the second-most volatile at +/-6.18%, followed by Health Care (which includes Biotech) at +/-5.77%. If you're looking for stability, Utilities stocks move the least in reaction to their earnings reports, with an average one-day change of just +/-2.15%. Financial stocks are the second least volatile at +/-3.61%.
Below is a list of the stocks that have historically seen the biggest moves on their earnings report days. To be included in the list, a stock must have at least 12 quarters (3 years) worth of earnings reports. As shown, BroadSoft (BSFT) is the most volatile stock in our database with an average change of +/-16.59% on earnings. That means that each quarter, you can expect the stock to have a one-day change of more than 16% in either direction! Fuel Systems Solutions (FSYS) is not far behind in second at +/-16.38%, while Intralinks Holdings (IL) ranks third at +/-15.07%. The most notable names on the list are probably Netflix (NFLX), First Solar (FSLR), Priceline Group (PCLN) and Intuitive Surgical (ISRG), but basically it's made up of a who's who of the stocks that traders look to for action. A lot of these stocks have gotten slaughtered leading up to their upcoming earnings report dates, so this quarter we are also including how far each stock on the list is from its 50-day moving average. Companies that have moved into deep oversold territory will be fun to watch this season. Given how much they have fallen, you would expect the ones that report much stronger than expected earnings to snap back pretty significantly. For more in-depth earnings season analysis, head on over to Bespoke Premium and sign up for a 5-day free trial today. Click here to see all of the earnings-related products that are included with the Premium service. To access our Interactive Earnings Report Database, become a Bespoke Institutional member today.
|


4 Key Stocks Face Earnings Test
by Tom Aspray
| Stocks opened weak again, Monday, and stayed under pressure for most of the day. The major averages did close above the lows as they are quickly approaching more important support. The PowerShares QQQ Trust (QQQ) closed well below its quarterly pivot at $87.47 with quarterly S1 support at $83.59. The Spyder Trust (SPY) and SPDR Dow Jones Industrials (DJI) are still holding above their quarterly pivots at $183.25 and $160.88 respectively. As I mentioned last week, there are more signs that the Dow stocks are becoming market leaders. The Eurozone markets are lower again in early trading, with the US futures showing slight losses. The McClellan oscillator has dropped further to -108 and is just above the late March low of -115. It needs a day of strong A/D numbers in the next day to form a pattern that is consistent with a pullback in an uptrend. The Arms Index closed at 1.48 but is still well below the March highs of 1.74 and 2.48. With little economic data this week the focus is, of course, on the earnings season. The outlook for earnings has become more pessimistic since the start of the quarter as FactSet estimates that 1st quarter earnings for the S&P 500 are expected to decline by 1.2%. Also, 93 S&P 500 companies have given negative guidance on their earnings and only 18 companies have upped their earnings guidance. With market expectations so low, I would not be surprised if the earnings season actually beats expectations. These four stocks report this week and may give us an important inside look at three important sectors.
Chart Analysis: Alcoa, Inc. (AA) has done quite well since it was replaced on the Dow Industrials as it has risen over 50% since it was dropped from the Dow.
Bed Bath and Beyond (BBBY) slashed 4th quarter earnings estimates in early January and the stock plunged from a high of $80.70 to close the week at $69.94. By early February, it was down to $62.12 and below the weekly starc- band (see arrow).
JPMorgan Chase (JPM) hit a high of $61.09 in late March, and then last Friday, failed to exceed those highs.
Wells Fargo & Company (WFC) also reports its earnings before the opening on Friday. The daily chart shows the new high Friday at $50.49 and then a lower close.
What It Means: Though the daily technical outlook for Alcoa, Inc. (AA), JPMorgan Chase (JPM), and Wells Fargo & Company (WFC) does allow for a further decline over the near term, the longer outlook is positive. The technical outlook for the financial and materials sectors is positive. I would be looking at both JPM and WFC if they get down to their quarterly pivots as AA is part of the Charts in Play portfolio. Bed Bath and Beyond (BBBY) reports its earnings after Wednesday’s close and does look the most vulnerable to heavier selling. The rebound from the January lows appears to be a continuation pattern, which does favor a renewed decline. How to Profit: No new recommendation. Portfolio Update: Long Alcoa, Inc. (AA) from 10.86 and sold 1/3 of the position on March 20th’s opening at $11.80. Use a stop at $11.35 on the remaining position. |


The Irresistible Future of Natural Gas
What's Up With Nasdaq?
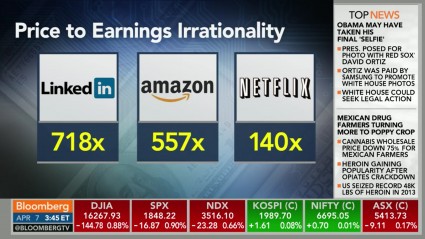
| All of a sudden, the Nasdaq is absolutely tanking. On Monday, it fell more than 1 percent after dropping 3.6 percent on Thursday and Friday combined. At this point, the Nasdaq is off to the worst start to a year that we have seen since 2008, and we all remember what happened back then. So why is this happening? In recent years, the Nasdaq has been ground zero for "dotcom bubble 2.0". The hottest stocks in the entire world are on the Nasdaq - we are talking about stocks like Yahoo, Netflix, Apple, Tesla, Google and Facebook. Those stocks have gone to absolutely incredible heights, but now they are starting to fall. Some are blaming insider selling, and without a doubt the "smart money" is starting to flee the stock market. Just check out this chart. Others are blaming low expectations for first-quarter earnings or the tapering of quantitative easing by the Federal Reserve. But whatever is causing this decline, it is starting to get alarming. The Nasdaq just experienced its largest three day fall since November 2011. No stock can resist gravity forever. What goes up must eventually come down. This is especially true for stock prices that become grotesquely distorted. On Wall Street, a price to earnings ratio of 20 to 25 is usually considered fairly normal. In recent years, the price to earnings ratios for many of these "hot tech stocks" have gone way, way beyond that. For example, posted below is a screen capture from Bloomberg TV that was featured in a recent Zero Hedge article...
There is no way in the world that such valuations are justified. We have been living in another dotcom bubble, and it was inevitable that it was going to burst at some point. The following is how one financial industry insider described the carnage that we have seen on the Nasdaq over the past few days... Gary Kaltbaum, president of money-management firm Kaltbaum Capital Management, describes the carnage of once high-flying "growth" names in the Nasdaq composite, that have come crashing down to earth: "The best we can describe what we have been recently seeing in 'growth-land' is a 50-car pileup," Kaltbaum told clients in a morning research note. "Call them what you want … risk areas, growth stocks, froth areas … they are melting away." And of course it isn't just the Nasdaq that has been seeing declines over the past few days. On Monday, some of the biggest names on the Dow also fell precipitiously... Visa, Goldman Sachs and Boeing are among the biggest drags on the Dow Monday, falling 2.1%, 2.9% and 1.4% respectively. Weakness in these stocks is especially problematic since the Dow gives greatest weight to the stocks with the highest per-share prices. And at $203.41, $158.56 and $125.59 respectively, Visa, Goldman and Boeing are the stocks that really matter to the measure. This recent decline has many analysts groping for answers. Some believe that it is simply a "rotation" as investors leave growth stocks that have become overvalued and move into safer, more traditional stocks. Others are pointing their fingers at the Federal Reserve... Peter Boockvar, chief market strategist at Lindsey Group, believes it's all about the Fed. "I'm still amazed at the complacency with the Fed taper, and a lot of people still don't think it's a big deal," he said. "I just don't think it's a coincidence that the high-fliers are getting popped when the Fed is half way done with QE. We've got tightening smack in front of your face with the taper." In fact, some believe that the really big stock market decline will happen later this year when the Fed starts to wrap up quantitative easing completely... Once the Fed begins to truly reduce its massive bond buying program later this year, markets could see a quarter of their value wiped off the books, a private equity pro told CNBC on Friday. Yet others point to the fact that we are now moving into earnings season, and it is being projected that corporate earnings will come in at very poor levels. In fact, it is being estimated that overall earnings for companies in the S&P 500 for the first quarter will be down 1.2 percent. So what should we expect to see next? Whether it happens this month or not, at some point a massive stock market correction is coming. In recent years, the financial markets have become completely and totally divorced from economic reality, and that is a state of affairs that cannot last indefinitely. Many have compared the current state of affairs to 2008, but to me what is happening right now is eerily reminiscent of 2007. The Dow soared to record heights quite a few times that year, but there were constant rumblings of economic trouble in the background. Stocks began to drop steadily late in the year, and 2008 ultimately turned out to be an utter bloodbath. I believe that what is happening right now is setting the stage for another financial bloodbath. I truly believe that we will look back on this two year time period and regard it as a major "turning point" for America. And as I have written about previously, we are in far worse shape as a nation than we were back in 2008. We have far more debt, the "too big to fail banks" have a much larger share of the banking industry, the derivatives bubble has gotten completely and totally out of control, and our overall economy is far weaker than it was back then. In other words, we are now even more vulnerable. When the next great financial crisis strikes us, it is going to be absolutely crippling. Now is not the time to get complacent. Now is the time to get prepared, because time is running out. |
Follow the money
Equities: The E-mini S&P 500 (CME:ESM14) is up 3 points to 1841 this morning. Overall, the market still looks like its in a bearish technical environment, with it being well below one of our key areas around 1865. We would not be surprised to see the market try to test the waters below 1800 sometime soon. Again, as long as the market is below our key level at 1865, we believe its in a bearish environment. |  |
| Bonds: The bonds are down 4 ticks to 133’10. It looks like the bonds are in a quiet range since the beginning of 2014. On one hand, we believe the reasons for the bonds to slide have to do with the Fed taperingand higher interest rate discussion. On the other hand, we have a potential reason to rally focused on the potential further decline of the stock market, as well as the uncertainty surrounding Russia and Ukraine. Thus, it looks like the bonds are in a tug of war so to speak. Currencies: This was the key sector with big movement in overnight trading. The British Pound (CME:B6M14) spiked higher to 167.37 on positive UK economic data. We believe the Pound is headed to 1.70. The Aussie is also up a good amount this morning; it is higher by 72 ticks to 92.98. It has rallied a lot this year, we believe it could be approaching overbought levels in the short term. The Yen is up 91 ticks to 97.92. We believe the Yen has potential to test the 100 level, and possibly even rally above that level.
Commodities: Coffee (NYBOT:KCK14) approached the $2 level in morning trade, and is now almost unchanged from yesterday’s close at $1.9425. MAY14 WTI crude oil is up $.69 to $101.13. The next key potential market mover for oil is tomorrow’s weekly report on Crude Oil supply. We believe crude oil may head lower from here. Corn has been in a strong uptrend, and today is up $.03 to $5.02. We believe $5 may be a magnet for corn, but also believe the $5.50 level may serve as a cap on corn prices. Gold (COMEX:GCK14) is up $10 to $1,308. Next $1,280, then $1,265 are very key support levels in our view, and $1,320 is a key resistance level. |

Italy's Renzi says he has found funding for tax cuts
By Stefano Bernabei
| ROME (Reuters) - Italian Prime Minister Matteo Renzi said on Tuesday he had found ways to fund a pledged 7 billion euro tax cut this year, moving to reassure sceptics and European officials that Italy does not plan to upend its public finances to fuel economic growth. Speaking to reporters before a cabinet meeting to lay out his new government's economic goals, Renzi shrugged off scepticism from opponents that a set of tax cuts were an electioneering gambit ahead of next month's European elections. "The tax cuts are funded from the very first day. You people don't believe it but we have been ready for three weeks," said Renzi, who took office in February after ousting predecessor Enrico Letta in a party coup. Renzi will hold a news conference at around 1930 (1730 GMT) after a cabinet meeting called to sign off on the Economic and Financial Document (DEF) which sets the framework for budget plans over the next three years. The DEF is expected to cut the previous government's growth forecast for this year, but make little change to targets for the fiscal deficit. The draft document must be presented to the European Commission for its approval. | 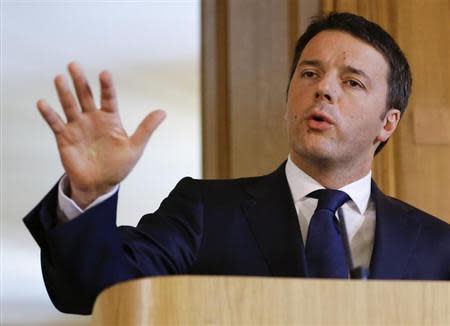 |
| "We only hope Renzi doesn't cook the books because the judges aren't only in Italy but also in Europe," said Renato Brunetta, lower house leader of Silvio Berlusconi's center-right opposition party Forza Italia. Most of the revisions to economic and public finance targets have been leaked in recent days, so attention at the news conference is likely to focus on any information Renzi offers on how he will fund his tax cuts. He has promised to reduce income tax on low earners by 80 euros per month from May, costing the state some 7 billion euros this year and 10 billion thereafter, and to finance the cuts mainly by reducing public spending. COMMUNICATOR However Renzi, a consummate television performer who is already campaigning for European Parliament elections in May, may give little detail and instead use the news conference to focus on popular moves with little impact on public accounts. These are likely to include plans to capping the pay of top public sector managers and scrapping some particularly superfluous public bodies. The 39-year-old former mayor of Florence is enjoying a honeymoon period with Italian voters who have warmed to his dynamism and quick-fire, informal communication style. He promised reporters on Tuesday the cabinet meeting and news conference would "all be over in time for the evening news." His center-left Democratic Party (PD) commands more than 30 percent of the vote in opinion polls, giving it a comfortable lead over the anti-establishment 5-Star Movement and Forza Italia, which both have less than 25 percent. But Renzi must still tread carefully. He has many enemies in his own PD party and among trade unions, and his popularity could easily evaporate if and when he takes tough decisions that threaten public sector jobs and vested interests. In the face of an icy reception from the European Commission Renzi appears to have already backtracked from an original plan to fund the tax cuts partly by increasing government borrowing. The target for the budget deficit this year is likely to be raised only marginally to 2.6 percent of output, from 2.5 percent, government sources have said, meaning the bulk of the tax cuts will need to be funded by lower spending. Renzi can count on some savings from lower debt servicing costs thanks to the recent fall in yields on Italian government bonds. But most economists believe his new, lower forecast for economic growth this year is still too optimistic. The International Monetary Fund on Tuesday forecast Italy will grow by just 0.6 percent this year after two years of contraction, while the DEF is expected to cut the government's official projection to 0.8 percent from 1.1 percent. |
Three Reasons Uncle Sam Took More Money from Your Pocket in 2013
| Many Americans made more money in 2013, thanks in part to last year’s soaring equity market and continuing economic recovery. Partly as a result, however, many Americans will be writing bigger checks to Uncle Sam come April 15. Here are the three things most people overlooked in anticipating their 2013 tax bill: 1. Tax rates went up Two big changes took effect January 1, 2013 that raised rates substantially for relatively high earners. The Patient Protection and Affordable Care Act of 2010 imposed a new, 3.8% net investment income tax, and the American Taxpayer Relief Act of 2012 created a top federal bracket of 39.6%. Together, these two laws created a 43.4% top federal tax rate for taxable interest, non-qualified dividends, and short-term capital gains, and a 23.8% top federal tax rate for long-term capital gains and qualified dividends. If you are a high-income earner, these rate hikes substantially increased your tax bill for 2013. 2. Less tax-exempt bond income Municipal bond yields hit a 60-year low in early 2013. Investors, especially retirees, who rely on their portfolio for living expenses had to find other income sources—taxable income sources—to fund spending. The good news is that the robust stock market gave retirees the option of either selling stocks at a gain or taking larger distributions from retirement accounts. The bad news is that these folks have to pay more taxes if they withdrew this money for spending. 3. The bull market ate your tax loss carry forwards Every cloud has a silver lining. The deep losses that many investors incurred in 2008 and early 2009 meant that investors could carry forward their losses to offset subsequent gains. But after a phenomenal bull run in the equity market from 2009 to 2013, many investors found in 2013 that they no longer had any old losses left to offset their gains. Look on the bright side. While higher tax rates are the new reality, you’re highly unlikely to have another tax surprise next April. With Congressional elections scheduled for November, Washington is very reluctant to make major changes to the personal income tax in 2014. That’s all the more reason to reduce your tax bill systematically by using tax strategies that either defer taxes or avoid taxes altogether. If you manage your portfolio with after-tax return as a goal, you may be able to generate tax-efficient income, avoid short-term gains (which are subject to higher tax rates) and harvest losses that allow you to defer capital gains, where possible. Importantly, this approach focuses on your overall outcome after tax: you don’t want the tax tail to wag the investment dog. Often, investors scramble in early April to find a way to cut their tax bill. They are generally more successful at reducing taxes when they implement a tax-aware investment strategy the year before. The time to start managing your 2014 taxes is now. |
Energies on the move
By Phil Flynn
| Oil (NYMEX:CLK14) prices that were falling on a weak stock market and the potential for a return of Libyan oil now will find support from the increased tensions. The gold market that does not have to balance the threat against the impact on the economy and oversupply like is reacting more dramatically to the news. Oil also will focus on inventories. Gas (NYMEX:HPK14) inventories will continue to dutifully fall as refiners gear up to sell us those summer blends of gasoline. We are looking at oil supply to fall as the Houston shipping Channel will still take its toll on Imports. Next week we should see a big rebound on Gasoline should fall by 1.5 million barrels and distillates down 500K! Refining runs should be steady. Midwest diesel prices have been rising so the market will not like the fact that supply may fall again. Ethanol prices higher again and the focus will be on supply that rose last week. A new survey by AAA says that Americans have grown significantly less likely to change their driving habits or lifestyle to offset gasoline prices. AAA says that only half of adults in the United States, 53%, are doing something to offset gas prices, which is about 15% less than in spring 2013. The survey also shows that 40% believe gas is too high when prices reached $3.00 gallon; 50% believe gas is too high when the price reaches $3.30 gallon; 65% believe gas is too high when the price reaches $3.50 gallon; and 91% believe gas is too high when the price reaches $4.00 gallon. Natural gas is rising. Is it the weather or are people waking up to the fact that we may have a big problem when it comes to filling storage. Most producers say they are cutting back on production so something has to happen on the price side to change their minds. We may be getting ready to pop! |
Deep into corn
By Sholom Sanik
| March 31 USDA reports were bullish for both the supply and demand side of corn. The quarterly stocks report has been notoriously volatile. Traders expected the USDA to “correct” its previous estimate. The January 10 quarterly stocks report estimated stocks on December 1 at 10.426 billion bushels (264 million tonnes), 363 million bushels (9.2 million tonnes) below the average of analysts’ guesstimates. Instead, the new data again surprised the market. March 1 stocks were estimated at 7.005 billion bushels (179 million tonnes), 93 million bushels (2.36 million tonnes) under the average guesstimate. As indicated quite clearly in the chart below, the bottom of the market coincided with the release of the January 10 stocks report. The new data have extended the recent rally to seven-month highs. Estimates for ethanol usage have remained steady at 5 billion bushels. For now, this lays to rest fears that demand for the bio-fuel would taper off without generous government subsidies. With robust feed and ethanol consumption, US domestic demand is solid. Rounding out the bullish demand side is the continuation of strong US exports. Export commitments stand at 41.3 million tonnes, above the USDA estimate for annual sales which is 40.64 million tonnes. And there are five months remaining in the marketing year. At 22 million tonnes, shipments are about average for this time of year. The Chinese government has not yet clarified its position on allowing imports of GMO corn. As we’ve pointed out in the past, however, it is not as large an issue as its made out to be in the news. The USDA estimates total Chinese imports from all sources at 5 million tonnes, a bit under 5% of total world trade. The US has already shipped 2.6 million tonnes, with 1.16 million tonnes of outstanding sales. The March 31 USDA planting intentions report also surprised to the bull side. U.S. farmers are forecast to plant 91.691 million acres, down sharply from last year’ s 95.365 million acres. It was well known that soybeans stood to capture significant acreage from corn (soybean area is estimated at 81.5 million acres, up from 76.5 million in 2013-14), but the average analyst guesstimate of 92.748 million acres was way off the mark. The harsh winter weather we had this year should support prices as well because soil temperature is below what is considered normal for planting. Together with rainy weather, planting delays are expected. While this opens an additional vulnerability, it is still very early to worry about late planting. Last year the crop was very late, but excellent growing weather in the latter stages of the summer growing season led to a record crop regardless. It is widely expected that the Ukrainian crop will be smaller for 2014-15 because farmers will have difficulty obtaining financing for seed and fertilizer due to the financial crisis. South American crops are now being harvested. Estimates have been volatile, but there shouldn’t be any great surprises. Despite the record crop harvested in the US last fall, 2013-14 ending stocks will be 20% to 25% below initial estimates because demand has been so strong – particularly exports. Even though global output of 967 million tonnes was a record by far, inventory levels were not rebuilt to comfortable levels because demand for US corn – as illustrated – was much higher than expected. The prospects of a smaller US crop for next fall has traders worried that inventories could once again fall to dangerously low levels. Remain long December corn as per our January 14 recommendation. Raise stops to $4.50 per bushel, close only.
|

Markets Will Always Crash
by sprout money
|
On the US stock market there is a lot of talk about bubbles; bubbles that have grown so much that they inevitably burst. According to Fool.com, however, there is a solid reason why markets will always crash, usually in a timely manner as well. Generally, one should expect a correction of 10 percent at least once a year, as well as a correction of 20 percent every two years and a 30 percent correction once or twice every decade. In a lifetime you should expect a 50 percent crash at least once, as crashes are more the rule than the exception. Those who do not wrap their heads around that fact will definitely feel the consequences in their portfolio, says Fool.com. It begs the question, of course, whether all of this is necessary? Can the markets not just increase by 8 percent every year without all the fuzz? The Philosophy Of A CrashEconomist Hyman Minsky devoted his entire career to studying the phenomenon of markets continuously overstepping their boundaries to the upside and the downside. One of his bolder claims is the idea that the concept of stability as we once knew it, is now gone. The idea of Minsky is very simple: stability gives investors a feeling of security, which stimulates them to invest more and take more risks. These risks and positions become bigger and bigger, resulting in bubbles sooner rather than later. On the other hand it is important to realize that there is no other way for markets to function. If a yearly increase of 8 percent is certain, investors will have to pay more for the investment as they are sure of their returns. At a certain point, these investments will get so expensive that return will be a lot less than 8 percent and, if you look at it like that, crashes seem like the most logical thing on the planet. Do Not Make Mistakes On The Stock Market, Download The Stock Market Bible! |

Banks about to “pull up” the broad market?
by Chris Kimble
|
CLICK ON CHART TO ENLARGE If you own Bio Tech or Social Media stocks of late, its been a bumpy ride. However, if you own the banks they have held up well compared to some hard hit sectors. The above charts reflect that the Bank Index and Regional Bank ETF (KRE) have had quality rallies over the past couple of years. These rallies have pushed both of these to Fibonacci resistance levels tied to the Financial crisis in 2009. The Bank index stands at the 50% Fib level with momentum at lofty levels. So goes the banks, so goes the broad market? Often time this is very true. If Banks would break out here, it could help pull the broad markets higher. These leaders find themselves at important levels with momentum over bought. |

What Is A Fair Price for Oil?
| With the flattish nature of its action over the past several months, oil seems to have reached a tipping point on price. It’s almost as if the charts are saying that oil either must break up or break down, if long-term trendlines are going to be respected. Barrons took the opportunity to plump for a downside break last weekend, a prediction I have vigorously argued against in both print media and on-air. But one follower of mine made a very astute observation, pointing out to me that futures markets for crude oil ten years out are ‘predicting’ oil prices almost $20 lower. The disconnect between forwards trading as ‘predictors’ of future price is a subject I spent a long time explaining in my book, “Oil’s Endless Bid”, but worthy of explaining again – And even pointing out one of the great (at least theoretical) investment opportunities which anyone in the world could make. |  |
| A very brief overview of the history of financial oil is necessary here. Think back into the days before 1983 when there were no financial instruments on oil. Prices were arrived at using physical trade alone – you delivered crude and cash would change hands. The price that was agreed upon was arrived at by only two kinds of players – those that produced oil and those that used it. It is imperative to remember that financial buyers of crude are almost exclusively front month buyers – the shape of the curve of futures prices therefore literally tracks what the financial players are doing. |
India Silver Import
by Koos Jansen
January India Silver Import 462 MTThe DGCIS, India’s customs department, just released the trade numbers for January 2014. Strangely For gold and silver they only disclose the import numbers. To figure out net import I’m aware of only one other source; COMTRADE, but they haven’t caught up until January. For gold we know the Indian government implemented the 80/20 rule in August 2013, meaning gold traders have to export 20 % of their imported gold. By knowing how much gold was officially imported we can thus calculate how much was officially exported. India officially net imported 28 metric tonnes in January 2014, up 12 % m/m, down 77 % y/y.
However, the official numbers on gold import have very little correlation to Indian demand as the majority of gold is smuggled into the country. The main reason for this is India’s import duty on gold that was raised in January 2013 from 4% to 6 %, in June to 8 % and in August to 10 %. Resulting in high premiums and increased smuggling. This chart is from Nick Laird, sharelynx.com:
In this video by Sunny Pannu from Minaurum gold, Indian gold expert Jayant Bhandari explains the current situation in the Indian gold market. Another result from the restrictions in gold trade is that many Indians flocked to silver. 2013 Indian net silver import broke all records at 6016 metric tonnes. The Indian gross monthly import average in 2013 was 512 metric tonnes. In January 2014 gross silver import was 461 metric tonnes, down 44 % m/m, up 51 % y/y.
In Precious Metals We trust |


Central banks are incubating a crisis the IMF is disinclined to see
IMF chief Christine Lagarde has urged central banks to launch more QE, which has only succeeded in putting a rocket under asset prices
Christine Lagarde has implied that the world, and particularly Europe, needs a bit more inflation Photo: AP According to the old saw, forecasting is difficult, especially when it’s about the future. It’s a truism that the International Monetary Fund – focused, perhaps inevitably, on the rearview mirror rather than the road ahead - has been repeatedly forced to take to heart. Famously, it failed to see the financial crisis coming, despite a chief economist at the time, Raghuram Rajan, who came as close as any to identifying the risks of excessive credit expansion. Later, it blamed its blind spot on “group think”. A similar problem seems to have coloured the IMF’s view on Britain’s fiscal consolidation, which as little as a year ago the current IMF chief economist, Olivier Blanchard, characterised as “playing with fire”. This spectacularly ill-timed judgment, just as the UK economy was beginning to turn, again reflected a kind of “group think”, certainly among many academic economists, where received wisdom was that growth and austerity were incompatible, if not among less theoretically-minded applied economists. At the time, UK Treasury officials attributed the way the IMF singled out the UK for criticism as an indirect warning to the US, where a fierce fiscal squeeze was also being applied. If so, it was an odd way of going about it. Nor did it work. Not only did the US squeeze proceed as demanded by Congress, but it didn’t obviously have a great deal of impact on growth. Both the US and Britain grew relatively strongly last year and are expected to grow by even more this year.
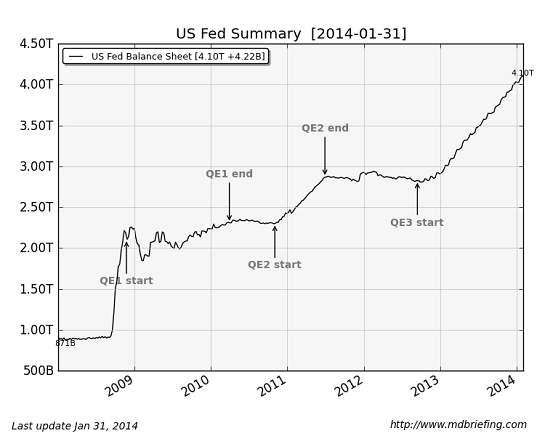
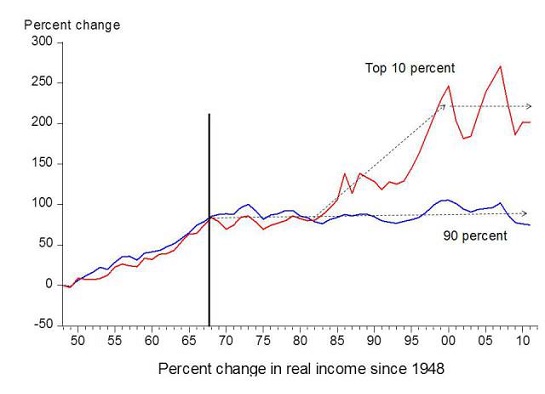
George Osborne, the Chancellor, is entitled to take some satisfaction in the IMF’s discomfort, though he promises not to rub it in when he gives a speech on Britain’s apparent “economic miracle” at the IMF’s spring meeting in Washington this week. All this raises an obvious question; having been far too upbeat about prospects for the world economy ahead of the crisis, then too sanguine about its impact, and then, realising its mistake, far too downbeat, is the IMF again missing the big picture? With past errors ringing in its ears, the IMF tends these days to hedge its forecasts with lots of caveats. The list of potential “risk factors” that could derail the IMF’s central forecasts grows with the publication of each passing World Economic Outlook. The biggest cause of concern this time around, according to the IMF, is again that of persistently low European growth. In a speech last week, Christine Lagarde, managing director of the IMF, said she wasn’t referring to the threat of outright “deflation” when she cited these concerns. This was a word previously used only “to catch everyone’s attention”. Actually, the more potent threat was simply that of a prolonged period of “low inflation” and therefore low growth. More monetary easing, including unconventional measures, were needed, she insisted, to the obvious irritation of the European Central Bank’s Mario Draghi, who pointed out that she would never dare offer policy advice to the US Federal Reserve. Ms Lagarde’s clear implication, also apparent in pre-released papers from the IMF’s World Economic Outlook, due to be published on Tuesday, is that the world, and particularly Europe, needs a bit more inflation. I don’t necessarily disagree with this, but I would be very wary about doing it in the manner Ms Lagarde suggests – through further central bank money printing. The big fear about quantitative easing when the US and Britain first started doing it was that it would be inflationary. Images of Weimar Germany’s hyperinflation were quickly brought to mind. Yet so far it has proved nothing of the sort. One thing it has done, however, is put a rocket under asset prices. Rising asset prices are only the flip side of the same coin as falling yields, and they are phenomena that long precede the financial crisis. Basically, it’s been going on ever since the late 1970s. Both inflation and long-term interest rates have fallen dramatically since then, driving a spectacular long-term bull market in asset prices.
There is a huge and very varied volume of academic research on the causes of this phenomenon, which I don’t intend to rehearse here. Suffice it to say that the effect of QE has been to prevent the sort of adjustment that would normally take place after such a prolonged period of asset price growth. The concern about QE has therefore shifted from initial fears of an inflationary meltdown, which proved groundless, to that of its long-term consequences for financial stability and wealth distribution. The rich have got richer, but it is not apparent that QE has done much for ordinary wage inflation or productivity-enhancing investment. Those with assets have generally done well out of QE, those with cash have been very badly hurt by it. Renewed search for yield has also generated scope for further financial crises. We already see this in the panicked reaction of some emerging markets to Federal Reserve tapering. The greatest risk to the world economy, therefore, is not so much Europe’s failure to grow as that the world economy is simply returning to the way it was, with few, if any, of its underlying imbalances adequately addressed. It is as if we have failed to learn the mistakes of the pre-crisis world, and are therefore damned to repeat them. This is at its most obvious in Britain itself, where the economy is beginning to look indistinguishable from the pre-crisis model invented by Gordon Brown – highly reliant on debt, household consumption and rising house prices. The IMF’s immediate concern is simply to get robust growth going again, in Europe and elsewhere, so that decent inroads can be made into unemployment. Britain has proved that unconventional monetary policy can be helpful in this process. Ultimately, however, the printing press can be no more than a sticking plaster solution, and if underlying structural deficiencies aren’t addressed, then it may end up producing an even bigger muddle. The IMF is unlikely to have made one of its big misjudgments this time around. The world economy has stabilised since its near-death experience in the financial crisis, and it is hard to disagree with Ms Largarde’s central prognosis of continued, but weak, recovery. It seems unlikely we are about to plunge into renewed crisis. But nor have the “fault lines” at the heart of the world economy, brilliantly articulated by Raghuram Rajan in his book of the same name, been anywhere near corrected. Further crises are inevitable; we cannot know when, but one thing we can be sure of is that the IMF won’t see them coming when they do. |


Gold premiums tumble in India
By Paul Ploumis
|
The decision by the Reserve Bank of India (RBI) to grant gold import license to five private sector banks saw gold premiums tumbling by nearly 70% during last week. In a bid to narrow down rising Current Account Deficit (CAD), the country had raised the import duty on gold to 10% during 2013. Further it made mandatory for all exporting houses and agencies to re-export one-fifth of the imported gold as finished products. Despite repeated demands from the industry body, government has not yet lowered the high gold duty structure. However, as the first sign of relaxation of tight gold curbs, the RBI allowed five more banks from private sector to import gold, thereby making more gold available in market. GJF forecasts the monthly gold shipments by the country to double to almost 50 tons in March ’14 from 25 tons during Feb ’14. Consequent to the RBI announcement, the premium on the yellow metal plunged from $85 per ounce to $25-$30 levels per ounce. According to Bachhraj Bamalwa, Director, All India Gems and Jewellery Trade Federation (GJF), the premiums are likely to fall back to normal levels of $1-$2 per troy ounce over the London prices in the event of further gold import relaxations. The world’s largest elections have begun in India. Industry sources believe that the new government which comes to power post general elections will act swiftly to lift the curbs on gold imports. The ruling party in India has already stated that revision of gold import norms will be taken up following the elections. Also, the main opposition party in India has also announced that any action on gold should look at the interests of the public and traders, not just economics and policy. |

Strong EU grain harvest won't rebuild thin stocks
by Agrimoney.com
| Prospects look good for the European Union grains harvest â€" but not good enough to dispel market nerves over supplies, with stocks likely to fall in in 2014-15 after failing to rebuild this season. The EU will produce 296m tonnes of grains this year, down 6m tonnes on the 2013 harvest but still one of the strongest results on record, US Department of Agriculture foreign staff said in their first forecasts for the forthcoming harvest. However, bumper demand for grains â€" both domestically and in the export market for wheat in particular â€" which is allowing only a "limited recovery" in stocks in 2013-14 will continue to undermine an inventory rebuild. "With total domestic consumption forecast little changed in 2014-15, stocks are currently forecast to fall once again, even with a forecast reduction in exports," the USDA staff said in a report. In fact, EU wheat exports "are forecast to remain high, at 25m tonnes" next season, which would be close to record levels were it not for the 28m tonnes expected to be shipped in 2013-14. ‘Market is nervous' The dynamics limit the EU's cushion against supply setbacks, especially if the crisis in neighbouring Ukraine limits shipments from a country which is a main rival in exports, besides being a major shipper to the bloc itself. "Total grain stock levels remain relatively low meaning there is little room in the balance for a supply shock should the current grain harvest forecast not be achieved or the situation in Ukraine impacts on the global trade balance," the report said. "Although grain exports from Ukraine are reported to be unaffected at this time, recent rises in futures prices suggest the market is nervous looking forward." Concerns were particularly acute over wheat, of which the EU is the world's top producer, besides being a major exporter. Although "sentiment is good" towards wheat crop prospects, "with the EU entering a critical yield- and quality-determining weather period, this could change. "Any downward movement in yield expectations or reduction in likely quality will be of interest to the market given the tightness in the EU28 balance this season and the prospect of limited carry in stocks from 2013-14." ‘Severe drought' The report forecast this year's EU wheat harvest at 144.8m tonnes, up 1.5m tonnes year on year, and a figure in line with other estimates. The European Commission has pegged the crop at 144.5m tonnes, including 8.67m tonnes of durum, the type used in making pasta, while Strategie Grains foresees a 145.1m-tonne harvest. The International Grains Council has pencilled in a 143.0m-tonne harvest. The UDSA staff highlighted potential threats to the crop as including dryness in some eastern EU countries, including Hungary, where after a "severe drought" last summer has been followed by "insufficient precipitation" in the autumn and winter too. "Similarly, in contrast to the traditional concerns regarding frost damage, the late-planted winter wheat crop in the Czech Republic has over wintered well but is also reported to be in need of rain." ‘Disease pressure' By contrast, an unusually wet winter in parts of France, the EU's top wheat producing country, and in the third-ranked UK means that "plant root systems are not well developed which may leave them more susceptible to dry conditions in the coming months". "The milder winter temperatures have also encouraged excessive growth, meaning increased likelihood of lodging come harvest, and disease pressure," the report said, echoing concerns raised in the UK by consultancy Adas. "Further, fertilizer and pesticide applications have been delayed, increasing the risk of lower protein content, although the latter part of March has seen drier weather in both countries." |
Fed to the Sharks, Part 1: The Fed Takes Our Money, Gives It to Banks Who Loan It Back to Us at 16%
by Charles Hugh Smith
| We're being Fed to the sharks, every day, one morsel at a time. What a way to go.... |
Subscribe to:
Posts (Atom)