Friday, September 6, 2013

Dow Rises, Obama Backs Down?

By tothetick

Oh the wonders of spin, the joys of doctoring and put it all together mix it around and what pops out of the other end of something is a mastery of wizardly waffle, which to anyone else is called lying. President Obama has acknowledged that he may not be in a position to actually persuade the US that it is necessary to act and react now that the red line has been crossed. Well, apparently the red line doesn’t exist anymore, because he is also denying having said that too.

Obama stated just two days ago that he ‘didn’t set a red line’ concerning the use of chemical weapons in Syria. Apparently, it was all down to Congress and the rest of the world and the drawing of that red line. Admittedly, he went on to refer to the fact that the international community passed a treaty in 1993 stating that they were forbidden even in the event of a war. Isn’t that more spin? How is it possible for politicians to stand up and tell bare faced lies, when they know full well that nobody believes them? Trouble is, they say it so often that they end up believing the spin themselves. You know, that fine line between telling a whopping lie and falling into pathological dysfunctional behavior because you think it really happened.

So, President Obama has backed down on the red line and he is back tracking right now on his ability to persuade the US to attack Syria while at the G20 summit in Russia. Isolated along with France very much so at the summit, Putin is on his own turf and playing in someone else’s back yard is always risky business. The other delegates largely agreed that Syria was not the topic of discussion at the G20, but it has been ever since the summit opened. Britain jumped up and down as David Cameron got a chill go down his spine from the gulags of Siberia as he got icy-cold wind of a (later-denied) rumor that the UK was just a small island that nobody listened to anymore. After having stamped his feet he stubbed his toe on the journalists present and launched into a lengthy appraisal of everything that was Great (about) Britain. But Obama’s backtracking has had a marginal effect on the activity of the Dow Jones Industrial Average.

Even while Obama was speaking the Dow Jones Industrial Average took an upturn in the hope that the backtracking might lead to the US not participating in any form of attack on Syria. Where will that leave France? Out on a limb and in the cold, most certainly.

The Dow Jones is up now by 0.24% (+35.39 points to 14, 972.87).

  • Nearly 80% of Americans want to get Congressional approval of any attack that takes place on the Syrian regime of Bachar-al-Assad.
  • 59% of Americans are against a strike of any kind.
  • Only 36% are in support of it.
  • In December 2012, 63% were in favor of a strike on Syria.

Obama and Putin finally agreed to meet at the end of today’s meeting, which signals another backtrack in the statements of President Obama who said that he would not be meeting with the Russian leader in a tit-for-tat thumbs down to Putin over the Edward Snowden affair. The meeting was concluded by a statement in which there was more newspeak. They both agreed to disagree (that’s wonderful in itself, finding agreement when you can’t get any common ground; rather an antagonistic ability to find good everywhere) adding that the meeting was very ‘constructive’.

We would like to see how it could have been if nothing was decided.

See the original article >>

The Fed Has Wasted Trillions and the US Will Default

by Graham Summers

The facts are now becoming abundantly clear, that the forecast we’ve maintained for well over two years has been validated: the US is in a DE-pression and both Washington and the Federal Reserve have wasted trillions of Dollars.

The reality is that what’s happening in the US today is not a cyclical recession, but a one in 100 year, secular economic shift.

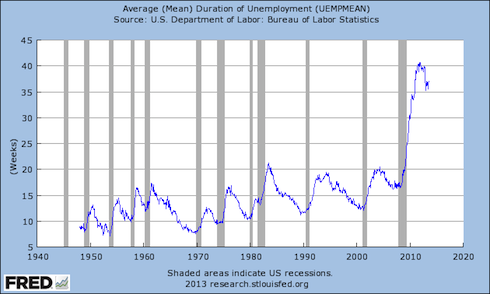
See for yourself. Here’s duration of unemployment. Official recessions are marked with gray columns. Bear in mind that the Feds measure unemployment based on people looking for work, so if you stop looking, you no longer count as unemployed and this number will fall.

Even with this accounting gimmick, the average duration is still at 35 weeks.

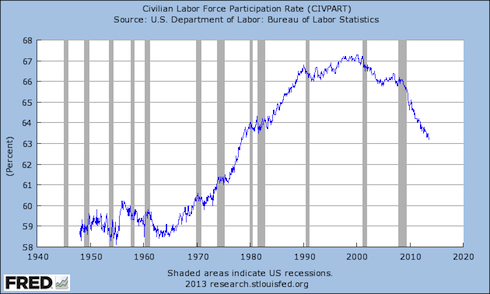
Here’s the labor participation rate with recessions again market by gray columns:

Another way to look at this chart is to say that since the Tech Crash, a smaller and smaller percentage of the US population has been working. Today, the same percentage of the US population are working as in 1978.

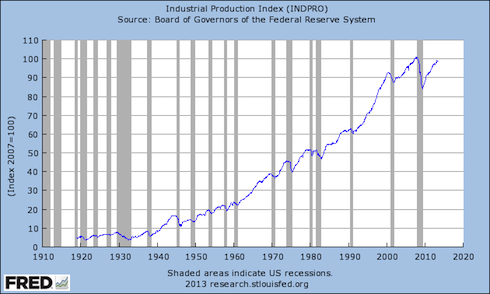
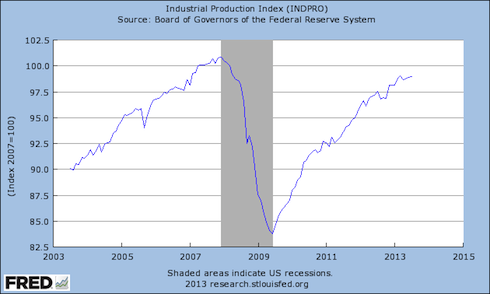
Here’s industrial production. I want to point out that during EVERY recovery since 1919 industrial production has quickly topped its former peak. Not this time. We’ve spent literally trillions of US Dollars on Stimulus and bailouts and production is well below the pre-Crisis highs.

Here’s a close up of the last 10 years.

Again, what’s happening in the US is NOT a garden-variety cyclical recession. It is a STRUCTURAL SECULAR DEPRESSION.

And those who claim we’ve turned a corner are going by “adjusted” AKA “massaged” data. The actual data (which is provided by the Federal Reserve and Federal Government by the way) does not support these claims at all. In fact, if anything they prove we’ve wasted money by not permitted the proper debt restructuring/ cleaning of house needed in the financial system.

Which is why smart investors are already preparing for a market meltdown.

On that note, I’ve already prepared readers of my Private Wealth Advisory newsletter with a number of targeted investment strategies designed to help them not only manage risk, but produce outsized profits during the coming economic slowdown.

See the original article >>

How low can gold go?

By Bernard Dahdah

Of late, the likelihood for a drastic lowering of gold prices (COMEX:GCZ13) has become a common talking-point, with many analysts – ourselves included – believing that a drop to $1,000/oz should not be ruled out in the next year.

Indeed, although the Syria-led rally in oil prices has resulted in a recent upturn in gold prices, the rise is unlikely to be cemented in any longer-term positions. Certainly, a more accurate outlook for gold prices needs to take into account the impacts of developments in three key areas: Investor demand, central bank behavior and trends in the mining industry.

In the past decade (and even more so in the post-crisis environment) these areas have experienced massive shifts, which have largely contributed to the supply and demand disequilibrium that is now of concern. Furthermore, investors still seem wary of gold’s dramatic collapse in the first half of this year. The question has since become, how low should gold be priced in order to bring supply and demand into equilibrium? Let’s try and determine this answer by examining the broader trends currently taking shape.

Investor demand

Whether for bars, coins or exchange-traded products (ETPs), investor demand for gold has historically held steady at around 8%-9% of total demand.

Since the onset of the financial crisis, however – and encouraged by quantitative easing (QE) – investor demand expanded to a high of almost 1,300 tonnes in 2012 (nearly 30% of total demand), helping to propel gold prices to record highs. Undoubtedly, this was an unsustainable rise. And now that U.S. interest rates are rising and the dollar is strengthening – thanks to the Fed’s likely “tapering” of its QE program – investors are relinquishing their holdings of gold.

Indeed, since mid-February, investors have sold 620 tonnes of gold from ETPs. And, just as prices gained momentum on the upside, they are now experiencing momentum on the downside. Selling by investors is helping to push prices lower, further encouraging other investors to capitulate as well. Meanwhile, ETPs, which accounted for 6% of total demand for gold in 2012, have so far this year added net supply equivalent to 14% of last year’s total supply of gold.

When supply and demand of gold is imbalanced, the market can usually rely on natural stabilizers to help the situation, as mentioned earlier. Jewelry demand is one aspect of this mechanism. As prices rise, customers are priced out of the jewelry market – just as when prices fall, consumers can afford to buy more gold.

Global jewelry demand declined significantly between 2008 and 2012, deterred by higher prices. Yet there has been a noticeable increase in jewelry demand in the recent context – seen by the rise in physical premiums for kilo-bars in a range of locations and the backwardation in London prices, which indicates a near-term scarcity of physical metal in the market.

The second key stabilizer is the supply of gold scrap. This is because lower gold prices lead to a sharp drop in global supply of gold scrap. Usually, when the price of gold goes down, we can rely on both of these automatic stabilizers to balance out the equation. But, because of today’s strong outflow from investor demand, it’s tempting to acknowledge that this won’t be enough.

From net demand of around 1,300 tonnes in 2012 (according to GFMS), investment demand has turned into a source of net supply in 2013. If current trends continue, this net supply could reach as much as 400 tonnes or more, with sales from ETPs far outweighing new investment in gold bars. And even if ETP investors stop selling, it will be difficult to see net demand turning positive for the year as a whole.

Central bank behaviour

Certainly, when evaluating the price of gold it is important to keep a close eye on the U.S. and QE. With each announcement from the Fed acting as further confirmation that tapering will begin by the end of this year, interest rates have risen. And higher interest rates means dire news for gold, as it strengthens the dollar and also increases the opportunity-cost of holding gold.

In the decades prior to the financial crisis, central banks acted as a source of supply for gold. Between 1990 and 2009, around 5,600 tonnes of gold were released, mainly by central banks from developed countries. From 2010 onwards, however, the sharply rising price of gold persuaded these central banks to halt further sales of gold.

Since the beginning of the financial crisis, central banks from developing countries have sought to diversify their foreign exchange reserves – making the shift away from the dollar by acquiring increasingly large quantities of gold. Some of these central banks have reached their target holdings over the past 12-18 months, and as a result, are causing a dampening effect on gold prices. This is because they are likely to sell gold at higher prices or buy gold at lower prices – as a means of maintaining a steady proportion of gold within their reserves. International Monetary Fund (IMF) figures show that in the first four months of this year, central banks acquired 160 tonnes of gold. For the year as a whole, we expect net purchases to be at or above 500 tonnes.

Mining industry developments

At current prices, jewelry demand is rising strongly and scrap supply is diminishing. But the enormous decrease in net investment demand needs to be redressed. This is especially the case because solid demand from central banks – which usually plays a key role in driving momentum – is proving insufficient to bring these trends into equilibrium.

What the market needs, therefore, is a fall in mined gold output – meaning that prices should drop to the point at which mining companies close their more marginally profitable operations.

In the gold mining industry, much importance is placed on “all-in” sustaining costs (which among many factors includes costs applicable to sales, exploration expense, advanced projects and R&D). These generally average somewhere between $1,100-1,200/oz – hence our argument that declines in gold prices below those levels will shut in a large portion of global supply. But in the short-run, these are not the right costs to be focusing on.

Instead of long-run average costs – which determine whether mining companies will undertake investment in new ventures – it’s important to consider the marginal costs for each mine, such as cash costs and the net total of by-products. Indeed, it’s these lower marginal costs that will determine whether individual shafts or mines are closed.

Our estimates suggest that – at current prices – the rise in jewelry demand and fall in scrap supply will be able to absorb around 750 tonnes of the decrease in investment in gold. But this leaves an imbalance of as much as 830 tonnes.

To reduce this through lower mine output alone would require prices to fall as low as $800/oz. But of course, if prices were to approach this target we would see an additional rise in jewelry demand and further reductions in scrap supply. Our best guess is that – if selling by investors persists – short-term equilibrium could be reached at the point where gold prices sit somewhere between $1,000/oz and $900/oz.

While we have discounted all-in sustaining costs as an inappropriate measure of the short-term supply curve, over the longer term they are the main determinant of incremental supply. As such, the market will only be able to remain below the industry’s average cost curve so long as demand remains artificially low.

Once investment demand returns to its long-term “normal” of around 8%-9% of the global market, the price level should return to one that compensates mining companies for their continued participation in the gold market.

Not all higher cost mines will reopen, but it would be reasonable to think that prices should stabilize at, or around, the long-run costs of production for the vast majority of the gold industry. This suggests that a reasonable medium-term target for gold prices would be somewhere in the vicinity of $1,150-1,250/oz.

Recognizing this long-run equilibrium, the market may be rational enough to halt its breakneck decline as investors resist selling further volumes of gold below the long-run cost curve. With many investors remaining trapped in a falling market, however, there may be more rounds of ‘blood-letting’ to go before some degree of sanity returns.

See the original article >>

Bill Gross: Economy needs a better seventh inning stretch

By Bill Gross

They say that reality is whatever you wish it to be and I suppose that could be true. Just wish it, as Jiminy Cricket used to say, and it will come true. Reality’s relativity came to mind the other day as I was opening a box of Cracker Jacks for an afternoon snack. That’s right – I said Cracker Jacks! I can’t count the number of people who have told me during the seventh inning stretch at a baseball game to make sure I sing Cracker Jack (without the S) because that’s what the song says. I care not. No one ever says buy me some “potato chip” or some “peanut.” How about a burger and some “french fry?” In all cases, the “s” just makes it flow better. My reality is a box of Cracker Jacks, and I think little sailor Jack on the outside of the box would be nodding his approval if he could ever come to life, which maybe he can if the stars are aligned and reality is whatever we wish it to be.

Having mentioned Jack and the game of baseball, let me give you some opinions that come close to being hard cold facts, not wishes. First of all, baseball is the most boring game in the world next to cricket. I don’t know how to play cricket, which is the only reason I rank it second. CNN Sports did an actual survey of how much time during an average two hour and 39 minute game that baseball players are actually moving – you know, swinging a bat or running to first base. Five minutes and 13 seconds! The rest of the time the boys of summer are actually just standing around, scratching you know where, and spitting tobacco juice onto the nice green grass. Most disgusting, I’d say. And why, I wonder, does a baseball “season” consist of 162 individually boring games? In football you only need 16 or so to declare a champion, in boxing sometimes three minutes or less.

Now for some controversy: Steroids, HGH and juicin’? I say, why not. They can’t be cheating if they’re all cheating together. And as a matter of fact, management and owners “cheat” all the time. If they have a lineup heavy with left-handed hitters, they will shorten the right field fence. The Yankees and now the Dodgers just “buy” championships with money from the game’s most gargantuan TV rights (who’s watching?). That’s playing by the rules? If your counterpoint on drugs is that it’s unnatural and harmful to the body, I wonder what’s so healthy about the way they conduct spring training or do their pregame warm-ups. Two or three half-hearted sprints in the outfield and they’re done. If baseball was concerned about health or addiction, they’d be testing for lip cancer or diabetes. Modern day relief pitchers, who now “exercise” for two innings or less on the mound, have pot bellies that would make a sumo wrestler proud. Why, the Babe was so fat he could hardly waddle back around to home plate 60 times in one season.

Last point, because I know you’re dying to hear my opinion on Pete Rose and the Hall of Fame. I say anyone as ugly as Pete deserves a free pass to Cooperstown or any town for that matter, maybe the same free pass that you’d have to give me to go to a baseball game again. Take me anywhere, but don’t take me out to the ball game and make me stretch during the seventh inning while I’m eating my Cracker Jacks. Reality can smack you in the face sometimes, like it did Pete Rose, but if I’m gonna be smacked it’ll have to be on the gridiron or the hardwood, not Yankee Stadium.

Life’s ballgame ended several decades ago for Hyman Minsky, author of “Stabilizing an Unstable Economy” and proponent of the notion that capitalism is inherently unstable, in part because of the short term financing of long term capital assets such as bonds, buildings, plant and equipment. His stabilizing solution was for Big Bank and Big Government to intercede with monetary and fiscal pump priming, confident in the notion that if the priming was large enough and the pumping fast enough, that stability could at least be temporarily achieved. Yet Minsky played ball in another era, before steroids and corked bats. He legitimately could not foresee the time when what he labeled “Big Bank” and “Big Government” became so large and stimulation so excessive that even temporary stability of a closed or an evolving global economy would be difficult to attain.

Over these five post-Lehman years, financial markets have grown leery of the medicine Dr. Minsky recommended to calm the symptoms, if not the disease, of capitalistic excess. During a crisis, Minsky’s solution was for Big Government to generate substantial fiscal deficits which in turn would stabilize corporate profits, financial asset prices and ultimately the real economy. In turn, and concurrently, he advocated the growth of Big Bank, by which he meant the ability of a central bank to lower interest rates and reserve requirements in order to stimulate private lending via the monetary channel. In combination, and if large enough, the two could stabilize asset prices and eventually produce an “old normal” 3%–4% real growth rate in developed and presumably developing economies too. We have lived in a Minsky-based policy world for some time now, but unfortunately in a “New Normal” world of lower economic growth.

What perhaps Minsky couldn’t conceive of was the point at which debt, deficits and interest rates would go to such extremes that the creation of credit itself, which was and remains the heart of capitalism, would be threatened. No longer might the seventh inning stretch lead to a Coke, some “Cracker Jacks” and the resumption of the old ballgame. Instead, zero-bound interest rates and debt/GDP ratios in a majority of capitalistic economies would begin to threaten, not heal, the nature of finance and investment in the real economy. Investors, leery of not only overleveraged investment banks such as Lehman Brothers, but overextended countries such as Greece, Cyprus and a host of Euroland lookalikes would derisk as opposed to rerisk as per the Minsky model. As well, with interest rates close to the zero bound, investors in intermediate and long term bonds would become dependent on Big Bank to do their bidding. When that QE buying power became jeopardized via tapering and the eventual ninth inning conclusion of asset purchases, then the process of maturity extension and the terming out of historically modeled corporate lending was prematurely threatened.

In short, and in too-abbreviated summation, debt-laden economies with near-zero-bound interest rates became victims of their own excess, a condition that was more difficult to stabilize cyclically because Big Government and Big Bank had reached limits, and private market investors with huge portfolios of their own began to leave the ballpark early. Why stick around if your team is down by seven runs with only a few innings left? Why invest in financial or real assets if bond prices could only go down, and/or stock prices could no longer be pumped up via the artificial steroids of QE?

The rush for the exits seems to have been hastened recently not only by the increasingly obvious limitations of Big Government and Big Bank but by the additional knock-on effects of Big Investor and Big Regulation. The regulatory aspect is not hard to see. Having threatened the global economy with endogenously generated financial leverage, banks are under the government thumb to recapitalize and derisk from a multitude of directions including Basel III, SEC fines and criminal investigations, as well potential transaction taxes in Euroland, to name a few. While this response would have been typical in an historical Minsky model of normal economic recoveries, it is now no doubt excessively so, if only because of the enormity of the Great Recession itself. Whatever the cause, the duration of regulatory restraint, while long term beneficial, has been short to intermediate term negative for “stabilizing an already unstable economy.”

An analysis of “Big Investor” is a little more complicated, if only because there are a multitude of “structural” investors with varied and in many cases dissimilar interests. Our “unstable global economy” for instance has produced a number of developing (China, Brazil, India, South Africa to name a few) and developed economies (Japan to name one) that run substantial trade deficits or surpluses that give rise to the artificial pricing of currencies and/or government debt. As these imbalances raise concerns domestically or amongst international investors, the quickened pace of bond purchases or liquidation creates an unstable as opposed to a stable financial foundation. Minsky, I fear, would be appalled, if only because Big Government and Big Bank cannot now be coordinated in an open global as opposed to a closed domestic economy. “Technical” considerations involving trillions of dollars of financial flows are now dominating fundamentals in many markets.

But Big Investor is now influenced not just by public and sovereign entities but by an enormously expanded private market with liquid alternatives and choices. Call it pension-related or institutional severance monies. Call it retail, call it Mom & Pop with their 401(k)s, but they all have a host of choices at today’s ballpark snack bar. Bonds, stocks, cash – emerging/developed – euros, dollars, pesos. Sounds like a good game to play, does it not? The problem is that as Big Government, Big Bank and Big Regulation begin to tighten their purse strings and the risk budgets of their constituent vassals, then the liquidity to choose amongst a varied menu of assets becomes more limited. At the extreme, Mom & Pop have only themselves to buy from or sell to. When policymakers say so long to QE, and investment banks are no longer able to inventory large blocks of stocks and bonds, then historical liquidity is challenged. ETFs and mutual funds, once energized by excessively generous fiscal and monetary policies, have only themselves to sell to. At the extreme, the new game is now played in a Pogo ballpark, with the enemy, the opponent, the buyer of last resort being “us” as opposed to “them.” Minsky’s hoped-for stability, if only temporary, falls short because Big Government and Big Bank are now much smaller than historical proportions in an economy dominated by private funds or individual country flows.

So what to do here, folks? For those of you who are still fans of the old American pastime – in this case capitalism and the making of money as opposed to baseball – how do you play on this rather unstable field of our own making? Which pitch do you swing at? Well, commonsensically, in an unstable global economy that is increasingly difficult to stabilize, an investor should seek out the most stable of assets. At the extreme, that would be cash in the world’s most stable currency. But whether dollars, euros, or pounds be your first choice (ours being dollars), cash or overnight deposits in any of them yield next to nothing. So say you want something but don’t want to lose your money either; a modern day Will Rogers. More concerned about the return of your money than on your money but still a little greedy (or perhaps just needy) too. Well, some say stocks – the only game in town. But I don’t know. When the Fed stops the QE game, it seems that stocks might be at risk. After all, haven’t they more than doubled in price since 2009 in part because of it? Without Big Government deficits and Big Bank check writing and with the advancing risks posed by Big Regulation and the technical whimsy of Big Investor, the safest pitch to swing at may not be stocks but the asset that will soon be the nearly sole focus of central banks. Instead of QE, central bankers are shifting to “forward guidance” which, if reliable, allows financial markets and real economies to plan several years forward in terms of financing rates and investment returns. If unemployment and inflation rates can be at least closely guesstimated, then front-end yields become the most reliable bet in the ballpark, Pete Rose notwithstanding. While low, they can at least form the basis for curve rolldown and volatility strategies that have higher return/risk ratios than alternative carry options such as duration, credit or currency. With Big Investor unsure or perhaps unable to catch stock, long bond or currency fly balls in today’s afternoon sun, it’s perhaps best to field boring slow-rolling grounders based on policy rate stability for “an extended period of time.” Recall as well that the result of Minsky’s “Big Government” and “Big Bank” policies has always been accelerating inflation at some future time. We recommend longer-dated TIPS as insurance against just such an outcome.

Baseball’s old saw pleads to “buy me some peanuts and Cracker Jack, I don’t care if I never get back.” Jack or Jacks aside, getting back to the old normal Minsky world of stabilization via Big Government and Big Bank is now being challenged, as are the investment choices and future returns dependent on them. Grab for the prize at Jack’s bottom if you will, but the safer and perhaps most rewarding treat lies at the top with those front-end yields and inflation-protected securities based on our evolving age of central bank “forward guidance.” I have a hunch that even Pete Rose would bet on this one.

Seventh Inning Speed Read

1) Hyman Minsky’s hoped-for “Stability in an Unstable Economy” must be updated for the exhaustion of Big Government and Big Bank

2) Private market technicals can temporarily overwhelm fundamental considerations

3) Bond investors should focus on “safer” front-end positions in Treasuries or credit space because of the Fed’s shift to forward guidance

4) Don’t bet on baseball games. Bookies take too much, plus it’s boring!

See the original article >>

Joe Friday…Bonds have rallied when this took place!

by Chris Kimble

CLICK ON CHART TO ENLARGE

Dual multi-year channel resistance comes into play in the 10-year rate at (1) in the chart above.  The rally in yields has been brutal to the price of bonds, since last summer, as the yield on the 10-year notes is up 100%!

Joe Friday... Bonds the majority of the time have rallied in price/yields have declined when at the top of this channel and few investors were bullish bonds.

See the original article >>

Analyzing Earnings As Of Q2 2013

by Lance Roberts

With 99% of the S&P 500 earnings reported (as of Aug.30, 2013) we can now take a closer look at the results for the first half of the year.  Operating earnings rose from $25.77 per share to $26.36.  While operating earnings are widely discussed by the media there are many problems with the way in which these earnings are derived.  Therefore, from a historical valuation perspective, reported earnings are much more relevant in determining market over/under valuation levels.   In this regard reported earnings increased from $24.22 to $24.95 per share in the second quarter.  Trailing twelve month earnings per share rose from $98.35 to $99.28 for operating earnings and from $87.70 to $91.03 for reported earnings.  However, while the headline reports were certainly encouraging - digging into the details revealed a bit more troubling picture.

Always Optimistic

There is one commodity that Wall Street always has in abundance and that is "optimism."  When it comes to expectations for corporate earnings the estimates are always higher regardless of the trends of economic data.  The problem is that the difference between expectations and reality have been quite dramatic.  In a recent missive entitled the "4 Tools Of Corporate Profitability" I stated:

"There is no doubt that corporate profitability has surged from the recessionary lows.  However, if I am correct in my assessment, then the recent downturn in corporate profitability may be more than just due to an economic "soft patch."  The problem with cost cutting, wage suppression, labor hoarding and stock buybacks, along with a myriad of accounting gimmicks, is that there is a finite limit to their effectiveness.  While Goldman Sachs expects profits to surge in the coming years ahead - history suggests something different."

S&P-500-Earnings-052813-3

The chart below shows the consistently sliding revisions as of late in corporate profitability. At the beginning of 2012 it was estimated that by Q4 of 2013 reported earnings would be $106.16.  In March of 2013 the Q4 estimate had been dropped to $99.75 even as stock prices were boosted by continued injections from the Federal Reserve.  Currently, as the end of the year rapidly approaches, estimates have been knocked down to just $97.30 as slower economic growth has weighed on profitability.

S&P-500-Earnings-revisions-090613

This is the primary problem of using "forward" estimates as a valuation tool.  The always overly optimistic assumptions leads to faulty analysis as sliding earnings leads to sharp valuation increases. The chart below shows the progression of forward P/E estimates since the beginning of 2012.  Currently, with the S&P 500 valued at 19x reported earnings it is hard to justify that the market is undervalued. 

S&P-500-ForwardPE-090513

Accounting Magic

What has also been stunning is the surge in corporate profitability despite a lack of revenue growth.  Since 2009 the reported earnings per share of corporations, the bottom line of the income statement, have increased by a total of 222% which is the sharpest, post-recession, increase in reported EPS in history.  However, at the same time, reported sales per share, which is what happens at the top line of the income statement, has only increased by a marginal 22% during the same period.  This is shown in the chart below.

S&P-500-AccountingMagic-080513

In order for profitability to surge, despite rather weak revenue growth, corporations have resorted to four primary weapons:  wage reduction, productivity increases, labor suppression and stock buybacks.  The problem is that each of these tools create a mirage of corporate profitability.  The problem, however, is that each of these not only have a negative economic consequence but also suffer from diminishing rates of return over time.

One of the primary tools used by businesses to increase profitability has been through the heavy use of stock buy backs.  The chart below shows outstanding shares as compared to the difference between operating earnings on a per/share basis before and after buy backs.

S&P-500-Buybacks-090513

The problem with this, of course, is that stock buy backs create an illusion of profitability.   If a company earns $0.90 per share and has one million shares outstanding - reducing those shares to 900,000 will increase earnings per share to $1.00.   No additional revenue was created, no more product was sold, it is simply accounting magic.  Such activities do not spur economic growth or generate real wealth for shareholders.  However, it does provide the basis for with which to keep Wall Street satisfied and stock option compensated executives happy.

As I discussed at length in my recent report on "Evaluating 3 Bullish Arguments:"

"There is virtually no 'bullish' argument that will currently withstand real scrutiny.  Yield analysis is flawed because of the artificial interest rate suppression.  It is the same for equity risk premium analysis.  Valuations are not cheap and rising interest rates will slow economic growth.  However, because optimistic analysis supports our underlying psychological 'greed', all real scrutiny to the contrary tends to be dismissed.  Unfortunately, it is this 'willful blindness' that eventually leads to a dislocation in the markets."

The ongoing deterioration in earnings is something worth watching closely.  The recent improvement in the economic reports is likely more ephemeral due to a very sluggish start of the year that has led to a "restocking" cycle.  The sustainability of the uptick is crucially important if the economy is indeed truly turning a corner toward stronger economic growth.  However, with interest rates rising, oil prices surging and the Affordable Care Act about to levy higher taxes on individuals, it is likely that a continuation of a "struggle" through economy is the most likely outcome.  This puts overly optimistic earnings estimates in jeopardy of be lowered further in the coming months ahead as stock buybacks slow and corporate cost cutting continues to become less effective.

See the original article >>

Fed’s Evans wants to see inflation quicken before QE taper

By Steve Matthews

Federal Reserve Bank of Chicago President Charles Evans, who has consistently supported record stimulus, said the Fed shouldn’t taper its $85 billion in monthly bond buying until inflation and economic growth pick up.

“To start the wind-down, it will be best to have confidence that the incoming data show that economic growth gained traction during the third quarter of this year and that the transitory factors that we think have held down inflation really do turn out to be transitory,” Evans said today in a speech in Greenville, South Carolina. He is a voter on policy this year.

The Federal Open Market Committee at a Sept. 17-18 meeting will probably consider whether to begin scaling back a bond purchase program that it has pledged to continue until the job market shows signs of substantial improvement.

The FOMC said in a July 31 statement that inflation persistently below its 2% goal poses a risk to the economy. The Fed’s preferred measure of inflation, the personal consumption expenditures index, showed prices rising 1.4% in the 12 months ended in July.

The economic outlook will probably allow the Fed to reduce asset purchases “later this year and subsequently wind down these purchases over a couple of stages,” with a halt to the program around mid-2014, Evans said.

Job Figures

The job market has “definitely improved” from the start of the current round of bond buying, when data showed the unemployment rate was 8.1% and monthly payroll growth was averaging about 135,000, he said.

U.S. employers added 169,000 jobs last month, less than economists forecast, and the jobless rate fell to 7.3% from 7.4%, a government report showed today in Washington. The report also showed the lowest participation rate since 1978.

“The U.S. economy has a long way to go to return to healthy normalcy,” Evans said before the report was released. “An unusually high number of productive, potential workers are not even looking for jobs right now.”

The Fed should press on with bond buying until unemployment declines to about 7%, with forecasts of a continuing decline; other labor market indicators show similar improvement; and data elicit “considerable confidence” that inflation is moving back toward 2%, Evans said.

Policy Outlook

Policy will remain accommodative even after the Fed ends quantitative easing, and short-term interest rates could remain near zero after the unemployment rate falls to the FOMC’s policy threshold, Evans said. The committee, drawing on an Evans proposal, has pledged to keep the federal funds rate near zero at least as long as unemployment exceeds 6.5% and the outlook for inflation is no more than 2.5%.

“I can easily envision certain circumstances in which the unemployment rate could go below 6% before we moved the funds rate up,” he said.

The FOMC will probably vote at its meeting this month to taper its unprecedented stimulus program, according to 65% of economists surveyed by Bloomberg Aug. 9-13. The first step may be to taper monthly purchases by $10 billion to a $75 billion pace, according to the median estimate in the survey of 48 economists. They said buying will probably end by mid-2014.

Reports since the July 30-31 meeting, in which the FOMC said downside risks to the economy had diminished, suggest the U.S. economy has continued to make gains. Manufacturing expanded in August at the fastest pace in more than two years, the Institute for Supply Management’s factory index showed this week.

Evans, 55, became president of the Chicago Fed in 2007 after serving as the bank’s director of research. The district bank chief was also an early backer of the current round of bond purchases, and he dissented twice in 2011 in favor of easier policy.

See the original article >>

China Enters Top 10 Currencies

By tothetick

The number 10. From time immemorial it has been a fascination for people around the world, in every culture and in every civilization. 10 is the Pythagorean symbol of perfection and completeness and the basis of the decimal system that we use today and being in the top 10 means something for both the people that are there and also for those that are trying to clamber up the rankings. Today, China has entered the top 10 in something else and dethroned another country. The Chinese Yuan is now one of the 10 most-traded currencies in the world and has attained perhaps perfection and completeness. Or, at least it might be getting there soon to the dismay of many.

Today China ranks 9th place in the currencies that are the most traded in the world. That might not seem great and far off the top position. But, it entered the top 10, jumping in one foul swoop from 17th place to 9th in just the space of 3 years when the last survey was carried out by the Bank of International Settlements (BIS).

But, the Chinese currency is far from becoming the world’s leading currency yet it would seem. According to results of research carried out by HSBC in a survey of more than 700 worldwide businesses, there are relatively few trade settlements that are being made as of yet in the Yuan. One main reason for that is that the Yuan is still not a fully-convertible currency, although the Chinese State Council has already made many statements about the fact that it should be entirely convertible by 2015 and therefore will become internationalized then. The Chinese government has made convertibility of the highest importance. It was back in 2007 that the Chinese first announced that they wished to liberalize the flow of capital and allow for convertibility to freely take place, enabling the buying of assets or taking equity around the world. The fact that the Yuan has entered the top 10 world currencies means that the Chinese currency is one step closer to allowing convertibility to take place entirely. Afterwards, the challenge will be on for the top position between the Yuan and the Dollar.

  • In an HSBC survey only 52% of companies stated that they had an understanding of what liberalization of the Yuan would actually mean for them and about 30% stated that they were still unwilling to use the Yuan in transactions and foreign-trade settlements.
  • But that also means that 70% are in favor of using the Yuan as the trade -settlement currency.
  • Chinese businessmen are starting to see ways of changing the opinions of businessmen from overseas.
  • Many of them offer discounts on purchases by foreign firms if they agree to settle in Chinese Yuan.
  • Those discounts are said to reach somewhere in the region of an average of 5%.
  • A little bit of patriotism and national protection or privilege can go a long way when it’s got a population of 1.344 billion people ready to back it up.
  • Failing to trade in the Chinese Yuan will mean losing out for foreign businesses.
  • Losing out will mean losing the competitive edge.
  • There are no two ways about it: businesses will agree to trade in the Chinese Yuan in the coming years in order to remain competitive.
  • Once a few have started (and they already have), the others will have to follow.
  • 25% of those firms that were surveyed stated that they would be using the Chinese currency within the next 5 years.
  • 42% of them stated that the main reason would be to get a better deal in terms of pricing from their Chinese counterparts.

China is already the second largest economy in the world and in just a few years it will dethrone the USA from the top position. Even as the second-largest currency there’s no way China can afford to allow the Yuan to sit out the economic dance and just watch the waltzing Dollar. Although HSBC states that 2015 will be too early for the Yuan to be fully convertible and this will more than likely occur in about 2017 now, due to the slowdown in the Chinese economy. If the Yuan can’t reasonably sit there as an on-looker as the second-largest economy the only way to get to the top position is to convince businesses and governments around the world that the Yuan is a viable option and will reduce trade costs.

Renminbi: Top 10 Traded Currencies

Renminbi: Top 10 Traded Currencies

But, all the legal bribing into using the Yuan as a trade currency between foreign firms and Chinese companies will do little good as long as the Chinese government is still dragging its feet on the overhauling of its financial system. While reforms are slow, the Yuan will be held back. While the shadow-banking system is not dealt with entirely, businesses will remain wary.

Yesterday, the People’s Bank of China stated that they were considering attempting to increase the loosening of investment flows of capital into and out of mainland China. That too is one step closer to getting to full convertibility. Deals have already been agreed in terms of currency swaps with countries such as Pakistan, Thailand or South Korea, for example. The Australian government also agreed this year to directly exchange their currency with the Chinese, thus cutting out the need to first convert in US Dollars and then into Chinese Yuan. If the top 10 currencies are starting to do that, then it looks as if they will be giving the Chinese a helping hand into turning the Yuan into a fully convertible currency sooner than might be expected.

As for the rest of the top 10 positions, the Mexican Peso is in 8th position just above the Chinese Yuan. The Swedish Krona and the Hong Kong Dollar were ousted from their positions by the Yuan and the Mexican currency. The greenback was of course in number one position and the Euro came in 2nd with the Japanese Yen in 3rd. The GB Pound was 4th.

  • The foreign- exchange market is growing also. It increased from a daily turnover that averaged out at $5.3 trillion.
  • That was up from the $4-trillion figure in 201, by a rise of 35%.  The Yuan’s trades are today worth $120 billion per day on average.
  • In April 2010 this year that figure was only $34 billion and so there has been an increase of 3.5 times.
  • The US Dollar has roughly 85% of the daily share of most-traded currencies in the world today still.
  • Most currencies are traded in London (41% of the daily average) and the US share stands at 18.9%.

Moving up from 17th position is a huge leap for the Yuan. It’s certainly going to be a tough game to topple the US Dollar’s gigantic share of the market. But, businesses will move where the money takes them and where the Chinese can offer a discount for trading in their currency. Patriotism goes out the window and down the tubes when it comes to making money.

People have no qualms and even fewer scruples when it boils down to make a quick buck. We’ll have to change that too into ‘making a quick Yuan’. Not quite the same Renminbi about it, is there? 

See the original article >>

Yet Another "Most Important Jobs Number Ever" On Deck

by Tyler Durden

The highlight of today's economic releases will be the 8:30 am non-farm payroll data, expected to print at 180K jobs, up from July's 162K, and result in an unchanged 7.4% unemployment rate. The "most important jobs number ever " is neither, because even if it comes as a wild outlier to the good or bad side, the Fed is unlikely to change its tapering intentions this late in the game. Still, it will provide fireworks in a very jittery market and if the number is far stronger than expected, expect the 10 Year to finally blow out from below the 3% range which it breached briefly overnight, and never look back, at least not until there is an August 2011 wholesale risk revulsion episode and stocks tumble. Speaking of jittery, overnight the WSJ reports that if picked as Bernanke's replscament, Larry Summers' faces an uphill battle to get the votes of three key democrats on the Senate Banking Committee (Jeff Merkley, Sherrod Brown and Elizabeth Warren). It would be only fitting that the dysfunctional Democratic dominated senate now lashes out against the president, and in the process scuttles the market's only hope of maintaining its Fed-derived gains over the past five years.

In other news, we got more disappointing data out of Germany where Industrial Production slid -1.7%, from +2.0%, missing expectations of -0.5%. In the aftermath of yesterday's non-event ECB press conference, both JPM and Goldman now expect that the ECB will announce a new fixed-interest LTRO will be announced before the end of the year to normalize liquidity concerns (earlier today banks repaid another €5.91 billion from the existing LTROs) that have threatened short-term rates.

And there is, of course, Syria which is becoming increasingly problematic for Obama whose support in Congress is looking ever shakier. Will he go it alone in the case of a no vote?

Overnight news highlight bulletin:

  • Treasury 10Y yield last night rose to 3.00% for first time since 2011 before reports forecast to show U.S economy added 180k jobs in August, unemployment rate held at 7.4%.
  • Markets looking for upside surprise, roundup of views here * Yields from 2Y to 10Y all reached 2-year highs yesterday after Aug. ISM Non-Manufacturing Composite rose to an 8-yr high, bolstering expectations for Fed tapering of asset purchases
  • Fed meets Sept. 17-18, includes release of updated economic projections and Bernanke press conference; many expect  olicy makers to announce QE tapering, roundup of views here
  • German industrial production fell 1.7% in July, more than forecast, after surging in June
  • G-20 leaders discussed efforts to shield their economies from potential stimulus withdrawal as the fallout from the Syrian conflict amplified global risks
  • A week after he surprised his national security advisers by deciding to seek authorization from Congress, Obama’s path to military strikes against Syria faces reluctance at home and abroad
  • Disclosures that the U.S. National Security Agency can crack codes protecting the online traffic of the world’s largest Internet companies will inflict more damage than  earlier reports of complicity in government spying, according to technology and intelligence specialists.
  • Sovereign yields mostly lower, EU peripheral spreads mixed. Euro Stoxx Banks -0.1%. Nikkei falls 1.5% as JPY gains through 100 level, Shanghai Composite -0.8%. European equities mixed, U.S. equity index-futures fall. WTI crude, copper and gold gain
  • Analysts at Goldman Sachs expect that a new LTRO from the ECB with a fixed interest rate for the duration of the refinancing operation will be announced this year, probably toward the end of the year.
  • Larry Summers faces key 'no' votes if picked for Fed as 3 Senate banking panel Democrats expected to reject Summers's nomination, according to a report.

Market Re-Cap from RanSquawk

Stocks traded steady on Friday as market participants awaited the release of the latest jobs report from the BLS. Despite higher energy prices, basic materials and oil & gas sectors underperformed in Europe, while utilities outperformed after SocGen raised the sector to neutral from underweight. There was little in terms of fresh EU related macroeconomic news flow, but analysts at Moody’s revised the German banking sector outlook to stable from negative, reflecting a year of reduced crisis-related losses.Elsewhere, the release of less than impressive macroeconomic data from the UK meant that GBP underperformed, which in turn saw the GBP 1y1y forward swap rate move off its highest levels this year, which also matched best levels since July 2011.

Even though the ECB failed to appease market concerns of excessively high money market rates when the council met yesterday, the Euribor curve flattened this morning, with various tier 1 banks such as JP Morgan and GS stating that they expect the ECB to launch another LTRO later in the year. Of note, overnight during the Asian session, USTs yield finally topped 3.00% mark, highest since July 2011. As a guide, the last time the 10-year yield was this high was just before the US debt-ceiling fears intensified which eventually led to the downgrade of its AAA sovereign rating. Going forward, apart from digesting the release of the latest jobs report, market participants will also await the release of the latest jobs report from Canada.

Asian Headlines

PBOC governor Zhou said China has ample measures for QE exit and that global stabilizations in line with China interest.

EU & UK Headlines

Analysts at Goldman Sachs expect that a new LTRO from the ECB with a fixed interest rate for the duration of the refinancing operation will be announced this year, probably toward the end of the year.

ECB says banks to repay EUR 3.705bln from 1st 3y LTRO and EUR 2.2bln from 2nd LTRO.

Moody's revised the German banking sector outlook to stable from negative, reflecting a year of reduced crisis-related losses. Outlook change reflects improved capital strength, but warns that pressures on profit margins are to persist.

German Industrial Production SA (Jul) M/M -1.7% vs. Exp. -0.5% (Prev. 2.4%, Rev. 2.0%)

German Industrial Production WDA (Jul) Y/Y -2.2% vs. Exp. 0.9% (Prev. 2.0%, Rev. 0.1%)
UK Industrial Production (Jul) M/M 0.0% vs. Exp. 0.2% (Prev. 1.1%, Rev. 1.3%)
UK Industrial Production (Jul) Y/Y -1.6% vs. Exp. -1.7% (Prev. 1.2%, Rev. 1.4%)
UK Manufacturing Production (Jul) M/M 0.2% vs. Exp. 0.2% (Prev. 1.9%, Rev. 2.0%)
UK Manufacturing Production (Jul) Y/Y -0.7% vs. Exp. -0.7% (Prev. 2.0%, Rev. 2.1%)

US Headlines

Larry Summers faces key 'no' votes if picked for Fed as 3 Senate banking panel Democrats expected to reject Summers's nomination, according to a report. The likely 'no' votes are Elizabeth Warren, Sherrod Brown and Jeff Merkley. Democrats currently hold a 2-vote majority in the 22 member panel so the loss of three Democrats would make it impossible for Summers to be confirmed without the backing of at least some of the 10 Republicans on the panel.

Equities

Stocks traded steady on Friday as market participants awaited the release of the latest jobs report from the BLS. Despite higher energy prices, basic materials and oil & gas sectors underperformed in Europe, while utilities outperformed after SocGen raised the sector to neutral from underweight.

FX

Even though USD/JPY trended lower overnight amid profit taking related flow after topping the key 100.00 the day before, the release of less than impressive data from Eurozone and the UK ensured that the USD traded steady. Going forward, the volatility is expected to pick up, especially once market participants digest the jobs report from the BLS. Analysts at Goldman Sachs expect INR and IDR to lag until 2015.

Commodities

US officials said that Iran is plotting revenge on US in case of a Syria strike and that they have Intercepted message calls for militant reprisals in Iraq if Syria is hit.

- Obama at G20 leaders dinner stressed US has high confidence that Syria used chemical weapons according to a Senior White House Advisor.

- China says UN should play role resolving Syria issue.

- Russia sends another landing ship towards Syria according to Interfax News Agency.

Iraqi crude oil pumping halted to Turkish port of Ceyhan via the Kirkuk-Ceyhan pipeline.

* * *

Macro recap from the SocGen FX team:

“All oars expected in the water” is the title of the US employment report preview by our US data watcher par excellence Brian Jones, but what you get when a crew of eight steams up to the finish line is an immense amount of spray, and finally exhaustion when the boat crosses the line. This is how the market has traded up to the marquee event and finishing line of the week, with US yields threatening to extend over 3.00% and the USD reaching the highest level since 19 July. A weekly close above 3.00% for the 10y today would deal a significant psychological blow to investors in most asset classes and would set the scene for a further hit to EM assets. Our year-end target of 3.25% is emerging rather rapidly over the horizon but there should be a pause in the market once the next FOMC meeting is out of the way. Markets have not behaved this week as if Syria is a major tremor waiting to happen but we should see yields temporarily snap back when a military strike gets underway (next week?) though the scale of any safe haven flight will be dependent on stocks and oil.

The focus will be firmly on what today means for the FOMC meeting of 18 September. The Congress may vote next week in favour of a 60day strike window for the US military but that is unlikely to keep the Fed out of tapering action for two months with strengthening output growth and falling unemployment make a powerful case to start reducing asset purchases. After the hint of the Beige Book Wednesday, today's employment report should clear the final hurdle for a cautious $10bn start to tapering. Brian's call for a 220k gain in August employment sits comfortably at the top end of the range (consensus 180k). The unemployment rate is forecast to fall to 7.3%, 0.3ppts away from the 7% guideline the Fed set out before it considers terminating asset purchases altogether.

For EUR/USD, a strong US report today could open the floodgates to a lurch below 1.30 in the run-up to 18 September, with bearish seasonals and a dovish ECB chipping away at the currency's status as a refuge from faltering EM currencies. The ECB yesterday pledged to keep rates at the current level or lower and the isolation of downside growth risks and falling excess liquidity means that more non-standard measures (LTRO) to support credit growth cannot be ruled out. It's another 2.7% to the July low of 1.2755, and wider US/EU rate spreads should maintain downward pressure.

Canadian employment and German and UK industrial output are also due today as are Greek and Portugal Q2 GDP.

* * *

Finally, here is DB's Jim Reid with the full overnight narrative

Welcome to another Payrolls Friday. Today’s report is the last major jobs data before the next FOMC meeting in less than two weeks time where policymakers are highly anticipated to announce a tapering of the current asset purchase program. As for today’s release, DB economists are expecting +190k on both headline and private payrolls and a one-tenth decline in the unemployment rate to 7.3%. That said, given the strength in the two ISM reports that we saw this week, DB's Joe LaVorgna thinks that the risk to today’s number is on the upside.

Indeed yesterday’s ISM non-manufacturing index came in at a better-than-expected (58.6 v 55.0) with a 2.6pt rise over the month. This brings the index to its highest level since December 2005. Notably it is the meaningful improvement in the employment subcomponent of the report (57.0 v 53.2) that has Joe excited about today’s payroll print given that the service sector accounts for approximately 80% of employment. ISM aside, the ADP employment report (176k v 184k) was softer-than-expected but offsetting that was a lower-than-expected initial jobless claims print (323k v 330k). As for markets the positive momentum in the US data flow continues to add negative pressure on Treasuries as we saw the 10-year yield soar and close near its intraday highs of 2.9993%. In after hours trading and in the Asian session we've now breached 3% a couple of times. The last time the 10-year yield was this high was in July 2011 just before the US debt-ceiling fears intensified which eventually led to the downgrade of its AAA sovereign rating. As we highlighted in our latest August performance review on Monday, the very aggressive back-up in US yields have not just had a spill-over effect on other DM core yields but have also added serious pressure on EM carry.

Indeed since Bernanke’s infamous tapering speech on the 22 May, 10-year government yields in the US, UK, Germany, and France have risen 96bp, 111bp, 62bp and  73bp respectively. Across EM, we’ve also seen the local currency of Indonesia, India, Brazil and Turkey lose 16.3%, 15.9%, 11.8% and 10.6% against the Greenback, respectively. Other EM assets have also been hurt. Staying on this particular theme, the spill-over risks into EM from an unwinding of DM stimulus was a dominant theme at the two-day G20 summit that started yesterday. Chinese officials said that “we hope that as the issuing country of the largest reserve currency in the world the United States should be mindful of the spillover effects of its macroeconomic policies”. South Korea also weighed in by saying that “if a reserve currency country changes its monetary policy stance, it should consider not only its domestic economic conditions but the effects on the global economy”. India’s President also asked for the need for “an orderly exit from the unconventional monetary policies being pursued by the developed world for the last few years”. There are also reports that EM countries will create an $100bn pool of currency reserves to safeguard against potential financial shocks. According to a statement issued at the G20 summit as sighted by Bloomberg news, China will contribute $41bn to the pool while Russia, India, and Brazil will contribute $18bn each. South Africa will also add $5bn. DM central banks are treading across unchartered waters here as far as monetary policy is concerned and the unwinding of the unprecedented amount
of cheap liquidity was never going to be straightforward.

Back to markets, Asian equities are generally trading firmer as we type, helped by modest gains in the US overnight (S&P 500 +0.12%). The Hang Seng, Shanghai Composite and the KOSPI are +0.2%, +0.3% and +0.4%, respectively. The Nikkei (-0.9%) is underperforming regional peers as developers and other Olympic related companies fall ahead of this weekend’s host announcement. It seems like yesterday that London was given the nod!! In credit markets, Asian IG spreads are about 1-2bp tighter while the new Korean sovereign bond deal remains well supported in secondary markets. Gold is a little firmer in Asia overnight at $1371/oz after having fallen over 3% earlier this week. Crude is steady at around $115/bbl.

Looking at the day ahead we have trade balance and IP data across several countries in Europe but all eyes clearly will be on Payrolls.

See the original article >>
As mortgage rates spike, a market distortion appears

by SoberLook.com

Mortgage rates hit another high today, touching levels not seen since early 2011. We have now experienced an almost 150bp spike (over 40% relative increase) from the lows in a matter of a few months.

Something highly unusual is happening in the mortgage market however. Recently jumbo (see definition) mortgage rates have been lower than conforming rates. This is one of those market dislocations that most would have never thought possible. Yet here we are.

Source: MND

Jumbo mortgages have generally been considered riskier by banks simply because they typically can not offload them to Fannie and Freddie as they can and do with conforming mortgages. Therefore banks would charge a premium for having to tie up balance sheet.
What's driving this distortion? As the Fed prepares to reduce its purchases (which include MBS), agency MBS bonds are selling off. The latest price decline in fact has been quite sharp.

Price of 30yr Fannie MBS with 4% coupon (source: MND)

Conforming mortgages are priced based on a spread to these bonds, and therefore very much tied to the MBS market fluctuations. As the MBS market sold of, conventional mortgage rates spiked. Jumbo loans on the other hand are not financed with MBS. Flush with deposits, banks have access to extraordinarily cheap capital and are seeking to earn more interest income. Seeing stability in high-end property values in certain areas, they are more willing to take additional risk these days. Of course jumbo mortgage applicants better have top credit scores, high incomes and high down payment to qualify for these loans - a set of requirements which is often even more stringent than the conventional mortgage applicants. With willingness to deploy some balance sheet and competition for wealthier clients, banks are charging less for these loans.
Qualified applicants who are now on the borderline between a conventional and a jumbo mortgage will be incentivized to buy a larger property in order to get a lower rate. Lenders in effect are charging the same borrower less for borrowing more money. High-end properties will therefore benefit from this effect at the expense of lower-priced homes. This is yet another market distortion created through government-based housing finance, with securities in this market dominated by the Fed.

See the original article >>

3 Things I Think I Think

By Cullen Roche

Lots of random stuff I am catching up on…..

1)  In his monthly letter, Bill Gross says baseball is boring, but fails to actually make any credible reasons why other than there’s not enough action.  He says:

“First of all, baseball is the most boring game in the world next to cricket. I don’t know how to play cricket, which is the only reason I rank it second. CNN Sports did an actual survey of how much time during an average two hour and 39 minute game that baseball players are actually moving – you know, swinging a bat or running to first base. Five minutes and 13 seconds!”

First of all, if you don’t know how to play something then how can you even begin to understand whether it’s boring or not?  I personally don’t know much about cricket so I’ll let my foreign friends here defend a game that millions of people love, but I’d only say that you shouldn’t hate what you don’t even know.  That’s just silly.  But let’s get real here.  Baseball is a thinking man’s game.  If baseball is boring then chess is an abomination!   And if action equates to excitement then the marathon is the most exciting thing in sports!  Of course, chess isn’t boring and marathons aren’t exciting.  But the reason why real baseball lovers love baseball is because it’s a strategic man’s game.  It looks awfully boring at first glance, but there’s quite a bit of action going on at all times.  All that “scratching” is part of a secret conversation going on between two sides who are trying to win the game.  Maybe Bill Gross never played competitive baseball.  I did.  And I appreciate the game because of the strategy involved.  With a runner on second base and a left handed batter up and 0 outs you have to protect against the potential for a right side ground ball or a hit and run that will advance the runner to single base scoring position.  Do you pitch him inside knowing he might be able to pull the ball to where he can sacrifice himself to move the runner?  What if he hits the inside ball well?  What if he hits the fast ball well?  What do you do with a 1-2 count?  Do you throw around the batter?  What if the next batter is a poor batter?  Do you intentionally walk the runner?  Where do you position the defense to optimally counter the offense’s strategy?  WHAT IS THE OFFENSE’S STRATEGY? What if you have guessed their game plan wrong?   The strategy in a baseball game, in every pitch is hundreds of moves deep in the exact same way a chess game is.  You might not appreciate it, but odds are, if you don’t it’s because you don’t understand it….

2)  Scott Sumner asks an important question:

“What would Bernanke tell his mother?”

Basically, Scott (we’re on a first name basis now after our brief run-ins with one another) says the Fed has failed, but only because they haven’t done enough.  He says they should set an NGDP target.  I say, what will help them hit the target.  He says they just have to set the target and that’s enough.  I say what’s the transmission mechanism.  He says the Chuck Norris effect.  I say Bruce Lee beat Chuck Norris.  And round and round we go.  So, what should Ben Bernanke tell his mother?  Ben should thank his mother and father (the US Congress) for having run enormous budget deficits these last 5 years and giving the appearance that this chart was all due to QE.  Could Ben do more?  Probably.  But it will require a real transmission mechanism to be effective and no, saying is not enough, you must do….

3)  I came across this quote that got my wheels turning:

“Happiness is not something you postpone for the future; it is something you design for the present.”

Isn’t it interesting how so much of our monetary lives revolve around deferring happiness?  We plan to follow a green line into the future that leads us to a magic number where we buy an island and retire to a life of pina coladas or something like that.  But is that what it’s really all about?  Isn’t it more about finding the right balance so you can enjoy the life you have TODAY rather than some life you might have TOMORROW?   Isn’t there a better way to balance all of this so that we’re not simply always building a goal around a future that might never materialize or one that, if it does materialize, isn’t nearly as glamorous as we think?   Chew on that deep thought as you head into the weekend and let me know what you think….

See the original article >>

World sugar surplus 'far smaller than thought'

by Agrimoney.com

The surplus in global sugar supplies "is nothing like as large as it is assumed to be", Czarnikow said, warning that investors were underestimating the boost to consumption from lower prices.

The London-based sugar merchant slashed to 2.0m tonnes, from 3.9m tonnes, its forecast for the world sugar surplus in 2013-14, a figure well below that from other commentators.

The International Sugar Organization two weeks ago forecast a surplus of 4.5m tonnes, while an analysts' poll taken in late July put the figure at 4.0m tonnes – although some care must be taken in making comparisons given that commentators start marketing years in different months.

Czarnikow's downgrade reflected in part a weaker forecast for output, reflecting in Europe a drop in beet sowings and a "tough growing season", and a 10m-tonne reduction, to 585m tonnes, in the estimate for the cane harvest in Brazil's important Centre South region.

The Centre South is responsible for nearly 90% of sugar output in Brazil, the top producer and exporter of the sweetener.

'A lot stronger than expected'

However, Czarnikow also raised its forecast for consumption growth, to 2.3% in 2013 and 2% next year, adding that even after these upgrades it was likely "still being conservative".

"Demand for sugar has been a lot stronger than we had been expecting," the broker said, saying that it had been "consistently surprised the strength of physical demand" over the last 12 months.

"What we believe has happened is that the falls in price and increases in affordability have been enough to encourage a sharp rise in marginal demand."

Market signals

The broker cited in support of its argument that supplies are tighter than thought sugar prices which, while down some 15% so far in 2013 on New York's futures market, have not fallen "anything like the extent predicted".

Furthermore, the New York futures curve had remained unusually flat, rather than showing the typical spread of some 0.6 cents per pound between October and March contracts, Czarnikow senior analyst Stephen Geldart told Agrimoney.com.

And, in the physical market too, Brazilian mills were not offering the discount, of some 1 cent a pound to futures, typical at this time of year, when sugar output is at a seasonal high.

"Our view is that the explanation has to be logical - the surplus in sugar is nothing like as large as it is assumed to be."

'Good indicator'

And consumption data, which the merchant said are "very difficult to verify", looked likely a source of surprise given indications from trade data.

"The strength of global trade in physical sugar, which is up over 10% year-on-year, is a good indicator of the way in which consumers have reacted to low prices."

Mr Geldart said that, if the surplus was as strong as suggested, there would be more evidence of rising inventories, with Brazilian producers, for instance, offering discounts to get shot of supplies.

Instead spot sugars are actually trading at a premium.

"As it is, China is the only real destination for world market sugar that has built stocks," he said.

"China aside you have to look at the US, the European Union and India to see good stocks and those markets are not really that fungible with the global market for all sorts of reasons."

See the original article >>

Gold Confiscation

by Keith Weiner

Gold Confiscation

It is well known that in 1933, President Roosevelt confiscated the gold of U.S. citizens and made possession of gold illegal. He gave gold owners about $20 an ounce and when he was done, he raised the gold price to $35. The common telling of this story portrays it as a simple case of robbery. It makes people wonder if 1933 is a precedent, if the government might confiscate gold in the not-too-distant future.

I don’t think it was so simple.

Let’s look at how the monetary system worked prior to 1933. The U.S. had a central bank, but it did not have the unlimited and arbitrary power that the Fed wields today. Gold performed a vital function in the economy, regulating credit and interest.

At that time, there was not what we think of today as a gold “price”. Loans and other credit were made in the form of gold, and repayment or redemption was in gold (even if most of the people did not demand redemption). Credit, including dollar bills,was redeemed at the rate of one ounce for about $20. The dollar at the time was closer to a weight of gold, than to a separate money in its own right.[1]

What does it mean to say that credit is redeemable? One way to look at credit redemption is that it extinguishes debt. If a debt is paid in gold, the debtor gets out of debt. But, also the debt itself goes out of existence. Credit contracts, as it should. In the gold standard, even in the centrally planned, centrally banked adulterated gold standard that existed until 1933, credit could contract as well as expand. This is not what the government wanted then (or now). Let’s look at one mechanism of credit contraction.

A depositor with a demand deposit account could demand his gold from a bank. If the bank were scrupulous about duration matching, it would own only gold and Real Bills to back it. Redeeming the deposit would cause no harm. However, one factor in the boom of the 1920’s was duration mismatch (i.e. borrowing short to lend long) . Much can be said about this practice but for now, let’s focus on the fact that the bank has extended credit that the owners of the capital—the depositors—did not intend to extend. Depositor withdrawals of gold forced credit to contract, and this contraction caused problems for the bank. A forcible contraction of credit[2] is how I define deflation.

When the depositor demands his gold, it pulls precious liquidity out of the bank. In 1933, there were runs on the banks and many banks defaulted when they could not honor their deposit agreements. Redemption also forces the bank to sell bonds. Selling bonds causes the price to drop. Since the interest rate is the inverse of the bond price, interest rises.

Someone, somewhere in the economy is suddenly starved for credit, perhaps in the middle of a long-term project. We call him the “marginal entrepreneur”. He must liquidate assets. He must also lay off workers, because his reduced capital base cannot support the same workforce.

President Roosevelt had a brilliant (if evil) advisor, John Maynard Keynes. Keynes would certainly have grasped the nature of this mechanism as I describe it above. Roosevelt presided over a wholesale conversion of the economy from free markets, to central planning under regulations, taxes, diktats, price minimums, price caps,control boards, duties, fees, and tariffs. Central planners regard the market as irrational, chaotic, and self-destructive. They see no reason to let the market prevail. It is so easy to order things, as they “ought” to be ordered.

In 1933, they wanted to stop runs on banks and to push down the rate of interest. A secondary goal was to begin the slow process of altering the public’s perception of gold as money.President Roosevelt’s Executive Order 6102 accomplished all of these goals (at least runs due to a lack of gold liquidity—he had no power to stop runs due to other causes).

Today, by contrast, the dollar is irredeemable. The dollar is a debt obligation of our central bank. When you pay a debt with another form of debt, you are personally out of the debt loop, but the debt does not go away. It is merely shifted to the Fed. There is no extinguisher of debt. There is no way for debt to be paid and go out of existence, and no way for a depositor to redeem his deposit in gold. This is a fatal structural problem with our monetary system.

This also means that the saver cannot force credit contraction or the rate of interest to rise. Instead, the interest rate is putty in the hands of the central bank (well, not quite, as I am arguing in my ongoing series on the theory of interest and prices). The saver is totally disenfranchised.

And how about the public perception of gold and money?Even the gold bugs today think of the value of gold in terms of how many dollars it is “worth” per ounce. But for the lonely warriors in the 1970’s and 1980’s who kept the memory of gold alive through the dark years, and but for more recent gold advocates, and now the Gold Standard Institute, the victory of the central planners would have been complete.

Could the US government grab the gold as they did in 1933? Anything is possible. I make no political predictions. One thing is certain. If they grab gold today it will not be for the reasons they did it in 1933. Those reasons are no longer applicable.

See the original article >>

Market Corrections: Is the Big One Over, Again?

by Greg Harmon

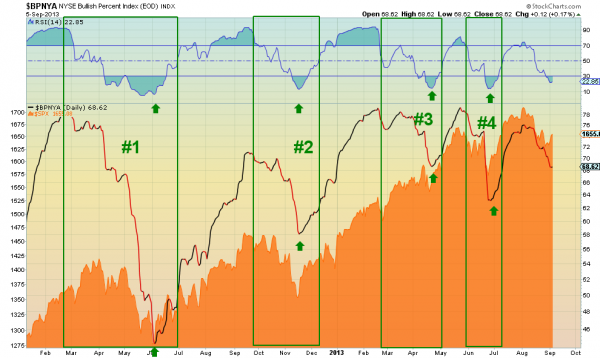
Five months ago the market was in a similar set up. Maybe working off some of the last run higher or maybe about to start a major move. At least that was the debate, and it is again today. At the time I asked – Market Corrections: Did You Miss The Big One? Turns out that was a bottom, and we have had yet another one since then in June. At the time I used the NYSE Bullish Percentage Index as an indicator to give a possible outcome. Below is the updated chart from the April low. What is it telling us now?

bpnya

The key to this chart is the NYSE Bullish Percent Index ($BPNYA) hitting an extreme oversold condition. Not that the index has actually been sold but the momentum to the downside is extreme. The previous 4 bottoms the RSI, which measures that momentum, has bottomed between 5 and 15. It is currently at 22.85, and may have bottomed. Not quite there but very close. Close enough that it could reverse at any time. So what happens if it does? Well, the last two years history shows that like an extremely oversold stock the BPNYA will reverse and when it does it takes the S&P 500 ($SPX) up with it. That does not mean it will happen this time. What do you think?

See the original article >>

Gold Ahead of Payrolls, Ctd.

by Pater Tenebrarum

If/Then

Over the past two trading days, gold has suffered an extended bout of pre-payrolls jitters. This was to be expected, as the gold stocks, as they almost always magically do, signaled it once again. The easiest trade in the world is to  short gold when gold stocks clearly underperform it and go long when they strongly outperform it.

Here are a few additional observations prior to the jobs data release. Obviously, so far gold has held above the major support at $1,350, but it is not  too far from there at the time of writing, so there will likely be a 'moment of truth' at some point between today and next week.


Gold-3-daysGold, December contract over the past two days, 20 minute candles - click to enlarge.


Interestingly, 3 month GOFO, which had briefly turned positive in recent days, has turned negative again yesterday. However, the more interesting action was in gold stocks. They were weak on Thursday, but Wednesday and Thursday together still saw them outperform the metal. Nothing untoward has occurred on the chart, but it sure does look now as though at the very least a test of gap support and the 50 dma is in store. Given the volatility of the sector,  these levels may well be undercut even, but the (short term) bullish case would be better served if they hold:


HUI-dailyHUI, daily – approaching the 50 dma - click to enlarge.


Looking at the ratio of the HUI to gold, we can see something interesting: just as a slightly negative divergence with the gold price was in evidence at the recent peak, a slightly positive divergence has formed in recent days:


HUI-Gold ratioHui-gold ratio, short term divergences with gold (green line at the bottom) - click to enlarge.


Obviously, it won't take much to erase the recent positive divergence, but it definitely exists at the time of writing. Since the negative divergences seemingly always 'work', then perhaps the positive ones will too for a change, but we will have to wait and see.

BLS Jobs Data – How Reliable Are They?

There are more and more reasons to be skeptical about the jobs data. For instance, Mish points out the very large rise in Gallup's unemployment rate over the past month. We promise to eat our hat if the BLS numbers come even remotely close to what Gallup reports. Zerohedge recently reported on the growing gap between the BLS payrolls increase and JOLTS data (Job Openings and Labor Turnover Survey), which almost never drift apart as much as they have done this year. 

Charles Biederman recently noted that treasury withholding data are at odds with the payrolls report as well. Here is a chart illustrating the situation:


Withhold Receipts and EmploymentTreasury withholding receipts and employment. No jiba – click to enlarge.


Obviously these are often drifting apart, but growing and persistent gaps between the two data series should raise eyebrows as well.

This is all the more reason to believe that the data themselves are far less important to the gold market than often appears to be the case – as always, it is the reaction to the data that will count, and that does not necessarily mean the immediate reaction. Rather, we would expect the market to begin to show its hand in the course of next week.

See the original article >>

Brazil highlights tale of two markets in coffee

by Agrimoney.com

Brazil highlights tale of two markets in coffee

The International Coffee Organization highlighted the continuing drop in the premium of arabica coffee over robusta even as researchers flagged stark differences in supplies of the two beans in the important market of Brazil.

While prices of all major coffee types fell last month, the "significant" decreases in values of arabica coffee, generally deemed of higher quality, continued to outstrip that of robusta.

Colombian milds proved the worst performer, with values falling 2.9%, compared with a 1.3% drop in robusta prices, and encouraged by a recovery in Colombia's arabica coffee production.

The ICO said: "The arbitrage between arabicas and robustas narrowed in August," reaching its lowest levels since 2008.

'Firm demand'

The comments came as Cepea, the agricultural research centre linked to Sao Paulo University, highlighted the tighter supplies of robusta coffee than arabica in Brazil - the top coffee producing country (mainly arabicas) and second-ranked consumer.

A Brazilian robusta market characterised by only "small changes" in prices since March, contrasting with continued declines in arabica values, "is mainly related to the firm demand from Brazilian roasters", Cepea said.

While the ICO last month flagged signs that a smaller premium was encouraging Brazil's roasters to reverse a decade-long trend and switch back to arabica coffee, they were still using 40-45% robusta in their blends, Cepea said.

A decade ago, that proportion was 15%.

'No product left available'

Meanwhile, analysts are downgrading ideas of supplies of robusta beans thanks to ideas that the crop in Espirito Santo, which produces more than 75% of the domestic robusta crop, "may be lower" than the official forecast of 9.25m bags.

"The smaller production this season is also an aspect that has been underpinning quotes," Cepea said.

Furthermore, as for the last harvest, "agents say that there is no product left available to be traded", with 20-30% of the current crop sold.

Such dynamics are in sharp contrast to those of arabica beans.

Brazil's arabica supplies are so ample – buoyed by a strong carryout from last year's record harvest, and this year's strong 36.4m-bag crop – that the government has, besides introducing a price support programmes, backed loans to help farmers store crop and slow the weight of sales on values.

Negative margins

The ICO's comments came in a monthly report in which it nudged down by 100,000 bags to 14.4m bags its estimate for world coffee production in 2012-13, although still representing a surplus over consumption of some 142m bags.

The organisation also dented hopes that weaker currencies in many producing countries, such as Brazil and India, had brought many producers back into profit, by implying raised local values for coffee, which is traded in dollars.

"A weaker currency can encourage greater selling by exporting countries, thus increasing availability in the market and putting further downward pressure on prices," the ICO said.

"Although changes in the exchange rate could potentially increase the price paid to growers in domestic currency, it will also increase the cost of inputs which are imported in US dollars.

"As a result, particularly given the significant decreases in coffee prices over the last two years, current market levels are still believed to be below the cost of production."

The ICO has cautioned over huge social impact from weak profitability of a sector which is a major rural employer in many coffee producing countries.

See the original article >>

Follow Us