

Click to enlarge image Click to enlarge image

Click to enlarge image
by Marketanthropology
Click to enlarge image Click to enlarge image
Click to enlarge image
by Marketanthropology
By Greg Madison
Everyone has a different opinion on how best to take the measure of the markets and the economy at large.
Hairs standing up on end, a knee that aches with the weather, tea leaves, earnings estimates, the Hindenburg Omen - it seems like all of these are significant in some way at one time or another.
Here at Money Morning, it's no different. We have an editorial meeting each and every morning - rain or shine - where the editors and writers huddle to pitch the stories and reporting we bring you every day. The meeting covers a huge range of financial and policy topics, and ideas of all stripes are kicked around and discussed until a solid story emerges.
A few days ago, we talked about important financial and economic indicators, where each of us turn to get some idea of the health of the markets and economy. Someone asked, "What's the number you look at first ever day?" We all answered in turn, and a really interesting collection of ideas began to emerge - as it always does.
Here are the numbers we think you should be looking at every day - before breakfast, after coffee - if you want to get an idea of the big picture.
If the economy heats up the 10-year yield should rise with the growth. Conversely If the economy slows down, the yield would likely fall. A caveat: the Fed's easy money policies have mucked up this indicator a bit, but the recent upward spike in the 10-year might be telling us the economy is slightly improving.
If you have anything you'd like to add, we'd love to hear from you. What #economicindicators concern you the most? Sound off on our Twitter page, or drop us a line on Facebook.
See the original article >>
By tothetick
Looks like the sun has gone behind the clouds in China for a bit! Not only are the solar panels creating friction between China and the EU, but now it turns out that last month saw Chinese export growth unexpectedly decrease. Imports into China were also in for a decrease as the dropped last month (by 0.3%) to a record low and you’d have to go back to the start of 2012 to get better figures. Although, some might argue that what with the faked trade-surplus figures revealed last month, it’s hardly surprising that figures actually fell last month.
Beijing released figures today that showed that there was a rise of 1% in overseas sales compared with May 2012 (General Administration of Customs). April had shown an increase of a staggering 14.7%. The figures for May are well below any analysts’ forecasts and it’s perhaps revealing that China is trying to get its house in order in the wake of criticism that they had faked their trade surplus. There is always a silver lining in a cloud some might say. The figure for May seems a little more realistic (and easier to swallow for the rest of the world’s economies). For once, we are seeing a true figure regarding Chinese exports. That picture shows the outlook as being pretty depressed. One man’s meat is another man’s poison? I think we can all take a strong Chinese export figure, but only if it is realistic and a true representation. Otherwise, we can lie too, can’t we? Can’t we just!
But, a depressed figure in exports from China might show signs that economic recovery is not as sustainable around the world as the Federal Reserve might like us all to think. Similarly, in the EU it’s not because they use positive-speech tactics and tell the Japanese that the crisis and the recession is over in the EU to boost morale and confidence that it is actually going to happen. Present François Hollande of France gave a speech while on a state visit to Japan that the “Euro crisis is over” today. Of course it is! Didn’t everybody already know that, with unemployment rising and the wonderful growth prospects that are being experienced in the EU27. Such revelations are nothing more than irresponsible and can certainly be likened to dissimulation. Perhaps, Mr. Hollande has been taking a leaf out of the little red book of how to fake figures that Mr. Xi Jinping seems to keep in his pocket.
At least, it will be hard to criticize the Chinese over fake figures, when we are lying through our teeth at the same time. Despite some good gains in the US regarding employment and consumer confidence, the figures in China can only be telling of a fall in world economic growth.
Both exports and imports between China and the USA have taken a toll. Chinese exports to the USA dropped by 1.6% in May in comparison with May 2012. US exports to China also dropped by roughly the same amount (1.5%) over the same year period.
The European Central Bank announced only a few days ago that the Eurozone was going to contract by 0.6% in 2013. That was a worsening of the previous forecast of 0.5%.
The Yuan is also strengthening and it has increased by as much as 1.6% in comparison to the US Dollar in the past year. That’s nothing in comparison with the 14%-hike against the Yen. Chinese exports look set to remain weak while the Yuan is so strong.
Now, the growing furore between China and the EU over duties on solar panels and now EU wines is likely to have a further effect on Chinese export figures. Looks like the sun has gone behind the clouds for the moment.
Whatever happens, next week looks like being a pretty rough ride on the international markets and you had better hold on to your pants unless you like roller-coastering it, that is!
by Greg Harmon
Last week’s review of the macro market indicators suggested, heading into June that the markets looked ready to take a breather and perhaps pullback. Gold ($GLD) though was biased higher in the short term in its downtrend while Crude Oil ($USO) headed toward the bottom of its range. The US Dollar Index ($UUP) and US Treasuries ($TLT) both looked to continue lower. The Shanghai Composite ($SSEC) maintained an upward bias but might consolidate first while Emerging Markets ($EEM) continued biased to the downside. Volatility ($VIX) looked to remain low but drifting higher keeping the long term bias higher for the equity index ETF’s $SPY, $IWM and $QQQ, but maybe a drag on them in the short run. The index ETF’s themselves appeared to be weakening in their uptrends with the SPY the weakest followed by the IWM and the QQQ still showing some strength in longer charts.
The week played out with Gold running sideways mainly before a dip Friday while Crude Oil rose from the bottom of the range. The US Dollar continued lower while Treasuries consolidated at the lows. The Shanghai Composite broke lower while Emerging Markets showed signs it may be slowing its descent. Volatility continued higher before falling back to end the week. The Equity Index ETF’s started lower and continued downward moves, but all found support and reversed to end the week. What does this mean for the coming week? Lets look at some charts.
As always you can see details of individual charts and more on my StockTwits feed and on chartly.)
SPY Daily, $SPY 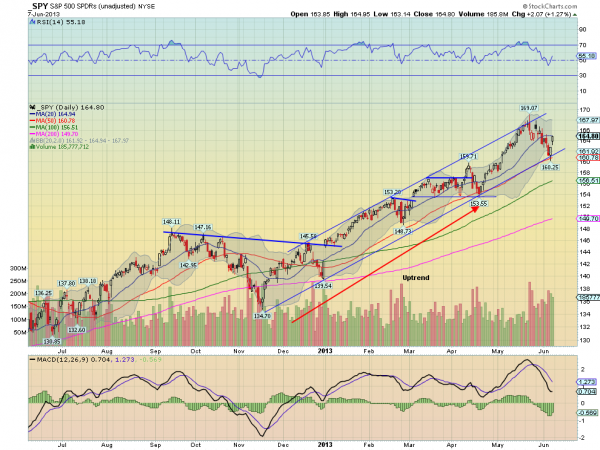
SPY Weekly, $SPY 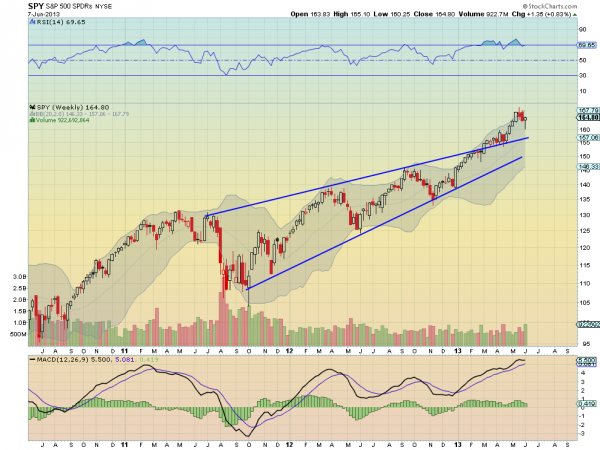
The SPY pulled back but found support at the rising trend from November and the 50 day Simple Moving Average (SMA). A bounce higher Friday confirmed the support and the Relative Strength Index (RSI) rebounded, never having turned bearish, while the Moving Average Co0nvergence Divergence indicator (MACD) is now improving on the histogram and flattening on the signal line. Things are looking brighter on the daily chart. A move over the 20 day SMA would seal the deal. Out on the weekly view there will likely be debate as to whether the candle is a Hanging Man, potentially signaling a top if confirmed lower, or a Hammer after a short pullback, if confirmed higher. It does not matter what you call it. The trend is higher until it is turns lower. The RSI is holding near the technically overbought level but running sideways while the MACD continues to climb. There is resistance at 166.50 and 167.50 followed by 169. There is also a Measured Move higher to 175.77, coinciding with the target of an elongated RSI Positive Reversal, and the possibility of a 3 Drives with a 138.2% extension to 182.69. This reversal is a big deal if it holds up. Support below comes at 163 and 161.40 followed by 159.70 and 157.10. Continued Uptrend.
Heading into next week the markets look to be in a better mood. Look for Gold to continue to consolidate or move lower while Crude Oil continues to rise. The US Dollar Index and US Treasuries are biased lower and looking ugly. The Shanghai Composite and Emerging Markets are biased to the downside as well. Volatility looks to remain subdued keeping the bias lower for the equity index ETF’s SPY, IWM and QQQ, and any move lower could trigger a strong equity buy signal. The Equity Index ETF’s themselves are poised to continue their trends higher with the QQQ the strongest followed by the IWM and then the SPY. Use this information as you prepare for the coming week and trad’em well.
Stocks rebounded late in the week, but only after the averages broke a few levels of support that many thought would hold.
The indexes did close the week higher, and well above the worst levels, as the S&P 500 did break under the 1,600 mark during the week. The Dow also had its best day since the first of the year.
The market did get quite oversold by Wednesday’s close. The McClellan oscillator dropped to -311, which was its lowest reading since November 23, 2011. It was my analysis then that we were near a short-term low, but still thought it would take another drop before the correction was over.
Just like then, a break of last week’s lows is still possible. This is based on technical analysis, as well as the length and power of the rally so far in 2013. The Spyder Trust (SPY) was down over 5% from the May high to last Thursday’s low, but the drop so far has only lasted ten days, and a three- or four-week correction would be more typical.

Click to Enlarge
The huge reversal in the Japanese markets over the past two weeks has certainly gotten the world’s attention. The Nikkei-225 futures were up over 47% for the year on May 22, but by Thursday’s close had corrected to just +16%.
This has corresponded with weakness in the yen. Yen futures had dropped over 16% before rebounding, but are now only down 11% for the year.
Japan ETFs have been hit hard; the iShares MSCI Japan Index Fund (EWJ) has retraced over 50% of its rally from the 2012 lows. This is also the case for the Wisdom Tree Japan Hedged Equity (DXJ), which peaked at $53.50 and hit a low last week of $42.
The latter is my favored play for investing in Japan…and I think that this is just a correction. I expect the Nikkei-225 to resume its uptrend and the yen to fall considerably more over the intermediate term.
The reversal in the Japanese markets and the correction in other global markets was based in part on fears that the Fed would stop its accommodative policy as rates have moved higher.
Last week, I noted that T-Bond yields had completed a reverse H&S bottom formation, which projects even higher yields, but that does not require a change in Fed policy. This has put additional pressure on bondholders, who get more worried as there are signs of economic improvement.

Click to Enlarge
As the chart shows, the total return from investment-grade corporate bonds has dropped from 2% in early May to -1% now. With yields expected to move even higher, bond prices have further to fall, and will reach a point where stocks will look even more attractive.
Markets typically correct during times of uncertainty, and further fears over what the Fed will or will not do have helped to reduce the too-high bullish sentiment.
It has been my view since April 12 that the stock market had gotten too far ahead of the economy, and that a correction would help to bring stock prices back to reality. This process is now underway, so there will be some good buying opportunities as we head into the summer months.
Meanwhile, bearish sentiment has increased, but it can still move higher before it reaches levels normally associated with a market low.

Click to Enlarge
The most negative news last week was the ISM Manufacturing Index, which dropped below the 50 level, indicating a contracting economy. This is not consistent with many of our other measures, but we would not want to see several consecutive readings below 50. Of course, the big hurdle was the jobs report, which was a big positive for the market.
The important economic data comes at the end of this week, with jobless claims and retail sales on Thursday, along with business inventories. Then on Friday we get the latest reading on inflation with the producer price index, as well as industrial production figures.
What to Watch
Despite a powerful rally after the jobs report on Friday, it could not reverse the momentum from the negative weekly close the previous week.
Last week, I was expecting further selling this week, but was looking for a bounce in the S&P 500 “from the 1,585 to 1,600 level.” The S&P 500 did reach a low of 1,598, but then closed the week at 1,643.
With most of the averages up over 1.2% for the day, the market internals were not even 2:1 positive. So the first few days of the coming week will be important, as a review of the technical studies still indicates the rally will fail in the 1,650 to 1,660 area.
In last Thursday’s Should You Buy This Dip?, I reviewed the daily technical studies, which revealed that they had broken their support and were now below their declining WMAs. This is consistent with a further correction.
The percentage of bullish individual investors saw a sharp drop, to 29.4%, with almost 39% now bearish. Financial newsletter writers are also less bullish now, down to 45.8% from 52.1%.
The number of NYSE stocks above their 50-day MAs, as discussed in a recent Trading Lesson, peaked near 78 at the May highs, but dropped down to the 48 level last week, relieving the overbought condition.

Click to Enlarge
The March high in the NYSE Composite, at 9,144, held last week, although the index came quite close to its daily Starc- band, which is now at 9,063. The weekly Starc+ band sits at 8,965, and the 38.2% Fibonacci retracement support from the June 2012 lows follows at 8,757.
The McClellan oscillator rallied back to the -114 level by Friday. In an oversold bounce, it could reach the 0 to +50 level.
The daily NYSE Advance/Decline line dropped below its WMA on May 23, then violated its uptrend (line c) last week. The daily WMA is now clearly declining, as the A/D line has just rebounded back to its uptrend.
S&P 500
The weekly chart of the Spyder Trust (SPY) shows that it exceeded the trend line resistance (line a) from the 2010 and 2011 highs last month, and the weekly Starc+ band was also reached. It did manage to close the week just under 1% higher.
The low for the week was $160.71, so the more important support at $159.71 and the April high has held. The rising 20-week EMA is now at $157.60, with the minor 38.2% retracement support (not shown) at $155.94.

Click to Enlarge
The weekly on-balance volume (OBV) has turned up from its WMA, which is a positive sign, and could mean that the correction is already over. There is long-term OBV support at line c.
The daily S&P 500 A/D line and OBV (not shown) are still below their declining WMAs despite the rally at the end of the week. The close Friday was just above the flat 20-day EMA, with further resistance at $165.10 and then $166.30.
Dow Industrials
The SPDR Diamond Trust (DIA), after triggering an LCD the previous week, was able to close the week with nice gains, and well above the low of $148.31. The early April highs also held for the DIA, while the monthly pivot support now sits at $147.64.
The weekly relative performance broke its uptrend (line e) before moving back above its flat WMA. The OBV dropped down to test its WMA, but closed the week higher.
The daily Dow Industrials A/D line (not shown) has turned up, and did hold above its uptrend. Resistance for DIA now waits at $152.91 to $153.73.

Click to Enlarge
Nasdaq-100
The PowerShares QQQ Trust (QQQ) closed the week pretty much unchanged after breaking the prior four weeks’ lows. The low of $71.47 was not far above the September high (line a) of $70.58. The rising 20-week EMA is now at $70.27.
The weekly relative performance is holding above its slightly rising WMA, and is trying to bottom. The weekly OBV closed the week back below its WMA, and is close to support (line c). A decisive break of this level would be negative.
The Nasdaq-100 A/D line (not shown) has turned up sharply, but is still below its WMA. The next resistance now waits at $73.82 to $74.21.
Russell 2000
The iShares Russell 2000 Index (IWM) dropped to a low of $95.73, violating the monthly pivot at $96.65 before closing the week higher. A retest of the breakout level (line d) would take IWM as low as the $94.24 area.
The weekly relative performance did not confirm the recent highs, as it formed lower highs (line e). It is still above its WMA. The OBV looks much stronger, as it has turned up after testing its uptrend (line f) and its rising WMA.
The daily OBV has also moved back above its WMA, so both are positive. The Russell 2000 A/D line closed the week below its WMA, and held above its uptrend last week. There is next resistance in the $99.20 area.
Follow Us