By: Tony_Caldaro
The market gapped up on monday. Then after a pullback on tuesday, it made three consecutive new uptrend highs the following three days. For the week the SPX/DOW were +1.3%, and the NDX/NAZ rose 1.6%. Economic reports for the week were heavily biased to the upside. On the uptick: retail sales, business inventories, export prices, the NY/Philly FED, capacitiy utilization, the NAHB index, housing starts, the CPI/PPI, the WLEI, the monetary base, and weekly jobless claims improved. On the downtick: import prices, industrial production, building permits and the M1 multiplier. Overall it was a fairly solid week for stocks and the economy. Next week we’ll get reports on Existing/New home sales and Consumer sentiment.
LONG TERM: bull market
It does appear, at least to this observer, many have joined the bull market camp and are expecting, at best, small pullbacks along the way as the market works its way higher. Not surprisingly, this is exactly what the market has done for the past three months. We are thinking, however, this market may have other plans for the medium term. Every one to three months, since this bull market began in March 2009, this market has experienced a significant pullback, if not a correction. While we do not see the technical deterioration which usually occurs before corrections. We do see a short term wave count that suggests the uptrend is nearing a conclusion. More on this later.
We continue to label this bull market as a five Primary wave Cycle wave [1]. The last time a Cycle wave [1] occurred in the US stock market was between 1932-1937. Right after the 1929-1932 crash. Thus far, Primary wave I rose from Mar09 at SPX 667 to May11 at SPX 1371. Then Primary wave II unfolded in an elongated flat into the Oct11 low at SPX 1075. We are currently in Primary wave III. Since rising Primary waves divide into five Major waves, as illustrated by the five Major waves of Primary I, we are currently counting Major waves 1 and 2, of Primary III, completed in Oct 11 at SPX 1293 and Nov11 at SPX 1159 respectively. We are currently in Major wave 3.
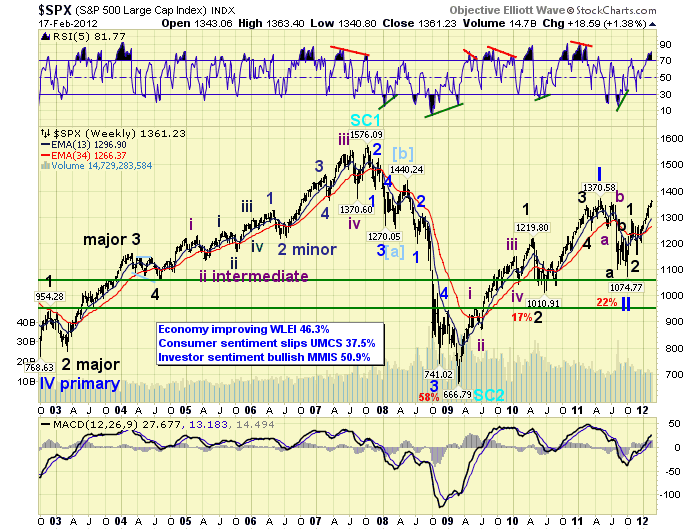
The technicals on the weekly chart, as well as many other technicals, continue to confirm this scenario. The MACD is now well above neutral, which only occurs during bull markets. And, the RSI is now quite overbought, which also occurs only during bull markets. Before this bull market ends it is likely to approach, or even exceed, the Oct 2007 SPX 1576 high.
MEDIUM TERM: uptrend high SPX 1363
The current uptrend, which started in November at SPX 1159, we have been counting as Intermediate wave i of Major wave 3. Every rising Major wave, during a bull market, divides into five Intermediate waves. Thus far we can count five Minor waves up from that low as noted on the daily chart. While Minor wave 4 looks small in comparison to Minor wave 2. That pullback was the second largest of the entire uptrend. Minor waves, of course, are the subdivision of Intermediate waves.
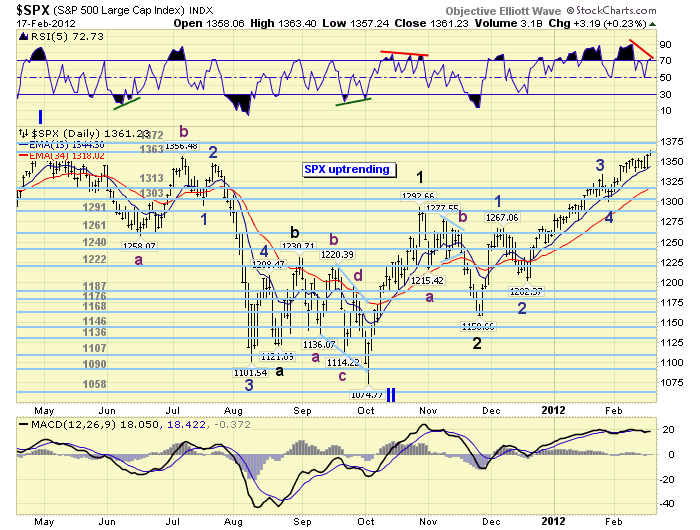
After the Minor wave 4 low at SPX 1300, we calculated some fibonacci relationships for the waves within this uptrend, and arrived with the following: at SPX 1367 Minor 5 = 0.618 Minor 1, at SPX 1381 Minor 5 = 0.618 Minor 3, at SPX 1408 Minor 5 = Minor 1 and 0.618 Minor waves 1 – 3, and at SPX 1432 Minor 5 = Minor 3. Also, this uptrend equals the Major wave 1 uptrend at SPX 1377. Since the three lower figures fell within our 1361, 1372 and 1386 pivot range we considered this zone to be significant resistance for this uptrend. Should the market clear it, then we would be looking at SPX 1408 and then the OEW 1440 pivot. However, we are seeing a negative divergence starting to unfold on the daily charts. This usually occurs as uptrend tops unfold.
SHORT TERM
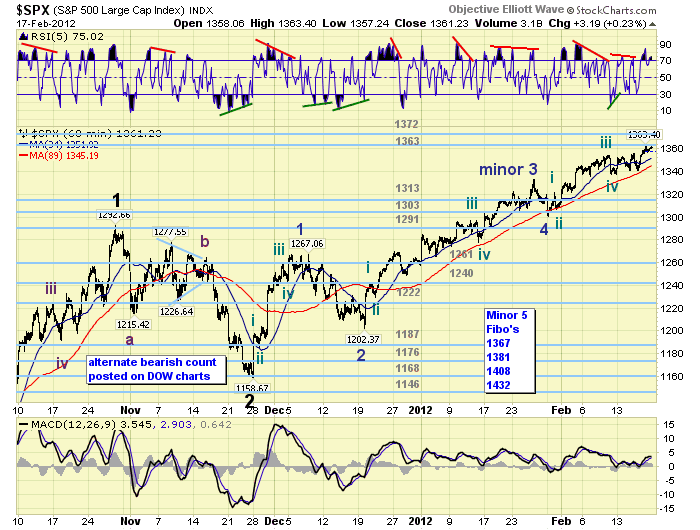
Our short term count displays the five Minor waves, with each rising Minor wave subdividing into five Minute waves. Notice Minor 1 had a short Minute i and v and an extended Minute iii. Then Minor 3 had only a short Minute i, and an extended Minute iii and v. Minor wave 5 appears to be acting like Minor 3 but on a smaller scale.
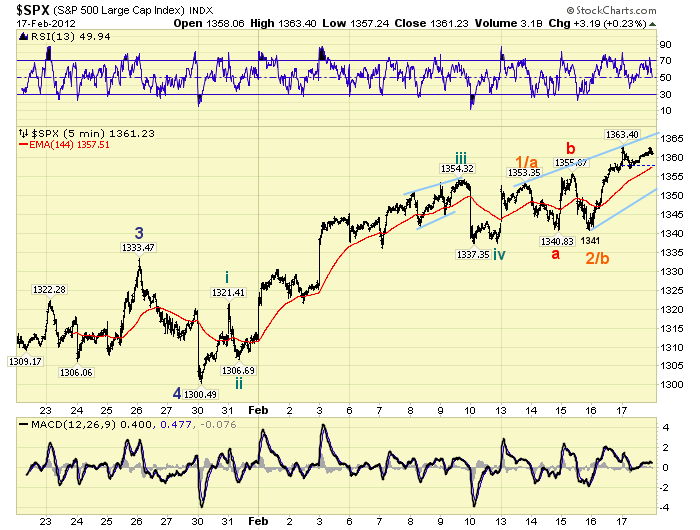
When we take a closer look at Minute wave v of Minor 5 we see two potentials. First, the market rallied from SPX 1337 to 1353 completing a Micro wave 1. Then pulled back in an irregular flat at SPX 1341 for Micro wave 2. And, now it is in Micro wave 3. Second, the SPX 1353 high was a wave A, the 1341 low a wave B, and the current rally wave C of an ongoing diagonal triangle. If this market continues to rally, then the diagonal scenario will be eliminated. However, if the market has a significant pullback into the low 1350′s, then rallies. The diagonal could end on the next new high. Early next week should gives us some indication of what is next.
FOREIGN MARKETS
The Asian markets were mostly higher gaining 1.9% on the week. All are uptrending.
The European markets were mostly higher gaining 1.2% on the week. All uptrending.
The Commodity equity group were all higher gaining 2.4%. All uptrending.
The DJ World index is uptrending and gained 1.5% for the week.
COMMODITIES
The Bond uptrend is beginning to weaken a bit as bonds lost 0.4% on the week.
Crude is uptrending again gaining 5.2% on the week.
Gold continues to consolidate in its uptrend gaining 0.1% on the week.
The USD is trying to reverse its downtrend, gaining 0.3% on the week.
NEXT WEEK
A holiday shortened week as monday is Presidents day. On wednesday Existing homes sales will be reported. Then on thursday, weekly Jobless claims and FHFA housing prices. Then on friday, Consumer sentiment and New home sales. The FED has nothing scheduled. Best to you and yours this extended weekend and week.