Sunday, July 21, 2013

Gold derivative distortions

by Alasdair Macleod

The purpose of this article is to explain how derivatives have distorted gold prices with particular reference to the US futures markets. This will enable us to anticipate the price effect when the distortion is eventually unwound.

When a derivative is created it diverts supply and demand from the underlying commodity. If it is then hedged into the underlying commodity the price effect is the same as if it was a simple commodity transaction. Enter the “honest speculator”, who is neither producer nor consumer, but seeks to profit by trading derivatives for profit, without an intention of taking delivery. The speculator who does not roll his positions into subsequent future contracts brings forward demand or supply only to reverse the price effect later in the life of the contract. In this case speculators provide liquidity with no lasting price distortions.

So far we have considered markets which are essentially free. In the US futures markets, this changed when banks were permitted to act as “commercials”, despite the fact they are in fact speculators in the original market definition. The nature of the futures market changed from this moment to one where speculative positions have become more or less permanent.

In the case of gold and silver the banks have absorbed physical demand by continually running net short positions. We cannot say that all of this demand would have existed without the banks’ intervention; however there is no doubt that the expansion of the overall market by the addition of permanent short positions has led to lower prices overall than would otherwise be the case.

If futures markets are not to distort prices on a prolonged basis three conditions must apply: every player must be motivated only by profit, the banks must commit only their own resources and no one else’s, and there must be periodic liquidation of speculative positions. Instead, there is little doubt that there is political intervention, the banks are too big to fail which allows them to commit funds they would not otherwise commit, and there has been no overall liquidation of speculative positions. The result is that banks have been able to manipulate prices, and pricing has become distorted, confirmed by emigration of gold away from derivative markets.

The third condition cited above needs further explanation. Since March speculative longs have been liquidated through stop-loss orders, leaving a core of longs inaccurately regarded as speculators. The banks have closed their short positions by encouraging new speculators to open short positions, so the speculators are all now on the short side. They don’t realise it yet, but the speculator shorts are the now only true speculators in the market. Therefore when they come to close their positions, there is no one to provide them the necessary market liquidity except on a completely different and higher price basis.

The net effect on the gold price so far has been to suppress it. Demand for physical has increased at lower prices as one would expect, leading to a physical liquidity crisis on US futures markets. At the same time a parallel liquidity crisis has developed on the London Bullion Market, evidenced by negative gold forward rates.

It has the makings of a perfect storm.

See the original article >>

Great Graphic: Equity Flows DM >EM

by Marc to Market

This Great Graphic was posted on Business Insider, which got it from Bank of America, which relied on data from EPFR Global. It shows the cumulative capital flows into developed and emerging market equities funds since 2002.

The flow story, as one would expect, jives with the performance story we previously highlighted.  That must be one of the ironic stories of the year--the decoupling of flows and performance is taking place and it is too the benefit of the developed markets.

This may be a bit of an exaggeration.  US and Japanese equity funds account for the overwhelming part of inflows into DM funds.  And, while there has been some outflows from EM funds, compared to what has accumulated since the crisis, it has been quite modest.

This may understate the case.  The funds are still thought to be primarily a retail investment vehicle.  The data, also, does not include direct equity purchases,  by important participants, such a pension funds, insurers, hedge funds, and, according to reports, increasingly central bank. 

Lastly, typically cross border portfolio flows are typically dominated by debt instruments.  It seems that it is that there has been a bigger liquidation of emerging market investments.  This, coupled with the adjustment of currency hedges and speculation may help explain the pressure on emerging market currencies.

See the original article >>

The Bang! Moment Shock

By John Mauldin

Future shock is the shattering stress and disorientation that we induce in individuals by subjecting them to too much change in too short a time.

– Alvin Toffler

What is it about humans that we fail to see a crisis in advance, yet when we look back, its likelihood or inevitability so often seems blindingly obvious? Rather than a flaw, our under-reliance on foresight as opposed to hindsight is perhaps a necessary evolutionary design feature that has allowed us to make rapid progress as a species (especially over the last few thousand years), but in a complex modern society it can really create quite the crisis for individuals. This week we resume our musings about Cyprus, to see what that tiny island can teach us about our own personal need to engage in ongoing critical analysis of our lives and investment portfolios. Cyprus is not Greece or France or Spain or Japan or the US or … (pick a country). I get that. No two situations are the same, but there may be a rhyme or two here that is instructive.

This Country Is Different

In 1974, Turkey invaded Cyprus. Eventually the island was divided into two zones, and Greeks in the Turkish zone, like Turks in the Greek zone, were forced to leave with only the clothes on their backs and little else. That was a defining moment for Cyprus, and the aftershock is still evident when you get past the normal polite conversation. Plus, the wall dividing the two countries is always there when you are in the capital city of Nicosia, although lately there are a few places where you can cross into the other zone. The first night I was in Nicosia, we ate dinner outside at a Greek taverna (what else?) that stands almost in the shadow of the wall.

One hundred years after the Civil War, the South of my childhood was still mixed up with the aftereffects of that war. The war in Cyprus was less than 40 years ago. Another evening we went to a local club where the members were Greeks who had been expelled from a particular neighborhood in the Turkish-occupied area. Many looked young enough that they could not have been alive during the war, but the memory of the "old neighborhood" was still strong among them.

These people lost homes and businesses, jobs – everything. They had to start over. (I am sure it was that way for the Turks who had to relocate as well.) But for the next 40 years there was very steady economic growth, 4% or so a year over time. The people took advantage of what they had. There was no university, so children went abroad to study and work and then came back, generally with skills. The legal and accounting professions grew particularly strong. Like two other former British island colonies, Singapore and Hong Kong, Cyprus became a financial center. Fifty double tax treaties later, the island had become a place to domicile companies, handle taxes and accounting, etc.

And then they branched out into banking. After the creation of the euro, the deposit base of Cypriot banks went through the roof, until it was up to six times the size of local GDP (depending on whom you believe – official sources make it closer to five times). By some measures, Cyprus had the second wealthiest population in Europe and certainly one of the best educated. Twenty-five percent of the world's ships were operated under the flag of Cyprus. Because the country had been a member of the nonaligned movement in the '80s (remember that?), it had good ties (and double tax treaties) with Eastern Europe and the USSR. Some of the kids went to university in Russia and developed contacts there. After the collapse of the Soviet Union, it was natural for Russians to use Cyprus as a conduit to the West.

Cyprus has, by some accounts, the best beaches in the Mediterranean, and so more and more people came and built vacation homes. They brought their money with them and deposited it in the local banks and took out loans to build their homes. Real estate prices climbed and climbed. Below are Cypriot bank deposits and loans from 2009 through April of this year (data from the central bank).

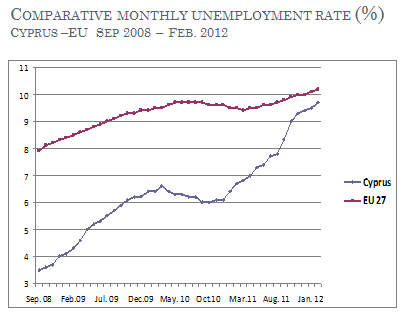
Unemployment was quite low, less than 4% in 2008, although the global credit crisis led to a gradual rise (though nothing like that seen in the rest of Europe). Much of the new unemployment was in the construction industry, which fell into a slump along with the rest of Europe during the crisis.

Banking soon became the biggest industry. There were more banking branches per capita in Cyprus than anywhere else in the world, more than double the European average. And there were over 40% more employees per branch than in the average eurozone country. Money was easy to get, so debt exploded by over 50% in both businesses and households in just six years, from 2005–2011.

The country had always run a current account deficit, but by 2008 that deficit had topped 15%, keeping pace with Greece's and Portugal's. However, earnings and productivity had more than kept up. Cypriots worked hard and offered good value for their services. They saw themselves as different from the other Southern European countries. But, as in much of the rest of Europe, public-sector employment doubled from 1990, with the second-highest government wage bill (behind Denmark's) and a monstrous 50% growth in social benefits in the last 10 years.

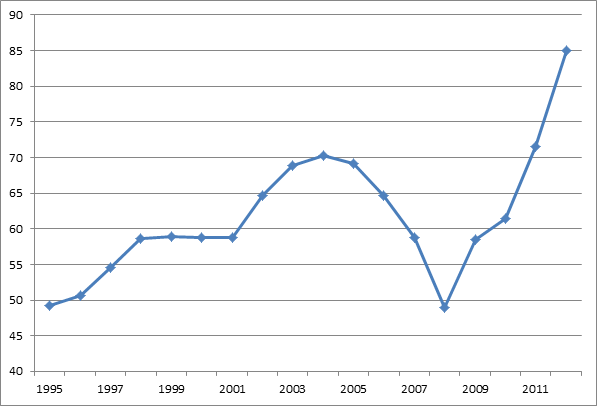
Still, starting in 2003, public debt-to-GDP actually fell. Why ring the alarm bell when things are getting better?

Cyprus: Public sector debt as % GDP 1995-2012

There were in fact no alarms bells ringing as 2012 opened. But there should have been. Cypriot banks were flush with cash. They bought foreign banks in Greece and Russia. They made ever more loans and then looked around and decided that Greek sovereign debt was something they needed more of. And then came the Greek sovereign debt crisis, and the capital base of the Cypriot banks was essentially wiped out. But the ECB and the EU had bailed out Irish and Spanish banks; and so depositors in Cyprus, many of them Russian, decided, along with the local citizens, to leave their money in the banks.

The country had been under the parliamentary control of the Communist Party since 2008. Seriously. Supported by the Orthodox Church. (Note that public debt began its serious rise after the communists came to power). No one reined in the banks, and they grew ever fatter and more exposed until the crisis hit. Then Cyprus could no longer fund its debt and needed EU help. Further, the Central Bank of Cyprus (not to be confused with the commercial Bank of Cyprus) had to make emergency liquidity loans to Cypriot banks that had to meet demands for withdrawals and could no longer raise capital. There was not a bank run, but there was a fast-paced walk.

The ECB balked, as the quality of the collateral offered did not come close to the standards of the Emergency Lending Assistance (ELA) program. The government of Cyprus needed money to fund its basic needs as well as to "roll over" its debt as it came due. The EU basically declined to negotiate, as there was a Cypriot election scheduled for late February, and the EU preferred to wait to see the results before acting. There was talk of a "bail-in" (where depositors would shoulder some of the loss), but as usual that proposal came from the Germans, and the rest of Europe would surely not agree.

The new president assumed office and saw immediately that the country was in trouble. He tapped Michael Sarris, a "technocrat," to be his finance minister. Sarris was the man who had helped bring Cyprus into the euro and who oversaw the reduction in Cypriot debt. While he was not a member of the winning political party, he had been at the World Bank and had relationships with many of the finance heads of Europe.

Sarris went to Brussels, only to find no friends of Cyprus there. The Germans privately told him they would approve no bailout of Russian depositors (rumored to account for over half of the base of some of the banks) prior to the German elections this fall. Cyprus was seen as a money haven and a place for rather loose tax accounting. I have to admit that many of the Cypriots I talked to knew that money laundering was going on. It was a very open secret. Cyprus had very strict rules, but it seems there were ways to engineer exceptions.

In the end, Cyprus makes no difference – that was the perception in Europe, and while they were just talking a few billion euros here and there, a fraction of what Ireland or Spain needed, there was just no sympathy for Cyprus. Many of the European finance ministers wanted to establish the questionable principle that bank deposits were no longer sacrosanct, and Cyprus was just not seen as a systemic risk. The best deal Sarris could get was a 6.75% "tax" on deposits of less than €100,000 and 9.9% above that, with the aim of raising €5.8 billion. That was on a weekend, and by Monday, when Sarris returned, the indignation in Cyprus had grown to the point that not one politician voted to accept the deal.

A bank holiday was declared and Laiki Bank was put into receivership and closed as a "bad bank," but within a week the EU decided to insure all deposits up to €100,000, the number that "everyone" had understood to be the safe deposit amount. The banks eventually reopened, but Cyprus placed capital controls on deposits and limited withdrawals. A euro in a Cypriot bank was no longer the same as a euro in an Irish bank.

The Economist wrote shortly thereafter:

"The Cypriot deal has no coherence in the larger context. The euro crisis has been in abeyance for a few months, thanks largely to the readiness of the European Central Bank to intervene to help struggling countries. The ECB's price for helping countries is to insist they go into a bail-out programme. The political price of going into a programme has just gone up, so the ECB's safety net looks a little thinner. The bail-out appears to move Europe further away from the institutional reforms that are needed to resolve the crisis once and for all. Rather than using the European Stability Mechanism to recapitalise banks, and thereby weaken the link between banks and their governments, the euro zone continues to equate bank bail-outs with sovereign bail-outs. As for debt mutualisation, after imposing losses on local depositors, the price of support from the rest of Europe is arguably costlier now than it ever has been."

Since then, the crisis has deepened. Deposits of over €100,000 in Laiki Bank, which was the second largest bank in Cyprus, have been completely wiped out. The bad debts of Laiki Bank were forced into the Bank of Cyprus, saddling their depositor base with approximately 60% losses.

If you had a business with over €100,000 deposited in Cyprus, you are likely out of business. Many businesses that were going concerns on March 14, 2013, when the crisis fully erupted, were out of business a few days later. All the employees lost their jobs and their benefits. Unemployment will soon reach 20%. For now, all of the branch banks are open, but at least half will soon be shut.

On an ironic note, the EU resisted any talk of Russian banks coming in to take over the failed Cypriot banks. Now it looks as if Russian citizens may own over 50% of whatever is left of the Bank of Cyprus.

The Bang! Moment Shock

Cypriots are deeply shocked by these events. From "insiders" who sat on boards to politicians and ordinary citizens, no one can believe that the EU treated them the way they did. I was asked time and again, "How could this happen?" and not just by ordinary citizens.

I talked with one lady who had just retired from the Bank of Cyprus. She had 100% of her pension and life savings at the bank and now faces losses of up to 60%. She had no idea the crisis was coming. Interestingly, she and others I spoke to insisted that the Bank of Cyprus was a good bank. But when asked if she would redeposit her money in a Cypriot bank when (if) she ever gets it out, she shook her head no. The trust in the system is gone.

I talked with Symeon Matsis, a man in his early 70s who was at one time in charge of planning at the Ministry of Finance. He carried a copy of This Time Is Different by Rogoff and Reinhart. It was dog-eared and full of notes. "I am reading it so I can try to understand what happened to us. The more I read the more I understand that they were describing Cyprus. And we did think that 'This country is different.' Which is why the crisis has been such a shock to our local culture."

The Cypriots believed not just that their country was different but also that the stability they had seen for 40 years was normal and easy to achieve. Why would it end? They were just doing their jobs, and everything seemed OK … until it wasn't.

Humans are hardwired to be optimists. Keeping our chins up is the only way we can keep working today and have hope for the future. If we lose that optimism, what Keynes called our "animal spirits," then why should we take risks? And the growth of free markets and capitalism over the last 500 years is nothing if not the growth in our ability to tame risk, through institutions such as insurance companies and corporations and mechanisms such as securitization and pensions. (I highly recommend the masterful book, Against the Gods: The Remarkable Story of Risk, by the late and sorely missed Peter Bernstein. This is on my list of must-read books for everyone who asks.)

But with all the controls we have created, we still have not reduced risk to nothing. And the biggest risk is that created by our own politicians and institutions – by those we trust to somehow protect us from risk.

We write laws to protect us from politicians and government, limiting the power of the state to encroach on our lives. The citizens of Cyprus thought they had rules protecting them, too, but at the end of the day, there were no rules.

The central bankers and finance ministers of Europe are making the rules up as they go along. The monstrously long EU treaties and other eurozone agreements are wide open to bureaucratic interpretation.

If you live in the EU, you now must understand that the central risk to your financial well-being is the very governments you have asked to protect you from that risk. Many of those governments have made promises they cannot keep. I wrote a few weeks ago about the problems in France. I heard from some French readers who disagreed with me. The gist of their arguments boiled down to "we are different."

I agree that France is different in the sense that France will find some uniquely French way to deal with its crisis of too much debt and leverage, a government that is too large, and a system that is sclerotic. But whatever that is, it won't save France. French citizens and their politicians feel that their pensions, investments, and lifestyles are safe. Yes, things may have to change, they say, but not in any fundamental sort of way. They feel pretty much like the citizens of Cyprus did until March.

The word catastrophe is the same in English and French. And at some time in the future, lacking serious reform, a catastrophe is what France is facing. The same is true of dozens of countries in the "developed" world.

We love to tell ourselves that this time is different. But outcomes among countries with debt and deficits out of control, constrained by a limited ability to grow their way out of their problems, are unmistakably similar. Each country has its own reasons for thinking it is different, and right up until the end it goes on telling itself that it is. And then people are shocked when one day they wake up to a very different reality.

Michael Sarris did not come back empty-handed. He came back with billions of euros from the EU and the ECB. It just wasn't enough to keep things the way they were. The same plotline is repeated in Greece, Spain, and the rest of peripheral Europe.

Europe is making up the rules to deal with its crisis. Do you remember my writing about the very creative way the Irish dealt with their debt? Where was that in the rules? When the next phase of the crisis hits, the Europeans will make up more new rules. And that near certainty poses a serious risk for Europe.

Of course, we in the US are different. We have the rule of law. That's what we all learn in school and what we keep telling ourselves, anyhow. Well, except that we find the President now wants not to have to deal with a law he helped pass, and so some third assistant at Treasury was appointed to mention as everyone went home for the holiday weekend that parts of the Affordable Care Act will be postponed without consulting with Congress, which is supposed to be involved in the whole law thing.

It's not just this president; it's everywhere. We have wandered far down the path from the rule of law to rule by lawyers. We have a Congress that refuses to deal with our deficit crisis in any manner. We have a central bank that is afraid to let the stock market learn to cope without easy money and financial repression, thereby making the bankers and finance world rich but hurting the average citizen. Indeed, low rates are killing those who worked and saved all their lives and now need to receive at least modest returns on their savings just to live.

My suggestion is that you pay attention to what is going on around you. If things are out of balance, do what you can to not get caught in the problem. It is almost never, ever different this time. You do not want to experience your own personal Bang! moment.

Newport, NYC, Maine, and Montana

After being seriously sick for 12 days, I am finally almost back to normal today; and I may even try to get to the gym tomorrow, although I may just touch the weights rather than actually lift them. Next Sunday I go to Newport, Rhode Island, for a week of intense involvment with a planning meeting of the Office of Net Assessment of the US Defense Department. A small group of us are tasked with developing a document that offers alternative scenarios for how things may work out in the future. It is quite the serious group, and I am honored to be invited. The sessions run all day and often into the evenings. It is a very eclectic group from a dozen disciplines, and I learn a great deal more than I impart.

Then I will stay in NYC (or somewhere up there) for a few days before going to Maine for the annual Shadow Fed Fishing Trip. That is always a good time with old friends. This year Bloomberg will cover the weekend with live broadcasts and interviews.

I will then return to Texas, and other than a trip to Montana to spend some vacation time on a lake with my friend and partner Darrell Cain, I really think I will stay in Texas, even through August. Home is just feeling very good after the last 12 months of almost constant travel. And while there are a few trips in the fall, the schedule seems oddly light, which is fine. I am sure things will come up. And I notice that WorldCon, the international science fiction and fantasy book conference, comes to San Antonio around Labor Day this year. I have always liked the Riverwalk. Might be a time to visit.

See the original article >>

France’s Midsummer Night’s Dream

by Dominique Moisi

PARIS – Bastille Day, the French national holiday, was glorious this year. The military parade, dominated by the celebration of “victory” in Mali and the joint participation of African and United Nations troops, had the perfection of a gracious, albeit muscular, ballet.

This illustration is by Margaret Scott and comes from <a href="http://www.newsart.com">NewsArt.com</a>, and is the property of the NewsArt organization and of its artist. Reproducing this image is a violation of copyright law.

Illustration by Margaret Scott

The classical concert that preceded the magisterial fireworks that ended the day was the closest thing to a French version of the Proms in London, mixing light classical and popular songs. The Eiffel Tower imbued the evening with its magic. Paris, in case anyone had any lingering doubts, remains the capital of the world – or so it seemed for a night.

The melancholia that began to seize France many years ago was all but forgotten. The celebration of the glory of the past, mixed with popular English songs of the present, seemed to indicate renewed national confidence. What was the meaning of this moment of grace? Was it purely the product of a collective delusion, an emotional Potemkin village of sorts, encouraged, if not conceived, by the authorities to restore some level of self-assurance among France’s depressed citizens?

Even if the positive emotions remain only fleeting (as seems most likely), they were real and palpable. The French seemed to be in the mood to celebrate. Of course, it could simply have been the weather; a gorgeous summer has finally settled in after a miserable spring.

But it might also have been one of those natural turning points, a collective and spontaneous decision to say: “Enough of depression, let’s move on.” We French may not be what we used to be, the celebrants seemed to be saying, but we are still much more than people think we are. We have a great revolutionary past that still conveys universal values – liberty, equality, fraternity – and an army that, as in Mali, continues to make a difference in the world.

One can draw two lessons from this collective form of escapism. The first is that, beyond the many layers of depression and distrust in France, there is potential for a new and collective departure. This would require, of course, less cynical political elites who can transcend their petty ambitions and divisions for the sake of the country.

The second lesson, even more obvious, is that reality cannot be changed with a simple public spectacle. France is not Imperial Rome, where panem et circenses made a fundamental difference. It is a weakened democracy mired in an economic and social crisis so deep that it verges on becoming an identity crisis.

The proof was provided by a third traditional event on Bastille Day, between the morning’s military parade and the evening’s music and fireworks: President François Hollande’s speech to the nation, which took the form of an interview with two prominent journalists. He, too, was in a reassuring mood.

According to Hollande, the economic upturn – la reprise – had just started, and hope was around the corner. His tone and message had changed. He was no longer the “normal man” of his election campaign and tenure until now; instead, he tried to present himself, like his predecessor, Nicolas Sarkozy, as a superhero.

Of course, given his personality and low public-approval ratings, his address was the least convincing event of the day. Who could have said with certainty that the economic upturn announced by Hollande was real rather than aspirational? Beyond his message’s wishful thinking, the public’s reaction to the messenger was a mixture of disbelief and indifference.

Seeing the behavior of friends, all French, listening with me to Hollande, I was reminded of another moment. It was December 31, 1989, and I was in the Soviet Union. I had found myself in a restaurant in the old city of Suzdal, listening to President Mikhail Gorbachev’s “New Year wishes.”

I was moved: The man who symbolized glasnost and perestroika, who had allowed the peaceful emancipation of most of Eastern and Central Europe, was speaking. But I was alone in paying attention to him. The restaurant’s customers, like my French friends now, could not have cared less. Their president had become background noise.

Has Hollande become, in this sense, a French Gorbachev? For the left and the Greens, he is close to being a traitor. These voters chose him a year ago not only because he was not Sarkozy, but because he incarnated the values of the true left, even if his centrist moderation seemed a bad omen. Voters of the center or even the center-right are disappointed, too, by their president’s lack of charisma, if not sheer incompetence.

After a year of Hollande, France is witnessing a fundamental political revolution. During the half-century of the Fifth Republic, a bipartisan system of left and right has traditionally prevailed. But now France is becoming a country dominated by a “tripartite system” of more or less equal strength: the left, the right, and the extreme right.

If France wants to capitalize on the positive emotions of Bastille Day, it needs much more responsible elites, ready to unite in the fight against unemployment and its causes (lack of competitiveness and labor-market rigidity) and consequences (the rise of populist, non-republican forces). What Bastille Day revealed, even briefly and superficially, is that the potential to unite France exists. But doing so requires more than shallow promises.

See the original article >>

The Crash Of 1929

by Tyler Durden

Based on eight years of continued prosperity, presidents and economists alike confidently predicted that America would soon enter a time when there would be no more poverty, no more depressions - a "New Era" when everyone could be rich. Then 1929 began - a time when the stock market epitomized the false promise of permanent prosperity... it's only when we learn the lessons of the past can we avoid the mistakes of the future - or this time it's really different.

Congress: "Is it fair to say that Wall Street has benefited more [from QE] than Main Street has?"

Bernanke: "I don't think so... I want to emphasize that we're very focused on Main Street... Our low interest rates have created a lot of ability to buy automobiles..."

"The United States is afflicted with 'New Eras'"

See the original article >>

Now That Detroit’s Gone Bust, Is Your City Next?

by ffwiley

detroit1

Detroit’s bankruptcy filing is one depressing read. Poverty, crime, blight – you name the malady and there’s plenty of data to back it up. And unfortunately, Detroit’s not alone. You may be wondering which city hits the wall next.

I’m not making predictions, but I’ve looked at one indicator that may offer some clues: population loss.

As any good Ponzi Schemer will tell you, your future looks much better when there are more people moving in than moving out. Once the population change turns negative, a vicious circle can take hold, and that’s exactly what we saw in Detroit.

In addition to spending excesses and mismanagement, the city’s financial problems stem from the challenges of downsizing infrastructure as quickly as the tax base contracts. Here are a few lowlights from the bankruptcy declaration:

  • The average cost to demolish an abandoned building – of which Detroit has about 78,000, or 20% of the housing stock – is approximately $8500.
  • Of about 11,000 to 12,000 fires each year, approximately 60% occur in abandoned buildings.
  • The city closed 210 parks in fiscal year 2009 and recently announced that 50 of the remaining 107 parks were slated for closure.
  • The city’s Public Lighting Department is able to keep only about 60% of the approximately 88,000 street lamps in operation.
  • The Detroit courts’ case clearance rates have been running at only 18.6% for violent crimes and 8.7% for all crimes.
  • Only 10 to 14 of the city’s 36 ambulances were in service in the first quarter of 2013.

And now for a look at other cities that are battling severe population loss. Here are the top 15, ranked by the decline from each city’s population peak, according to the decennial U.S. census:

detroit2

And here are the top 15 ranked by the percentage decline (for this list, I required a population of at least 125,000 in or before 1960):

detroit3

Nine cities have the dubious distinction of making both “top 15” lists. For these cities, I’ve added charts showing population histories using all of the data I could find. There’s one chart each for the Midwest, Northeast and South (and if you’re looking for St. Louis, I went with the last Missouri accent that I’ve heard – definitely a drawl):

detroit4

detroit5

detroit6

The rate of population decline in most of these cities was at least slower from 1980 to 2010 than it was from 1950 to 1980 (Detroit was one of the exceptions). Nonetheless, they’ll need to manage the exodus more carefully than Detroit did to avoid the same fate.

Other links

Here are links to a few interesting Motor City photo galleries, from Time, Zero Hedge (via the NY Daily News) and the BBC (where I sourced the photo above).

See the original article >>

On My Enthusiasm For Solar Energy

by Aziz

I am a solar energy enthusiast. The energetic parts of the universe are clustered around stars. We sit here on this dusty ball of rock and water, heated continually by the Sun. The difference between when we face toward our local star and when we face away from it is — in the most literal sense — day and night. Our lives on Earth are already solar-powered; the plants (and plant-eating animals) we eat get their energy from photosynthesis. The trees and other biomass we have used for energy for much of our history, as well as the fossil fuel reserves we use today are forms of stored solar energy from earlier organisms that died and were trapped under the Earth. Wind energy and tidal energy are perturbations of dynamical systems heated by solar energy. Even the nuclear energy we use extracted from fissionable uranium and plutonium is stored from supernovae in early stars that exploded and pushed the complex elements — including the carbon, nitrogen and oxygen in our bodies — out across the universe.

It is not so much a question of whether we use solar energy, but whether we use direct solar energy, or some derivative form. As our civilisation has advanced and grown, we have had to tap into larger sources to meet the demand for cheap and easily-accessible energy. Our technological sophistication and understanding of basic physics and chemistry has had to grow with our energy hunger to take advantage of different forms of energy; windmills, steam engines, oil refineries, cold water reactors and photovoltaic panels, and so on. In the long run, it is a mathematical certainty that to sustain our civilisation at present levels, or to grow and increase energy consumption we must transition to renewable energy both because quantities of fossil fuels and star fuels like uranium and plutonium on Earth are finite.

The availability of direct solar energy on Earth dwarfs other energy sources, including renewable energy:

planetary-energy-graphic-energy-resources-renewables-fossil-fuel-uranium-e1331370752412

All that is necessary in the long run for renewable energy sustainability is that the level of output exceeds the level of input enough to provide a reliable energy source. Even at current solar efficiencies — and thus assuming that the technology won’t improve — photovoltaic solar generates seven times more energy than it takes to generate:

2000px-eroi_-_ratio_of_energy_returned_on_energy_invested_-_usa-modified

While this is not currently as good as oil or natural gas or coal, it already beats shale oil and biofuels. The beautiful thing about solar energy is that there is so much of it that the technology does not have to be greatly efficient. And prices are falling and efficiencies are improving. While some renewables like wind and hydroelectric are more efficient, they are not abundant enough to even cover the bulk of our energy needs today. In the short run, combined with hydroelectric and wind and nuclear there is a real basis for long-term renewable energy sustainability. To smooth the transition, renewable technology needs investment and development.

In the long run, while obviously renewables still cost a lot more than non-renewables in the marketplace, but we have already established that that cannot last forever. Even the supply of uranium is limited. While we may discover superior technologies like cold fusion, we should be completely prepared for the eventuality that we don’t discover a better technology. While photovoltaic solar remains the largest and most long-term source of available energy — and thus the best hope for the continuation and expansion of sustainable human civilisation — it should receive a bulk of funding and development, and we should assume that in the very long run it should meet the bulk of our energy needs. There are still challenges like solar energy storage, but these challenges are being surmounted with improved battery technologies, and improved distribution technologies such as microgrids.

Of course, if the photovoltaic solar price trend known as the Swanson Effect that has seen solar fall over 99% in cost since the 1970s continues, then solar will reach and exceed parity with other energy sources and be crowned the winner by the market based simply on  low cost. After all, solar energy is superabundant compared to the alternatives, so it would not be at all surprising for it to become the cheapest. But even if the Swanson Effect does not play out and solar does not become super-cheap, direct photovoltaic solar is extremely likely to play a major role in continued human civilisation on this planet and elsewhere.

See the original article >>

Ban Goldman Sachs from Playing in Commodity Markets

By EconMatters

Federal Reserve Review

On Friday Reuters reported that the Federal Reserve is going to review the 2003 decision that allowed regulated banks to trade in physical commodity markets: “The one-sentence statement suggests the Fed is taking a much deeper, wide-ranging look at how banks operate in commodity markets than previously believed, amid intensifying scrutiny of everything from electricity trading to metals warehouses.” Reuters goes on to say, “While the Fed has been debating for years whether to allow banks including Morgan Stanley (MS.N) and JPMorgan (JPM.N) to continue owning assets like oil storage tanks or power plants, Friday's surprise statement suggests it is also reconsidering whether all bank holding firms should be able to trade raw materials such as gasoline tankers and coffee beans.”

Big Banks & Unintended Consequences of Fed Policy

The Fed is finally getting that the Big Banks are canceling out any intended good that may accrue to wealth creation by pushing up stock prices, if at the same time these same financial institutions also push up commodities like oil, gasoline, copper, heating oil, wheat, corn, and soybeans with the same cheap QE stimulus money.

The fed is trying to weed out some of the unintended consequences of their QE stimulus program. Because on one hand they are trying to stimulate the “Wealth Effect” with higher stock prices, but these bankers have so much cheap capital available to them, and with the fed mandate to boost asset prices, they cannot help but juice up commodities at the same time.

This leads to adding a huge tax drag on small business, consumers and the overall economy with commodity prices trading well above the fundamentals of a sluggish global economy, and a domestic US economy treading water at an anemic 1.8%.

The fed is finally realizing that they should be getting much more bang from their monetary stimulus efforts, and the added economic costs of over-inflated commodity prices just negates any positives of their stimulus programs.

Where have the Regulators been?

But it is a shame that it takes the Fed to finally clamp down on the banks in this area as regulators should have banned these firms for trading commodities after the oil run-up of 2007 when banks pushed oil to $150 a barrel.

The patterns of banks manipulating markets are so numerous and widespread in financial market history that there is no way regulators should have let them anywhere near economic sensitive staples for consumers like Wheat, Soybeans, Oil and Gasoline. Furthermore, if the regulators did any investigating at all they would find much more abusive market manipulation practices than Libor Rate Rigging.

Is there a market the Big Banks haven`t tried to Manipulate?

Name me one market these banks haven`t tried to manipulate or Rig? Whether it is the recent settlements or future settlements in the Power Industry or the many manipulative practices discussed regarding “Metals Warehousing” to outright manipulation of key commodities by artificially taking supply off the market which has happened many times in the history of the oil markets.

The point is these firms cannot be trusted, their past behavior in anything market related from CDS, MBS to levering up their balance sheets by 40 to 1 ratios, should serve as a warning to any critical regulative body that it is a bad idea to let them “play” around in any essential commodity that consumers rely on for daily living purposes.

Congress initiated the Fed Review

It is about time that Congress started doing their jobs and initiated this inquiry by the Federal Reserve. The bigger question is why did it take 5 years after the financial crisis to realize these banks are bad market participants?

The Oil Market is the most Manipulated Market in the World

Just look at Oil prices above $80 a barrel when the Global economy was in a full blown recession. You actually think Oil prices were there because of the fundamentals of supply and demand in the market? Please, the United States was importing 5 Billion barrels of oil a year in 2006, and now we are importing 3 and a half Billion barrels of oil in 2013, and prices are 40% higher with China`s economy at stall speed?

Banning the Banks brings back the Fundamentals into the Oil Market

This is an amazing reduction in imports of 1.5 Billion and prices are 40% higher with increased Global production. Consumers, Regulators, and Businesses have no clue how Big Banks have totally changed the pricing of everyday commodities like Oil and Gasoline once they started trading these markets electronically, and utilizing their other manipulative strategies to game these markets!

40 to 1 Leverage is never good for Markets

Excuse my French here, but Get these “Regulated” Banks out of Essential Commodities, and never let them back in! It is about Freaking Time, and it really took ‘Regulators’ that long to realize that banks trading gasoline was never going to be good for consumers and the economy? Where do you think that 40 to 1 leverage goes? The recent 20% gain in gasoline prices in a month in an over-supplied market is where that leverage goes!

See the original article >>

Weighing the Week Ahead: It’s All about Earnings

by Jeff Miller

In last week's prediction for the week ahead my streak I guessed that the main theme would be whether we had dodged the bullet on the matter of a correction. This proved to be pretty accurate, despite news about China, the Bernanke testimony, and some big earnings numbers.

This week we have very little economic data and the Fed members are finally taking some time off from the speech circuit. It is one of the two biggest weeks of the earnings season, so I expect that earnings will be the key focus.

Here are some perspectives to consider.

  • The Storytellers -- who can be of either the bullish or the bearish persuasion. The bears have emphasized the big misses in technology stocks. The bulls can point to strong reports from banks and health care companies. Anecdotal evidence is the raw material of confirmation bias, so watch out!
  • The Data-driven – who analyze all of the results. The story so far is that companies continue to beat expectations on earnings while missing on revenues. This is turning into a multi-year story. As we always do during earnings season, we pay special attention to the updates from the Bespoke Investment Group.

Epsrevq2

  • The Practical Forecasters. This group insists on looking beyond current revenue and earnings, emphasizing the outlook for company prospects. Nearly everyone following the earnings conference calls does this, but doing it for the market as a whole is almost a secret weapon. There is an excellent resource for looking beyond the current earnings reports, as I explain here.

I have some thoughts on the earnings season including a half-baked idea that I have never revealed before. I'll explain more in the conclusion.  First, let us do our regular update of last week's news and data.

Background on "Weighing the Week Ahead"
There are many good lists of upcoming events.  One source I regularly follow is the weekly calendar from Investing.com. For best results you need to select the date range from the calendar displayed on the site. You will be rewarded with a comprehensive list of data and events from all over the world. It takes a little practice, but it is worth it.

In contrast, I highlight a smaller group of events.  My theme is an expert guess about what we will be watching on TV and reading in the mainstream media.  It is a focus on what I think is important for my trading and client portfolios. Each week I consider the upcoming calendar and the current market, predicting the main theme we should expect. This step is an important part of my trading preparation and planning. It takes more hours than you can imagine.

My record is pretty good. If you review the list of titles it looks like a history of market concerns. Wrong! The thing to note is that I highlighted each topic the week before it grabbed the attention. I find it useful to reflect on the key theme for the week ahead, and I hope you will as well.

This is unlike my other articles at "A Dash" where I develop a focused, logical argument with supporting data on a single theme. Here I am simply sharing my conclusions. Sometimes these are topics that I have already written about, and others are on my agenda. I am putting the news in context.
Readers often disagree with my conclusions. Do not be bashful. Join in and comment about what we should expect in the days ahead. This weekly piece emphasizes my opinions about what is really important and how to put the news in context. I have had great success with my approach, but feel free to disagree. That is what makes a market!

Last Week's Data

Each week I break down events into good and bad. Often there is "ugly" and on rare occasion something really good. My working definition of "good" has two components:

  1. The news is market-friendly. Our personal policy preferences are not relevant for this test. And especially -- no politics.
  2. It is better than expectations.

The Good

This was a modicum of good news on the economic front.

  • Moody's upgraded the U.S. debt outlook from negative to stable. Is this really good news? Please note below the impact of government spending on the economy. Who elected these guys to a position that would influence public policy decisions?
  • The European story is better – more revenue, lower recession odds, and less threat to the world economy and US earnings. This is the story from Barron's. (Contrary view from Rebecca Wilder – and nice to see her writing again).
  • High yield spreads are narrowing again. Bespoke provides analysis and the great charts you expect, including this one:

High Yield Spreads 2013 071913

  • Initial jobless claims moved lower, back into the recent range. This is an important indicator but difficult to interpret on a weekly basis. Seasonal adjustments are difficult for such a short time frame, especially when you get into the "retooling" season for auto companies. Scott Grannis has an alternative look that emphasizes the unadjusted data. It is easy to see the general level of improvement.

Screen Shot 2013-07-18 at 8.24.35 AM

The Bad

There was a little bad news.  Feel free to add in the comments anything you think I missed!

  • The CPI headline number was higher than expected. This subject is a huge source of misunderstanding on the part of the average investor. The magnitude of the difference is best understood if you realize that the Fed sees inflation as too low. Their preferred measure is currently showing a lower rate than the CPI. (See Dr. Ed for more). Explaining this is beyond the scope of my weekly article, but those who are interested in predicting Fed behavior should be paying attention. Doug Short has a nice continuing series on inflation which is also well worth reading.
  • Gasoline prices are higher, influencing the CPI. The Bonddad Blog points to both higher oil and gas prices, asking "Why?" I think that it is a narrowing of the WTI/Brent spread, as noted by Bespoke (and various other sources). If this explanation is correct, we can expect gas prices to reflect fundamental changes in future months.
  • Sentiment remains bullish. Bespoke notes that this contrarian indicator remains elevated after a "trivial" decline.

AAII Bullish Sentiment 071813

  • GDP estimates are falling. Menzie Chinn at Econbrowser mentions the sequester and the increase in payroll taxes as causes. He also cites several other authoritative sources. Doug Short discusses the forecasts and shows the entire range of the WSJ economic panel in this chart:

Dshort economic forecasts

  • A technical signal from the High Low Logic Index is a warning of another 2007 (via Mark Hulbert). This approach is an element of and inspiration for the Hindenburg Omen, but does not seem to have so many false positive signals. On the other hand (via Mark Hulbert) none of the market timers he follows generate any edge on a long-term basis.
  • Leading economic indicators were unchanged. This was below expectations so I am scoring it as "bad." Steven Hansen at Global Economic Intersection always has an interesting take, often by looking at the long term and avoiding seasonal adjustments. His analysis and charts help to put this report in perspective.
  • Housing starts were very weak – much worse than expected. Calculated Risk keeps this in perspective by considering the multi-family effect and also building permits. Bill McBride is the go-to source on this subject, so I have special interest in his conclusion:   "Starts are moving up and completions are following.  Usually single family starts bounce back quickly after a recession, but not this time because of the large overhang of existing housing units." I continue to watch this very carefully. 

The Ugly

The Motor City. Matthew Dolan of the WSJ has a good story loaded with facts on the largest municipal bankruptcy. $18 billion in liabilities….

The Bond Buyer covers the implications ("ominous") for the muni market.

And what assets must be sold? Museum holdings? This car (original Mustang)?

550x412xIMG_0682-550x412.jpg.pagespeed.ic.Dvwv6I_LbJ

Appreciation

My main reason for writing is pretty simple: I have an impulse to share a message that I hope some will find helpful. I did this for many years, partly as a way of communicating with clients. At some point, I started to get some inquiries from potential new clients. Many said that I was so low-key that they did not understand that I had investment services available! I have a good team, but not a special marketing departmentJ

  1. I appreciate those who send an email with some kind words, or who make an encouraging comment. It lets me know that I am helping and offsets some of the "Miller, you idiot!" messages I get.
  2. I appreciate those who consider our services, whether they choose us or not.
  3. Thanks to Brian Gilmartin for his kind words on his excellent blog, Fundamentalis. He gives me too much credit merely for encouraging his efforts. He has a powerful, profitable message and a strong desire to share it. He is a natural writer.
  4. And thanks also to Insider Monkey for including "A Dash" among the top 100 finance blogs. This is a real surprise. There is a formula for popularity and my relatively infrequent and skeptical long posts do not fit the bill. We are only at #89, but that leaves room for improvement.

The Indicator Snapshot

It is important to keep the current news in perspective. I am always searching for the best indicators for our weekly snapshot. I make changes when the evidence warrants. At the moment, my weekly snapshot includes these important summary indicators:

  • For financial risk, the St. Louis Financial Stress Index.
  • An updated analysis of recession probability from key sources.
  • For market trends, the key measures from our "Felix" ETF model.

Financial Risk

The SLFSI reports with a one-week lag. This means that the reported values do not include last week's market action. The SLFSI has recently edged a bit higher, reflecting increased market volatility. It remains at historically low levels, well out of the trigger range of my pre-determined risk alarm. This is an excellent tool for managing risk objectively, and it has suggested the need for more caution. Before implementing this indicator our team did extensive research, discovering a "warning range" that deserves respect. We identified a reading of 1.1 or higher as a place to consider reducing positions.

The SLFSI is not a market-timing tool, since it does not attempt to predict how people will interpret events.  It uses data, mostly from credit markets, to reach an objective risk assessment.  The biggest profits come from going all-in when risk is high on this indicator, but so do the biggest losses.

Recession Odds

I feature the C-Score, a weekly interpretation of the best recession indicator I found, Bob Dieli's "aggregate spread."  I have now added a series of videos, where Dr. Dieli explains the rationale for his indicator and how it applied in each recession since the 50's.  I have organized this so that you can pick a particular recession and see the discussion for that case.  Those who are skeptics about the method should start by reviewing the video for that recession.  Anyone who spends some time with this will learn a great deal about the history of recessions from a veteran observer.

I have promised another installment on how I use Bob's information to improve investing.  I hope to have that soon.  Meanwhile, anyone watching the videos will quickly learn that the aggregate spread (and the C Score) provides an early warning.  Bob also has a collection of coincident indicators and is always questioning his own methods.

Meanwhile, here is the latest take from Bob's monthly take on the economy:

Nospin business cycle

Bob's work is crucial to understanding why we are still early in the business cycle. Others look at elapsed time. Bob looks at data.

I also feature RecessionAlert, which combines a variety of different methods, including the ECRI, in developing a Super Index.  They offer a free sample report.  Anyone following them over the last year would have had useful and profitable guidance on the economy.  RecessionAlert has developed a comprehensive package of economic forecasting and market indicators, well worth your consideration. Of special interest is the Leading SuperIndex, which accurately forecast the absence of a summer swoon. Since the weekly data are still mixed, it is important to monitor the index closely. Here is the most recent update and chart:

Georg Vrba's four-input recession indicator is also benign. "Based on the historic patterns of the unemployment rate indicators prior to recessions one can reasonably conclude that the U.S. economy is not likely to go into recession anytime soon." Georg has other excellent indicators for stocks, bonds, and precious metals at iMarketSignals. These all have recent updates.

Unfortunately, and despite the inaccuracy of their forecast, the mainstream media features the ECRI. Doug Short has excellent continuing coverageof the ECRI recession prediction, now over 18 months old.  Doug updates all of the official indicators used by the NBER and also has a helpful list of articles about recession forecasting.  His latest comment points out that the public data series has not been helpful or consistent with the announced ECRI posture.  Doug also continues to refresh the best chart update of the major indicators used by the NBER in recession dating.

The average investor has lost track of this long ago, and that is unfortunate.  The original ECRI claim and the supporting public data was expensive for many.  The reason that I track this weekly, emphasizing the best methods, is that it is important for corporate earnings and for stock prices.  It has been worth the effort for me, and for anyone reading each week.

Readers might also want to review my Recession Resource Page, which explains many of the concepts people get wrong.

Our "Felix" model is the basis for our "official" vote in the weekly Ticker Sense Blogger Sentiment Poll. We have a long public record for these positions.  A few weeks ago we briefly switched to a bearish position, but it was a close call. Two weeks ago we switched back to neutral, which was also a close call. The inverse ETFs were more highly rated than positive sectors by a small margin, but remained in the penalty box. Last week we were almost in bullish territory, an amazing change in only two weeks. Last week I wrote that we were sticking with "neutral", but the bias was to the upside. This week the ratings have improved enough to warrant a bullish forecast.

These are one-month forecasts for the poll, but Felix has a three-week horizon.  Felix's ratings have improved quite a bit. The penalty box percentage measures our confidence in the forecast.  A high rating means that most ETFs are in the penalty box, so we have less confidence in the overall ratings.  That measure remains elevated, so we have less confidence in short-term trading.

[For more on the penalty box see this article. For more on the system ratings, you can write to etf at newarc dot com for our free report package or to be added to the (free) weekly ETF email list.  You can also write personally to me with questions or comments, and I'll do my best to answer.]

The Week Ahead

This week brings little data and scheduled news, an artifact of the calendar and the holidays.

The "A List" includes the following:

  • Initial jobless claims (Th).   Employment remains the focal point in evaluating the economy, and this is the most responsive indicator.
  • Michigan sentiment index (F). This remains a good concurrent indicator for employment and spending. This is the final reading for July, but it sometimes differs significantly from the preliminary report.
  • Existing home sales (M). Housing remains as a crucial driver for the U.S. economy.

The "B List" includes the following:

  • New home sales (W). Important, but less interesting than permits
  • Durable goods (Th). More interesting than normal given the low GDP.

And especially – Earnings!

A quiet time on the Fed speechifying front.

How to Use the Weekly Data Updates

In the WTWA series I try to share what I am thinking as I prepare for the coming week. I write each post as if I were speaking directly to one of my clients. Each client is different, so I have five different programs ranging from very conservative bond ladders to very aggressive trading programs. It is not a "one size fits all" approach.

To get the maximum benefit from my updates you need to have a self-assessment of your objectives. Are you most interested in preserving wealth? Or like most of us, do you still need to create wealth? How much risk is right for your temperament and circumstances?

My weekly insights often suggest a different course of action depending upon your objectives and time frames. They also accurately describe what I am doing in the programs I manage.

Insight for Traders

Felix has moved to a bullish posture, now fully reflected in our trading accounts. We have maintained our long position in oil and also added two equity ETFs. Felix did well to avoid the premature correction calls that have been prevalent since the first few days of 2013, accompanied by various slogans and omens. Felix has dodged some of the market volatility, profited from a short bond position, and made gains in oil (via USO).

Insight for Investors

This is a time of danger for investors who are stubbornly sticking to losing ideas. This was the subject of some great posts last week.

Abnormal Returns wrote about those who have missed the rally, citing several other helpful articles. Here is a key quote:

…(W)e investors have a tendency to personalize these things. The past five years has been a difficult for investors. Especially for those investors who have fought the rally all the way higher. Those who did so have often been enamored of one theory or another on why the economy (and stock market) were headed for a fall. Unfortunately the market doesn't care about your theories.

I encourage reading the entire post and all of the links cited. This is a great way for those who have missed the rally to gain a new perspective.

Meanwhile, our readers with a long-term perspective should find this approach as quite familiar. If you have followed our indicators on earnings, recession risk, and the St. Louis Financial stress index you have had a much more constructive viewpoint. If you follow Bob Dieli's business cycle work, you have a special edge.

My recent themes are still quite valid. If you have not followed the links below, please find a little time to give yourself a checkup. You can follow the steps below:

  • What NOT to do

Let us start with the most dangerous investments, especially those traditionally regarded as safe. Interest rates have been falling for so long that investors in fixed income are accustomed to collecting both yield and capital appreciation. An increase in interest rates will prove very costly for these investments. It has already started. Check out Georg Vrba's bond model, which continues to signal the risk. Other yield-based investments have also suffered, and it is not over. Check out the latest interest rate forecast from LearnBonds. Or the timetable to a 4% ten-year note from Goldman Sachs (via Joe Weisenthal).

  • Find a safer source of yield: Take what the market is giving you!

For the conservative investor, you can buy stocks with a reasonable yield, attractive valuation, and a strong balance sheet. You can then sell near-term calls against your position and target returns close to 10%. The risk is far lower than for a general stock portfolio. This strategy has worked well for over two years and continues to do so. I have had a number of questions about this suggestion, so I recently wrote an update. That post provides background as well as concrete examples showing how you can try this strategy yourself. There is nothing quite as satisfying as watching your account grow while the market is doing nothing or trading in a range.

  • Balance risk and reward

There is always risk. Investors often see a distorted balance of upside and downside, focusing too much on news events and not enough on earnings and value. You need to understand and accept normal market volatility, as I explain in this post: Should Investors be Scared Witless?

  • Get Started

Too many long-term investors try to go all-in or all-out, thinking they can time the market. There is no reason for these extremes. Recent weeks have been tough for traders. Most were surprised by the market reaction to more FedSpeak and the spike in interest rates.

For investors it was a different story. If you had your shopping list, there have been good opportunities to buy stocks. For those following our enhanced yield approach you had both the chance to set new positions and to sell calls against old ones. This week's Barron's has a nice list of inexpensive stocks. You need a subscription or to purchase a copy, but I like the list --- perhaps because we hold three of the seven stocks mentioned!

And finally, we have collected some of our recent recommendations in a new investor resource page -- a starting point for the long-term investor.  (Comments and suggestions welcome.  I am trying to be helpful and I love feedback).

Final Thought

I have no special insight in how the rest of the earnings season will play out.

Regardless of the current results, we will soon enter a period of seasonal strength. The "sell in May and buy in October" meme defies logic. Most good investment ideas disappear. When they are known, people follow them.

Here is a clue about why seasonality works. This is a quotation from Andrew Bary in this week's Barron's

"The S&P 500 trades for about 15 times projected 2013 profits and 14 times estimated 2014 earnings. Small-cap indexes have higher valuations, with the Russell 2000 index fetching about 17 times projected earnings in the coming year. The S&P 500 is up 18% this year and the Russell, 24%."

It is July, so he is citing a multiple for both 2013 and 2014. In a few months no one will talk about the 2013 multiple; they will all look ahead.

This may seem silly, but I have watched it for two decades. Earnings are reported and summarized by calendar years, and that is how they are discussed. At some point, if earnings are growing (as is usually the case) the market just seems cheaper since the multiple is for the next year. You can gain a solid advantage by always using a 12-month forward earnings approach, as I describe here. I also do this with my individual stock analysis.

I expect the market to digest the current numbers, but also to look beyond the current earnings season.

See the original article >>

Diverging fund flows are reflected in fixed income performance

by SoberLook

Capital is returning to certain fixed income sectors. Fund flows are quite uneven however, with the corporate sector remaining investors' favorite. In particular, high yield bonds have recouped a great deal of the recent outflows.

Source: Goldman Sachs

In contrast, mumi bonds have seen almost no new net inflows. The little problem in Detroit is not helping the situation (see story) and the SEC going after the city of Miami (see story) has made the sector look quite unappealing.

Source: Goldman Sachs

Outside of treasuries, fixed income performance these days is extremely sensitive to fund flows. And the returns over the past month (June 20th - July 19th) fully reflect these dynamics in mutual funds and ETFs.

See the original article >>

Stock Market Uptrend May be Topping

By: Tony_Caldaro

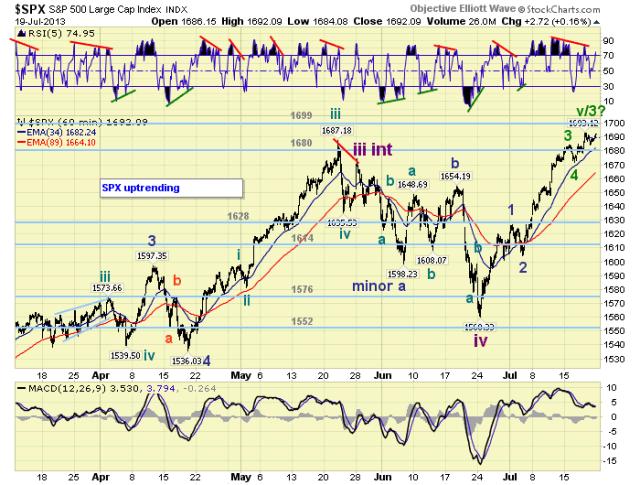
The market started the week by making a new uptrend high on Monday, pulled back, made a new all time high on Thursday, pulled back, then ended the week within one point of the all time high. For the week the SPX/DOW were +0.60%, the NDX/NAZ were -0.75%, and the DJ World index gained 1.0%. Economic reports returned to a positive bias this week. On the uptick: retail sales, the NY/Philly FED, business inventories, the CPI, industrial production and capacity utilization, the NAHB housing index, and weekly jobless claims were lower. On the downtick: housing starts, building permits, the M1 multiplier and the WLEI. Next week more housing reports, durable goods orders and consumer sentiment.

LONG TERM: bull market

The market ended the week within one point of the all time high established on Thursday at SPX 1693. The bull market continues. Unfortunately, as we have been reporting, the US is one of the few, if not the only, bonafide bull market of the twenty international indices we track. When this bull market starts to stumble the thud will be heard worldwide.

We continue to count this bull market as Cycle wave [1] of Super cycle wave 3. Super cycle bull markets last 70 – 80 years. But Cycle [1] bull markets typically last about five years. We continue to expect five Primary waves to conclude before this bull market ends. Primary wave I and II completed in 2011, and Primary III has been underway since then. Primary I divided into the typical five Major waves, but had a subdividing Major wave 1. Primary III is also dividing into five Major waves, but both Major 1 and 3 are subdividing into five Intermediate waves.

Major waves 1 and 2, of Primary III, completed by mid-2012. Major wave 3 has been underway since then. Intermediate waves i and ii completed by late-2012, and Int. waves iii and iv completed by mid-2013. Intermediate wave v, of Major wave 3, of Primary III is currently underway. When this uptrend concludes a Major wave 4 correction will follow, and the market should lose about 10% of its value. After that we expect a Major wave 5 uptrend to new highs, concluding Primary wave III. Then after a Primary wave IV correction, a Primary wave V uptrend to new highs should complete the bull market. We continue to target the bull market conclusion by late-winter to early-spring of 2014.

MEDIUM TERM: uptrend

When this uptrend began at SPX 1560 in mid-June we projected a minimum target of the 1680 pivot for Minor wave 3, and the 1699 pivot for Minor wave 5. These targets were met this week when the SPX entered the 1699 pivot range. We had also projected a July uptrend high would probably end at the 1699 pivot, or an August uptrend high at the 1779 pivot. The question on some traders minds; “Is the market topping here, or preparing to extend into August?”

During the week we posted three potential short term counts to address this question. One of the three has already been eliminated. This leaves us with two potential counts: one posted on the SPX hourly chart, and the other on the DOW hourly chart. Both counts, as of Friday’s close are still valid. The SPX count suggests the uptrend is in the process of a forming a top. The DOW count suggests the uptrend will probably extend into August. The internal wave structure of this uptrend and the technicals, are the keys to this inflection point. Medium term support is at the 1680 and 1628 pivots, with resistance at the 1699 and 1779 pivots.

SHORT TERM

From the SPX 1560 Intermediate wave iv downtrend low we counted five waves up to SPX 1627, then a three wave pullback to 1605. This completed Minor waves 1 and 2. After that the market rallied quite strongly, in a five wave sequence, to SPX 1685. This could have ended Minor wave 3. The pullback that followed, however, was smaller than the 20+ points expected for a Minor wave 4 (1685-1672). From that low the market rallied to SPX 1693, and then pulled back on Friday to 1684 for another small pullback. During an Int. wave i or wave iii uptrend, we would consider this normal Minor wave 3 activity. However, since there have be several shortened fifth waves during this bull market. We can not assume this fifth wave will follow normal uptrend activity.

During this uptrend the smaller pullbacks, and there have been quite a few, have declined between 9 and 13 points. Minor wave 2 stands out as a 22 point pullback. From the Minor wave 2 SPX 1605 low the market has advanced into Friday’s close with four small pullbacks between the same 9 and 13 points. Normally, we would consider this rally an ongoing Minor wave 3. In fact, should the SPX rise above 1693 we would count this advance as an ongoing Minor wave 3. The count posted on the DOW charts. If it fails to clear SPX 1693, then the count posted on the SPX charts, a potential uptrend high, becomes the probable count.

Technically there are some negatives supporting a potential uptrend high scenario. The SPX/DOW have met the minimum requirements to complete this uptrend, and there are negative divergences on most timeframes. A strong rally, however, would clear them away. Currently, we would put the probabilities for the two scenarios at 50-50. Short term support is at the 1680 pivot and SPX 1658-1667, with resistance at the 1699 and 1779 pivots. Short term momentum ended the week overbought. The short term OEW charts remain positive with the reversal level now SPX 1675.

FOREIGN MARKETS

The Asian markets were mostly higher gaining 0.2% on the week. Australia, India and Japan are in confirmed uptrends.

The European markets were mostly higher gaining 1.9% on the week. England, France, Germany and Switzerland are in confirmed uptrends.

The Commodity equity group were all higher on the week gaining 3.3%. Canada and Russia are in confirmed uptrends.

The DJ World index is uptrending and gained 1.0% on the week.

COMMODITIES

Bonds continues to look like they are beginning to uptrend gaining 0.7% on the week.

Crude remains in an uptrend since April gaining 1.8% on the week.

Gold continues to work its way higher gaining 0.9% on the week.

The USD may be downtrending again losing 0.3% on the week.

NEXT WEEK

Monday we have Existing home sales at 10:00. Tuesday: FHFA housing prices. Wednesday: New home sales. Thursday: weekly Jobless claims and Durable goods orders. Friday: Consumer sentiment. A quiet week, with a quiet FED, ahead of the FOMC meeting on Tuesday/Wednesday of the following week. Best your weekend and week!

See the original article >>

Any Bonds Today?

By: John_Mauldin

By a continuing process of inflation, governments can confiscate, secretly and unobserved, an important part of the wealth of their citizens. By this method, they not only confiscate, but they confiscate arbitrarily; and, while the process impoverishes many, it actually enriches some. The sight of this arbitrary rearrangement of riches strikes not only at security, but at confidence in the equity of the existing distribution of wealth. Those to whom the system brings windfalls . . . become 'profiteers', who are the object of the hatred of the bourgeoisie, whom the inflationism has impoverished not less than the proletariat. As the inflation proceeds . . . all permanent relations between debtors and creditors, which form the ultimate foundation of capitalism, become so utterly disordered as to be almost meaningless…. – John Maynard Keynes

One of the more frequent and important questions I get asked when I travel is whether I think we will see inflation or deflation. My usual flippant answer is "Yes," and then I go on to explain that there is no simple answer. Over what time period? In what country? And by what means do you want me to measure inflation or deflation? Today we take a look at part of a white paper I am working on with Jonathan Tepper, the co-author of Endgame, on this topic. I think you will find it interesting reading on a summer's day. And I have to quickly mention the absolute disaster that is happening before our eyes in the labor market. Our kids are getting skewered (the polite word) by unintended consequences of the Affordable Care Act. We need a bipartisan fix quick, before we damage an entire generation.

But first, let me call your attention to a dynamite conference at which I'll be speaking in October. It's "3 Days with Casey," the Casey Research Summit for 2013, to be held October 4-7 in Tuscon, Arizona. In addition to the indomitable, incredible Doug Casey, my friends Ron Paul, Lacy Hunt, Rick Rule, and Don Coxe will all stand and deliver, along with a bunch of other outstanding speakers, including Jim Rickards (author of Currency Wars), Paul Brodsky (I love this guy's stuff!), and Chris Martenson (author of The Crash Course). And of course you get the whole Casey research team. Thoughts from the Frontline readers can get a special early bird discount here. Come help me celebrate my 64th birthday!

A Temporary Problem

Back in 2010, a number of analysts (including me) noted an unintended consequence buried in the Affordable Healthcare Act (aka ObamaCare). Employers are not required to provide insurance for temporary workers, and a temporary worker is defined as someone who works under 29 hours per week. Many of us noted that this would result in businesses shifting workers from full-time to part-time. The answer from AHA supporters was that "No, it wouldn't" or that the effect would be small. There was no real way to know, of course. I and others could only point to our experience of how the real world works. If you defined the cut-off for part-time work at 35 or 39 hours a week instead of 29, the economics of ObamaCare simply got blown out of the water. But the bill passed, and now it's law.

And now the argument is over. It is clear that businesses have indeed responded to the rather perverse incentives in the law. A year ago, growth in full-time employment far outpaced increases in temporary employment. That trend has reversed this year. Mort Zuckerman wrote in an op-ed piece in the Wall Street Journal this week:

The jobless nature of the recovery is particularly unsettling. In June, the government's Household Survey reported that since the start of the year, the number of people with jobs increased by 753,000 – but there are jobs and then there are "'jobs."' No fewer than 557,000 of these positions were only part-time. The June survey reported that in June full time jobs declined by 240,000, while part-time jobs soared 360,000 and have now reached an all-time high of 28,059,000 – three million more part-time positions than when the recession began at the end of 2007.

That's just for starters. The survey includes part-time workers who want full-time work but can't get it, as well as those who want to work but have stopped looking. That puts the real unemployment rate for June at 14.3%, up from 13.8% in May.

The US Chamber of Commerce summarizes the situation:

"Small businesses expect the AHA requirement to negatively impact their employees. Twenty-seven percent say they will cut hours to reduce full-time employees, 24 percent will reduce hiring, and 23 percent plan to replace full-time employees with part-time workers to avoid triggering the mandate."

Younger people and those whose jobs could readily be farmed out to plenty of potential replacements are in danger. There are many jobs that can almost as easily be done by two people working 20-25 hours as by person working 40-50 hours. And that is what is happening. As Zuckerman notes, if you count those who have only temporary employment though they want full-time work, the unemployment rate rose last month from 13.8% to 14.3%. This is recovery?

I have seen this happen in my own family (and to a union member, no less!). How can you support yourself on a part-time job? Juggling two part-time jobs takes a lot more than 40 hours a week and increases the costs of getting to and from work. And under the AHA, the government, not the employer(s), is going to have to pick up that bill if a part-time worker is going to have health insurance.

Republicans want to repeal ObamaCare. Many are not interested in anything short of that outcome. Democrats don't want to change anything and won't touch legislative fixes, afraid to be seen as opening up the whole issue before the next mid-term elections. But we are seriously damaging the ability of people to get work and be able to support themselves and especially the opportunity for younger people to get work that can result in acquiring skills and moving upward on the income scale. The definition of part-time should revert to the traditional standard: if you work less than 40 hours a week, you are part-time.

I get that that destroys the economics of ObamaCare. But do we want to see our children as unintended casualties in a political war over healthcare? A bill has been introduced to fix this problem in the Senate. The US Chamber of Commerce survey is telling us the direction we are currently headed in. Do we really want to wait until things get even worse?

And now, let's think about inflation, together with my co-author, Jonathan Tepper.

Any Bonds Today?

Can you imagine Julia Roberts and Gwyneth Paltrow helping the US government sell bonds or Jay Z and Justin Timberlake composing songs about Treasury bills? It would not be the first time Hollywood stars or famous musicians tried to help the government sell its debt.

The last time the US government had an enormous load of debt, it used Hollywood stars to help sell government debt. The Treasury Department conducted a massive public relations campaign through radio, newspapers, and film. During World War II, war bond rallies were held throughout the country, and Hollywood stars such as Bette Davis and Rita Hayworth traveled around the country to promote war bonds. The great Irving Berlin even wrote a song titled "Any Bonds Today?" and Berlin's tune became the theme song of the Treasury Department's National Defense Savings Program.

The government also enlisted cartoon characters, actors, comedians, and musicians to encourage people to pay income taxes. Donald Duck told viewers it was their "duty and privilege" to pay income tax. Abbott and Costello appeared in advertisements to get people to pay taxes, and Irving Berlin wrote songs not only about bonds but songs about taxes like "I Paid My Income Tax Today."

While the war bond and income tax drives garnered all the press, the real reason the US was able to borrow so much and with so little burden had nothing to do with the glitz and glamor of movie stars. The US government borrowed easily because the Federal Reserve printed money to keep interest rates low. Borrowing is very easy when a central bank has your back.

How did it work in practice? As is the case today, the Treasury wanted to borrow cheaply then, and the central bank was happy to accommodate. In 1942, after the United States entered World War II, the Federal Reserve officially agreed to fix interest rates on government bonds at a low level. To maintain the pegged rate, the Fed was forced to give up control of the size of its balance sheet. Unsurprisingly, the Fed bought and held all available short-term US treasuries and almost all long-term government bonds.

The costs of paying for World War II pushed the national debt up sharply, from around 40% of GDP before the war to a peak of nearly 110% as the war ended. But a combination of strong economic growth, tight fiscal policies, and financial repression brought the debt back below 50% of GDP by the late 1950s. (Currently our government debt has reached about 90% of GDP and continues climbing very sharply.)

During the war years, the Federal Reserve pegged long-term interest rates at extremely low levels so the government wouldn't have to pay much to fund itself. To make sure that inflation didn't spike, the government instituted wage and price controls. After the war, the price controls disappeared and inflation rose very quickly, averaging about 6.5 percent annually from 1946-51. By the postwar price peak nine years later, wholesale prices had more than doubled, and the stock of money had nearly tripled.

Normally, such high inflation would have made it much more expensive for the government to borrow money. But after being pressured by the Treasury, the Federal Reserve agreed to keep on pegging long-term government bond yields at 2.5% until the spring of 1951, when the Federal Reserve finally refused to print money to keep bond yields low. Because of the coordination between Federal Reserve and the US Treasury, real yields on government bonds were very negative during the years following World War II. With negative real yields, borrowers win and lenders lose. The clear winner was the US government, and the loser was anyone who bought and held US bonds. The combination of very low government bond borrowing costs and high inflation ate away a sizable chunk of the government's debt burden.

The same thing is happening today in almost all government bond markets around the world. Governments are winning, and investors are losing. The Federal Reserve is helping the Treasury to borrow cheaply while the government expands its deficit spending and debt accumulation. Using inflation and low bond yields this way to reduce government debt is called financial repression.

The government and central banks also contribute to higher inflation by pretending inflation is always under control. For example, throughout the Greenspan and Bernanke years, the Fed consistently chose to focus on lower inflation measures whenever doing so suited the central bank. You can see this in the semiannual monetary policy reports to Congress, specifically in the inflation forecasts made by the members of the Federal Open Market Committee. Until July 1988, inflation forecasts used the implicit deflator of the gross national product, but then the Fed switched to the Consumer Price Index. In February 2000, the Fed replaced CPI with the personal consumption expenditures (PCE) deflator. Thus from July 2004 onward, inflation forecasts have employed the core PCE deflator that excludes food and energy prices. Using lower and lower, less comprehensive estimates for inflation has allowed the Fed to pretend that it is meeting its mandate – but by ignoring high in flation readings. In the meantime, interest rates have been kept too low, and the inflation rate has consistently remained above the Federal Funds rate.

But measuring inflation is not so easy. The vast majority of readers have no idea about the rather contentious nature of the debates that go on in academic conferences about arcane topics such as the minutiae of how to measure some minor aspect of inflation. Passions run deep. Careers are made. Once you delve into how things are actually done, you realize that what we think of as an inflation number is actually an approximation of an idea the very definition of which can change over time.

Your perception of inflation (and everyone else's) has a very close relationship to how stock markets perform over time. Indeed, one of the questions we are both regularly asked wherever we speak is something along the lines of "What do you think inflation or deflation will be?" And the answer is not easy: it depends on a number of factors that vary from country to country.

In general, the trend for the last 75 years has been one of inflation. Sometimes, in some countries, inflation has spun out of control. At other times you see outright deflation. Neither one promises good times for investors. Ever-falling inflation or low inflation is the best environment for investing. But given the paramount importance of the inflation/deflation debate, we need to briefly investigate what inflation is and is not.

There has been a great deal written about the difficulty of measuring inflation and about the potential manipulation of inflation statistics over the last 30 years. John Williams of ShadowStats is the most-noted proponent of the position that inflation is running well above the current US government's number of 2% (for the 12 months ending February 2013).

Employing the methodology that was used in 1980 under the Carter administration, inflation would currently be about 9.6% (see chart below). Using the government methodology from 1990, inflation today turns out to be a little under 6%.
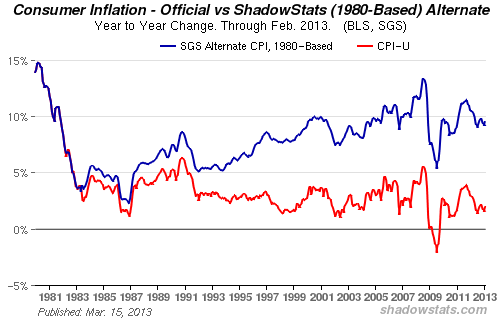
(Fair warning: The following will be regarded as a contentious statement by the gold bugs and hyperinflationists out there. For some of you, to accept it would be like admitting your religious beliefs are wrong.)

The topic of those alternate inflation numbers comes up often at our tables of conversation. Generally it seems to be clear that the methodologies used in 1980 and 1990 are visibly, patently, demonstrably wrong. If inflation were now at 9.6%, then interest rates should be closer to 12% and not the 1.75% we see on the 10-year Treasury today (more on that topic in a minute), no matter what the Fed wanted, unless they were willing to monetize not only new debt but any existing debt that got rolled over as well. Over time, markets respond to actual inflation and not government statistics. Argentina's government can state that inflation is "only" 10%, but the market thinks it is 30% and rising.

The government calculation of inflation in 1980 or 1990 was the best they could do at the time. Gentle reader, it was a government calculation. There is nothing ex cathedra about either methodology. In religious terms, neither rises to the stature of the original Greek documents or the Latin Vulgate Bible. Changing the words (the equations) in economics should not be seen as somehow equivalent to changing the fundamental documents of a religion. There is nothing sacred about 1980 CPI methodology, and in fact we can look at it empirically and understand that it was pretty flawed.

You might have some personal investment bias (read "quasi-theological reason") to want inflation to be high. But that is a belief system. It is one form of faith-based economics (It is not a large stretch to suggest that most economic schools require of their adherents a measure of faith and belief). Expectations of high inflation are for some people a basic tenet of their belief system. Saying there is only a little inflation must therefore be a government manipulation.

We must constantly be comparing our assumptions against what we observe in the real world, in order to discern where our models, with their built-in assumptions, bias our conclusions about what the data says.

If you think overall general inflation is high, then you have to think the entire world is delusional. (Note: your personal inflation rate may be much higher than 2%.) G-7 interest rates are at an all-time low today. That can and will change; but right now the bond market does not see inflation as a problem anywhere in the developed world, although Japan has now made what must be their 10th vow in the last 20 years to create inflation. This time, they may actually (for them, catastrophically!) succeed. For now, however, deflation and deleveraging are the order of the day.

If we had kept the methodology used until 1980 for calculating the Consumer Price Index and then used that number to adjust Social Security and government pensions, the US government would be bankrupt today. Social Security would have gone negative in the 1990s and tripled in cost in the last 12 years (compounding at 10% can do that). Now, those of you living on Social Security might think a tripling of payments is appropriate, given what has happened to your budgets, but younger taxpayers would hasten to differ. (Note: we are not arguing that SS provides a livable income at current levels. Different topic for another paper.)

All this is not to say that today's inflation methodology is correct or gives us a number that is accurate. It is simply better than the methodology used in 1980 – but it is still just a statistical method that tries to reach for the impossible, all-illumnating star of reliability and finally has to settle for accuracy in general at the risk of imprecision in the particulars. We will be able to look back in 15 years to see how well we are doing today at measuring inflation. The real surprise would come if we don't change methodologies at least a few more times between now and 2030.

It is hard to argue with people who point out that prices and the cost of living are going up faster than government-reported inflation reflects. We can all see prices rising. Food, energy, tuition (try managing all that for 30 years with seven kids!) – they're all going up. If we had used actual home prices in the CPI, inflation would have been seen as very high in the middle of the last decade. Instead, we seemed to be flirting with deflation; and if we used housing prices in 2008-2011, we would certainly have had government-reported deflation. In place of home prices, the Bureau of Labor Statistics decided to use something called Owners' Equivalent Rent a few decades ago; and it is the largest part, a full 24%, of the CPI. Something called hedonics is probably the most contentious part of the CPI calculation. The BLS says, "The hedonic quality adjustment method removes any price differential attributed to a change in quality by adding or subtract ing the estimated value of that change from the price of the old item." This is not as mysterious as it sounds. When, for example, you replace your old computer with a new one, paying roughly what you did before, the new model you buy is always faster and more powerful than the old one. The BLS says you are getting more for your dollar; therefore the price fell even if you paid as much or more for the new computer. Opponents say hedonics can be used to hide "true" inflation.

We do know that a lot of items have in fact gone down in price and up in quality or capacity. Cell phones are a good example. And the cost of using cells may be ready to really fall. There is a full smart phone that uses a major carrier and Wi-Fi in combination now on the market for $20 a month for all the voice, data, and text you can eat. It works on Wi-Fi in Asia, in Europe, and in the middle of the Andes. You pay basically nothing for 10 or 15 or 40 hours a week of talk time, and people can call you anywhere in the world using a local US number if you are connected to Wi-Fi.

Most egregiously for many, the CPI also does not take into consideration income taxes. For a number of people, taxes are their largest source of inflation!

Yet all of us here in the US are governed by the same people in Washington, and they define inflation in their own way, via the Consumer Price Index and various related benchmarks. Because CPI tries to find a national "average" inflation rate, it is almost by definition inaccurate for any given person, family, business, city, or state. CPI is the least common denominator, a "one size fits all" coat that in reality fits no one very well. (For the record, all the data used to calculate inflation is public. You can calculate inflation for your own local area if you have nothing better to do. In fact, the entire methodology is public, if a little dense.)

Given the acknowledged limitations of the CPI, we nevertheless use it in myriad ways. It governs cost-of-living adjustments for Social Security beneficiaries, government employees, and many labor union members. CPI is baked into the general cake, even though we know it is an imperfect fit in almost every situation.

As a result, some people get raises when their cost of living drops, while for others the cost of living rises faster than their income does. Is this fair? No. Is there a better way? We don't know what it would be. There are hundreds of smart people who build entire careers trying to answer that question.

Other inflation measures exist, but they all have their own limitations. Three Federal Reserve Bank regions calculate their own versions of CPI. The Federal Reserve itself prefers to look at something called PCE, or Personal Consumption Expenditures, a measure which uses chained dollars rather than a fixed basket as the CPI does. Since 2000, the Federal Reserve has used PCE in its reports to Congress about expectations for inflation.

In explaining its preference for the PCE, the Fed stated:

The chain-type price PCE index draws extensively on data from the consumer price index but, while not entirely free of measurement problems, has several advantages relative to the CPI. The PCE chain-type index is constructed from a formula that reflects the changing composition of spending and thereby avoids some of the upward bias associated with the fixed-weight nature of the CPI. In addition, the weights are based on a more comprehensive measure of expenditures. Finally, historical data used in the PCE price index can be revised to account for newly available information and for improvements in measurement techniques, including those that affect source data from the CPI; the result is a more consistent series over time. ("Monetary Policy Report to the Congress," Federal Reserve Board of Governors, Feb. 17, 2000)

Contentious? You bet! PCE and other chained inflation numbers generally yield lower inflation figures, which is why many in Congress (and the AARP) think the "chained dollars" amount to some sort of conspiracy to defraud seniors on Social Security. CPI is used to calculate adjustments for income taxes. If it is too low, then incomes rise faster in real terms than cost adjustments do, and that acts as a tax increase even as your pension is adjusted lower. But if inflation is calculated too high, then taxes are lower than they would otherwise be and the costs of Social Security and pensions are higher. Talk about using a sledgehammer to fine-tune a highly developed economy. Even small miscalculations will add up over time to large losses for someone. Ouch!

Newport, NYC, Maine, and Montana

I head off to Newport, Rhode Island, on Sunday to spend a week in a workshop for the Department of Defense at the Naval War College there. Basically, they gather 12 or so experts in a wide variety of fields to sit down with people from the five branches of the military who are responsible for future planning (utilizing both the hard and soft sciences). They ask us to come up with a set of future scenarios that are outside the current mainstream consensus but that the Defense Department might need to consider in their planning. I am not exactly sure why I get invited, but it's a week of mind candy for me. When I was first asked, I wondered how much it would cost me. I actually get a government stipend and my room and board. They do work your derriere off, but it's worth it. (Google "Andrew Marshall and the Office of Net Assessment." Marshall is 91, was appointed by Nixon to head the Office of Net Assessment, and has been reappointed by every president since then. It is an honor to be in the same room with him. I recently taped an interview with Andrew on how he goes about thinking about the future, and at some point I'll make it public.)

After a week in Newport, I go to NYC for a few days of meetings and work on projects before I head to Maine for the annual fishing trip (Camp Kotok at Leen's Lodge in Grand Lake Stream) the following week. That Friday (Aug. 2) I will likely be on Bloomberg in the morning, live from Maine, at about 9 AM. It will be Jobs Report Friday, so that is usually the topic of conversation. I will note more on that schedule next week. Then I am home for a week before I head to Montana for four days of R&R at the lake home of my good friend Darrel Cain.

For those interested, I recently did an interview with Eric King on King World News. You can listen in at http://tinyurl.com/m5d97h7.

It has been a busy week as I play catch-up with the commitments and reading I got behind on while I was sick. I am now fully recovered, although I can't do 50 push-ups yet. That is my personal marker for being back. I'll get there. Have a great week!

Your worried about jobs for the kids analyst,

See the original article >>

Follow Us