Sunday, September 18, 2011

Stock Market, this is Not 2008


It was a wild week for sure. The SPX started the week by declining about 1.5% to 1136 and ended the week hitting 1220 for a 5.4% gain. The Central Banks announced three separate USD swap programs mid-week, to increase liquidity in Europe. There was also lots of talk of an ECB TALF program. In the mean time, in the US, economic reports were decidedly negative. On the plus side: business inventories improved, along with, the current account deficit, consumer sentiment, the Philly FED, and the M-1 multiplier rose. On the negative side: import/export prices declined, along with, retails sales, the CPI/PPI, the NY FED, industrial production, capacity utilization, the monetary base and the WLEI. The budget deficit increased, as did weekly jobless claims. If you are counting that’s five positives and twelve negatives. Nevertheless, the SPX/DOW were +5.05%, and the NDX/NAZ gained 6.45%. Asian markets lost 0.4%, European markets gained 4.2%, the Commodity equity group 0.3%, and the DJ World index gained 2.9%. Next week we have the much awaited FOMC meeting, the yet to be interesting Housing reports, and Leading indicators.

LONG TERM: bear market highly probable

After an important May high in the SPX at 1371, and a July high in the NDX at 2438, the market went into a tailspin. The SPX had lost 19.6%, and the NDX lost 16.5%, by early August. Since then, now mid-September, the SPX has retraced 48% of that decline and the NDX has retraced 68%. New bull market? Not likely. During the 2007-2009 bear market the SPX/NDX declined in fives waves into a Mar08 low. After that they had a two month counter-trend rally that retraced: SPX 57% and the NDX 68% of that decline. We all know what happened next. This bear market is unfolding in a different pattern, thus far.

Instead of fives waves down into a significant low, with market internals extremely oversold. This market has done three waves down into a significant low, with similar internals. This suggests, when this apparent uptrend ends, this market will not collapse like it did in 2008, but will do another set of three waves down to create the bear market low. A couple of weeks ago we worked out some numbers awaiting a potential uptrend confirmation. Since this appears probable, at the moment, this is what we came up with.

The first decline was an ABC which took three months and we labeled it Primary wave A. The current probable uptrend should last until October, two months, and retrace between 50% and 62%, in the general markets, of the first decline: Primary wave A. We will label this uptrend Primary B. Next, we should have three Major waves down to complete Primary wave C and end the bear market. This is likely to take either three or six months, which puts us into January or April. Should the decline be a simple one, three months, we’re looking at a low around SPX 1011, the previous Primary wave II. Should it take six months then the likely target will be the SPX 869 area, the previous Major 2 low of Primary I.

Fibonacci retracement levels of the previous bull market suggest: SPX 1102 (38.2%) which was hit precisely, SPX 1018 (50.0%) and SPX 935 (61.8%). If we take the orthodox low of SPX 1121, for the failed fifth wave, we have a 250 point decline from 1371. Should this uptrend rally to SPX 1261, then we have another three month 250 point decline the SPX would hit exactly 1011. We also have OEW pivots at 1018, 1007 and 988. As a result of all these technical relationships we favor the three month, SPX 1011, bear market bottom scenario.


When we review the weekly chart, we observe the economy is still in contraction mode with the WLEI well below 50%, and the public is quite pessimistic about the economy. Also, the MACD is in bear market territory and still declining. The RSI has worked its way from quite oversold to neutral, and may even hit slightly overbought like it did in July. But until it registers an extremely overbought reading this market will eventually head lower. In conclusion, we’re not as pessimistic as we were at the beginning of the bear market as the wave structure is unfolding like a normal ABC bear market.

MEDIUM TERM: downtrend likely ended at SPX 1102

We remain under the assumption, with no OEW confirmation yet, the downtrend from the SPX 1356 July high ended in August, on a failed fifth wave, at SPX 1121. Since then this market has been tracing out an abA-abB-abC counter-trend rally uptrend. Thus far we have observed the abA from SPX 1121 (1191-1136-1231), and the abB from SPX 1231 (1140-1204-1136). Now we should be in the abC portion of this complex double three uptrend.

Thus far we have witnessed a fairly good rally from SPX 1136 to 1220 this friday. This should be the ‘a’ portion of the abC. When it concludes the ‘b’ portion should drop fairly quickly and sharply. The first one, in this structure, dropped 55 points in only one day. Once the ‘b’ portion concludes we should get another good rally to complete the ‘c’ portion, and it will likely coincide with a belated uptrend confirmation. When we review the rising abA we observe three moves: 70 points up, 55 down, and 95 up. The current rally has already gained 84 points, exceeding the ‘a’ of the first similar structure. If we are getting these three waves in reverse this time, it suggests a potential high for ‘a’ at SPX 1231, a decline to 1176, then a rally to 1246. This is all hypothetical of course. But sometimes these structures do unfold this way.


The daily chart suggests the RSI should get quite overbought before this uptrend ends. Thus far it has only touched overbought a couple of times. This suggests the SPX could make it up to the original targets of the 1261 and/or the 1291 pivots. The OEW 1261 pivot fits right in line with our simple bear market scenario ending in January. An uptrend into the 1261 area would also overlap the Jun11 low of SPX 1258. This activity would certainly confirm the current bear market wave count. This market just needs to continue to chop its way higher for about three more weeks for all this to unfold. With two WROC buy signals, since the SPX 1121 low, this scenario appears quite probable.

SHORT TERM

Support for the SPX remains at 1187 and then 1176, with resistance at 1222 and then 1240. Short term momentum just started to decline after registering a negative RSI divergence on the hourly chart. This market has gyrated from one short term divergence to another, with two exceptions, since the market hit SPX 1102 in early August. It has been quite choppy, reacting to the daily news, but well defined and anticipated. A similar bear market counter-trend structure unfolded between Mar08-May08, as previously noted.


We believe this market has set itself up for another disappointing FED statement. Three important lows, during this probable uptrend, have occurred after FED statement/speeches. The SPX 1102 low occurred after the last FOMC statement. The SPX 1136 low occurred after the FED chairman’s speech at Jackson Hole. Then the second SPX 1136 low after the chairman’s speech in Minnesota. We should get another FOMC statement on wednesday. Short term support is in the low 1200′s, then the 1187, 1176 and 1168 pivots. Overhead resistance is in the low 1230′s, then the 1240 and 1261 pivots. Should anything new develop we will naturally update everyone during the week. Best to your trading!

FOREIGN MARKETS

The Asian markets were mixed this week for a net loss of 0.4%. Australia, Hong Kong, and China were all lower.

The European markets we all higher gaining 4.2% on the week.

The Commodity equity group were mostly lower but did have a net gain of 0.3%. Russia and Canada lost ground.

The DJ World index gained 2.9% on the week. Overall individual world markets were quite mixed.

COMMODITIES

Bonds lost 1.0% on the week as negatvie divergences continued to appear on the daily charts. The 10YR yield moved over 2% to 2.08% after touching a record low at 1.90%.

Crude continued its choppy upside activity, which is looking more and more like a rising wedge, gaining 1.0% on the week.

Gold still appears to be in an unconfirmed downtrend and lost 2.4% on the week. Every time Gold declines it seem to find buyers waiting in the wings. Silver, -1.9%, appears to be just following along at the moment.

The USD lost some ground this week (-0.8%) but remains in an uptrend. Benefitting from the USD swap programs the downtrending EUR gained 1.1%, and the JPY gained 1.3%.

NEXT WEEK

The economic calendar kicks off on monday, of this FED week, with the NAHB housing index at 10:00. Tuesday we have Housing starts and Building permits. Then on wednesday Existing home sales and the FOMC statement around 2:15. On thursday, weekly Jobless claims, the FHFA housing index and Leading indicators. The FED has nothing else scheduled. Best to you and yours this weekend and week.

Thinking the Unthinkable in Europe


To resolve a crisis in which the impossible has become possible, it is necessary to think the unthinkable. So, to resolve Europe’s sovereign-debt crisis, it is now imperative to prepare for the possibility of default and defection from the eurozone by Greece, Portugal, and perhaps Ireland.

In such a scenario, measures will have to be taken to prevent a financial meltdown in the eurozone as a whole. First, bank deposits must be protected. If a euro deposited in a Greek bank would be lost through default and defection, a euro deposited in an Italian bank would immediately be worth less than one in a German or Dutch bank, resulting in a run on the deficit countries’ banks.

Moreover, some banks in the defaulting countries would have to be kept functioning in order to prevent economic collapse. At the same time, the European banking system would have to be recapitalized and put under European, as distinct from national, supervision. Finally, government bonds issued by the eurozone’s other deficit countries would have to be protected from contagion. (The last two requirements would apply even if no country defaulted.)

All of this would cost money, but, under the existing arrangements agreed by the eurozone’s national leaders, no more money is to be found. So there is no alternative but to create the missing component: a European treasury with the power to tax and, therefore, to borrow. This would require a new treaty, transforming the European Financial Stability Facility (EFSF) into a full-fledged treasury.

But this presupposes a radical change of heart, particularly in Germany. The German public still thinks that it has a choice about whether to support the euro. That is a grave mistake. The euro exists, and the global financial system’s assets and liabilities are so intermingled on the basis of the common currency that its collapse would cause a meltdown beyond the capacity of the German authorities – or any other – to contain. The longer it takes for the German public to realize this cold fact, the higher the price that they, and the rest of the world, will have to pay.

The question is whether the German public can be convinced of this argument. Chancellor Angela Merkel may not be able to persuade her entire coalition of its merits, but she could rely on the opposition to build a new majority in support of doing what is necessary to preserve the euro. Having resolved the euro crisis, she would have less to fear from the next election.

Preparing for the possible default or defection of three small countries from the euro does not mean that those countries would necessarily be abandoned. On the contrary, the possibility of an orderly default – financed by the other eurozone countries and the International Monetary Fund – would offer Greece and Portugal policy choices. Moreover, it would end the vicious cycle – now threatening all of the eurozone’s deficit countries – whereby austerity weakens their growth prospects, leading investors to demand prohibitively high interest rates and thus forcing their governments to cut spending further.

Leaving the eurozone would make it easier for the most distressed countries to regain competitiveness. But, if they are willing to make the necessary sacrifices, they could also remain: the EFSF would protect their domestic bank deposits, and the IMF would help to recapitalize their banking systems, which would help these countries escape from their current trap. Either way, it is not in the European Union’s interest to allow these countries to collapse and drag down the entire global banking system with them.

The EU’s member countries, and not only those in the eurozone, must accept that a new treaty is needed to save the euro. That logic is clear. So the discussions about what to include in such a new treaty ought to begin immediately, because, even with European leaders under extreme pressure to agree quickly, negotiations will necessarily be a prolonged affair. Once the principle is agreed, however, the European Council could authorize the ECB to step into the breach, indemnifying it from solvency risks in advance.

Having in sight a solution to the eurozone’s sovereign-debt crisis would be a source of relief for financial markets. Even so, because any new treaty’s terms will inevitably be dictated by Germany, a severe economic slowdown would be almost certain. That might induce a further change of attitude in Germany, in turn allowing the adoption of counter-cyclical policies. At that point, growth in much of the eurozone could resume.

George Soros is Chairman of Soros Fund Management.

The Banking Conundrum


Central bankers and regulators tend to worry that too much competition in the financial sector increases instability and the risk of systemic failure. Competition authorities, on the other hand, tend to believe that the more competition, the better. Both can’t be right.

There is a trade-off between competition and stability. Indeed, greater competitive pressure may increase the fragility of banks’ balance sheets and make investors more prone to panics. It may also erode the charter value of institutions.

A bank with thin margins and limited liability does not have much to lose, and will tend to gamble – a tendency that is exacerbated by deposit insurance and too-big-to-fail policies. The result will be more incentives to assume risk. Indeed, for banks close to the failure point in liberalized systems, the evidence of perverse risk-taking incentives is overwhelming.

That is why crises began to increase in number and severity after financial systems in the developed world started to liberalize in the 1970’s, beginning in the United States. This new vulnerability stands in stark contrast to the stability of the over-regulated post-World War II period. The crises in the US in the 1980’s (caused by the savings-and-loan institutions known as “thrifts”), and in Japan and Scandinavia in the 1990’s, showed that financial liberalization without proper regulation induces instability.

In an ideal world, the competition-stability trade-off could be regulated away with sophisticated risk-based insurance mechanisms, credible liquidation and resolution procedures, contingent convertibles, and capital requirements with charges for systemic institutions. The problem is that regulation is unlikely to eliminate completely market failures: the competition-stability trade-off can be ameliorated, but not eliminated.

For example, the United Kingdom’s Independent Commission on Banking (ICB) has proposed ring-fencing retail activities from investment-banking activities in separately capitalized divisions of a bank holding company. This is a compromise aimed at minimizing the incentive to gamble with public insurance while allowing some economies of scale for banking activities.

But the devil is in the details, and, even in the most optimistic scenario, the trade-off between competition and stability will remain. One shortcoming of the measure consists in the fact that the crisis has hit both universal and specialized banks. Furthermore, the definition of the boundary between retail and investment-banking activities will leave an important grey area and generate perverse incentives.

And the regulatory boundary problem persists: risky activities may migrate to areas where regulation is lax and reproduce the problems with the shadow banking system that we have witnessed during the crisis. As a result, investment-banking operations might need to be rescued if they pose a systemic threat.

The massive regulatory failure exposed by the financial crisis that began in 2008 underscores the need to concentrate on reforms that provide the correct incentives to banks. But, if the past is any guide to the future, we should be aware of the limits of regulation. The UK’s ICB has rightly stated that there is room to improve both competition and stability, given the current weak regulatory framework, but it would be imprudent to strive for the complete elimination of market power in banking.

The design of optimal regulation has to take into account the intensity of competition in the different banking segments. For example, capital charges should account for the degree of friction and rivalry in the banking sector, with tighter requirements in more competitive contexts.

It follows, then, that prudential regulation and competition policy in banking should be coordinated. This is all the more true in crisis situations, in which a protocol of collaboration should be implemented to delineate liquidity help from recapitalization, and to establish the conditions for restructuring in order to avoid competitive distortions.

What implications does this have for market structure? Concentration in well-defined deposit and loan markets is linked with competitive pressure. In more concentrated markets, banks tend to offer worse terms to customers. The crisis has affected both concentrated banking systems (for example, the UK and the Netherlands) and non-concentrated systems (e.g., the US and Germany). In both cases, it has brought consolidation, leaving fewer players with increased market power and too-big-to-fail status. Witness the takeover by Lloyds TSB of the troubled HBOS (Halifax/Bank of Scotland) in the UK, or post-crisis consolidation in the US.

All this would not be so problematic if the increased market power of the merged institutions were a temporary reward for past prudent behavior. In that case, the benefits would wane in importance as new competitors entered the banking fray. But if banks’ market power increases due to barriers to entry, consumers and investors will suffer.

An active competition policy will be needed. But the degree to which the authorities will be able to push for more competition in banking will depend crucially on the regulatory framework. Let us fix and strengthen that framework, while bearing in mind that a simple mandate to maximize competitive pressure in banking is no more possible, or desirable, than one that would aim at eliminating instability completely.

Xavier Vives is Professor of Economics and Finance at IESE Business School.

See the original article >>

European Leaders Remain Divided, Geithner Brushed Off; German Banks Need $175 Billion Capital

by Mike Shedlock

As talks wind down in Poland, European leaders still divided on debt crisis
European leaders made little headway Saturday on resolving a banking crisis that threatens to weaken their economies and spread damage overseas to countries such as the United States.

Finance ministers from European Union nations gathered in Poland for two days of talks and even invited Treasury Secretary Timothy Geithner to their meeting to explain how the U.S. handled a similar crisis in 2008-09.

Yet EU ministers did not coalesce around any rescue plan for Greece or troubled European banks. Some also brushed off advice from Geithner, who’s urged them to stimulate their economies and act quickly to shore up their banking system.

Wealthier EU countries such as Germany have been balking at a larger bailout of Greece using public money. All EU leaders have agreed on so far is that their banks need to be strengthened by raising more capital.

“From our perspective, we see a clear need for bank recapitalization,” Swedish Finance minister Anders Borg said. “The EU banking system needs better backstops and that’s basically a matter of capital.”

The big question is where the money will come from, especially since private investors appear unwilling to risk more cash. A shortage of dollars prompted the Federal Reserve this week to engage in large currency swaps with European central banks that effectively injected more liquidity into the EU’s financial system.

Most analysts think European governments will have no choice but to use public money. Jay Bryson, global economist at Wells Fargo, said Germany “can pay now or they can pay later.”
Yes this is a case of pay now or pay later, but that is not the critical issue. Who pays, is the issue.

Bondholder should take a hit. Banks that overleveraged into Greek, Spanish, and Portuguese bonds should taker the hit not taxpayers.

Geithner, the Fed, the ECB, and the banks all want to screw taxpayers one more time, bailing out the banks at taxpayer expense. The amounts are not trivial.

German Banks Need $175 Billion Capital

Reuters reports German banks need 127 billion euros of more capital
Germany's 10 biggest banks need 127 billion euros ($175 billion) of additional capital, German newspaper Frankfurt Allgemeine Sonntagszeitung reported, citing a study by economic research institute DIW.
Bear in mind that is just German banks. French banks are also severely undercapitalized. Also note the target is a mere 5% equity ratio, implying a leverage ratio of 20-1, still hugely over-leveraged from a common-sense standpoint.

It is fitting that European leaders remain divided, because the best solution is division, a breakup of the Eurozone. Please see Eurozone Breakup Logistics (Never Believe Anything Until It's Officially Denied) for a discussion.

Navarra Region of Spain Bankrupt by End of Year "No Money to Pay Workers or Provide Services"; Electricity cut off to Spanish town over unpaid bills

by Mike Shedlock

Entire regions of Spain are in severe economic stress including Navarra in Northern Spain.

Courtesy of Google Translate, Navarra has no money to pay for commitments made this year
The Vice President and Minister of the Presidency, Public Administration and Home Affairs of the Government of Navarra, Roberto Jimenez, said that "the situation is dramatic provincial coffers and no money to pay for commitments made this year."

"There is money to pay public workers, no money to continue to provide quality public services"

"There is no money to plug holes. I'm not talking about Greece, in October and cannot pay public salaries, I'm talking about Navarra" he argued.

Navarra has in terms of national accounts "a deficit of 600 million euros," added Jimenez, who has remarked that "only now, after entry of the Government of Navarre PSN has been officially recognized."
Map of Navarra


See Wikipedia Navarra fordetails about the region.

Costa del Sol in Southern Spain Thrown in Darkness over Unpaid Bills

The Telegraph reports Electricity cut off to Spanish town over unpaid bills
Coin, near Malaga in southern Spain, is, like many towns across the crisis-hit nation, on the verge of bankruptcy with an estimated debt of nearly 30 million euros (£26m) owed by the town council.

For more than a week there has been no lighting in public areas after power company Endesa cut services because of an outstanding bill of 280,000 euros (£240,000).

Meanwhile some 500 council employees in the town have not yet been paid their August wages, it was reported.

The town of 22,000 residents has been ordered to make an urgent payment of 400,000 euros (£346,000) to the Treasury in monthly instalments to cover its debts but the mayor has said the town will be forced to file for bankruptcy.

It is a problem repeated in municipalities across Spain. In some towns, police officers have been ordered to walk to crime scenes in a bid to save costs on patrol cars.

On Tuesday rating agency Moody's warned that Spain's regions could fail to meet their deficit-cutting targets, a move considered necessary for the nation to meet the EU-agreed public deficit ceiling of 3 per cent of GDP by 2013.
Austerity Stranglehold

Does anyone really think austerity measures are going to help Spain reach its deficit ceiling targets by 2013?

Is the plan then to suck Spain dry before it defaults?

More than likely "sucking Spain dry" will be the end result of delusional bailout attempts rather than the plan. From the point of view of Spain, it loses regardless.

The Central Banks Are Losing Control

by Graham Summers

The market is rallying on short-covering and the usual options expiration manipulation. It’s now obvious traders are gunning for 1,200 on the S&P 500. We were at 1,140 o the S&P 500 only three days ago. A 5% move in just two days is not healthy nor is it good for the market as a whole.

The economic and fundamental backdrop today is absolutely terrible. Retails sales were negative when you account for inflation. The Philly Fed index missed again. Last month we didn’t add a single job for the first time since 1945. And on and on.

The bond and credit markets are now pricing in an economic depression while stocks are roaring as though the recovery is fully in place and we’re going into another period of sustained economic growth. Which one are you going to believe?

Given that stocks mis-read the 2007 recession, the 2008 liquidity Crisis, the Euro Crisis, Greece, and the ongoing US depression, we’d suggest not betting on stocks being right this time.

The primary problem is that the world Central Banks continue to intervene to prop the markets up. We had a global intervention earlier today… forcing the US Dollar to collapse while the Euro soared.

This is an act of desperation. It is essentially an admission on the part of the Central Banks that Europe is in a full-scale liquidity crisis a la pre-Lehman.

Indeed, what’s truly amazing is to see stocks rallying on news concerning Greece… at the same time that Greece bonds are pricing in a default with 100% certainty. Makes you wonder just who is buying stocks at these levels.

Could the Fed be forcing stocks higher in anticipation of a Greek default just as it bought the market following its disappointing August 9 and Jackson Hole announcements? Or could the Fed be juicing the market higher because no QE 3 is coming next week at its FOMC meeting?

The primary point is this: stocks have been notoriously wrong on most economic developments for well over 3 years. The larger, more liquid credit and bond markets are forecasting an absolute disaster is about to unfold.

Indeed, I fully believe we‘re on the eve of another 2008-style Crash. All the signs are there. Whether it’s a Greece default, Societe General going under, or some other event, the markets are on DECON Red Alert.

SPY Trends and Influencers – September 18, 2011


Last week’s review of the macro market indicators looked for the week to be positive for US Treasuries ($TLT) and the US Dollar Index ($UUP). Gold ($GLD) looked biased higher and Crude Oil ($USO) lower, but both could also continue in the respective bull and bear flags. The Shanghai Composite ($SSEC) and Emerging Markets ($EEM) continued to favor the downside. Volatility ($VIX) looked to remain elevated with a bias towards heading higher. This backdrop suggested favoring a downside bias in the US Equity Index ETF’s $SPY, $IWM, and $QQQ. They might continue to hold their bear flags but a big push higher in the US Dollar Index and US Treasuries would likely push Volatility higher out of its range and lead to the Equity flags breaking lower.

The week began with the US Dollar and US Treasuries rising only to have both pullback later in the week. Gold moved lower but remained in the broad range while Crude Oil moved higher. The Shanghai Composite did run lower while Emerging Markets consolidated at their low from the prior week. Volatility spiked Monday before falling back but remaining elevated. The Dollar Index stall and Treasury Bond pullback lead to a sizable rally in the Equity Index ETF’s. How does this impact the coming week? Lets look at some charts.

As always you can see details of individual charts and more on my StockTwits feed and on chartly.

iShares Barclays 20+ Yr Treasury Bond Fund Weekly, $TLT

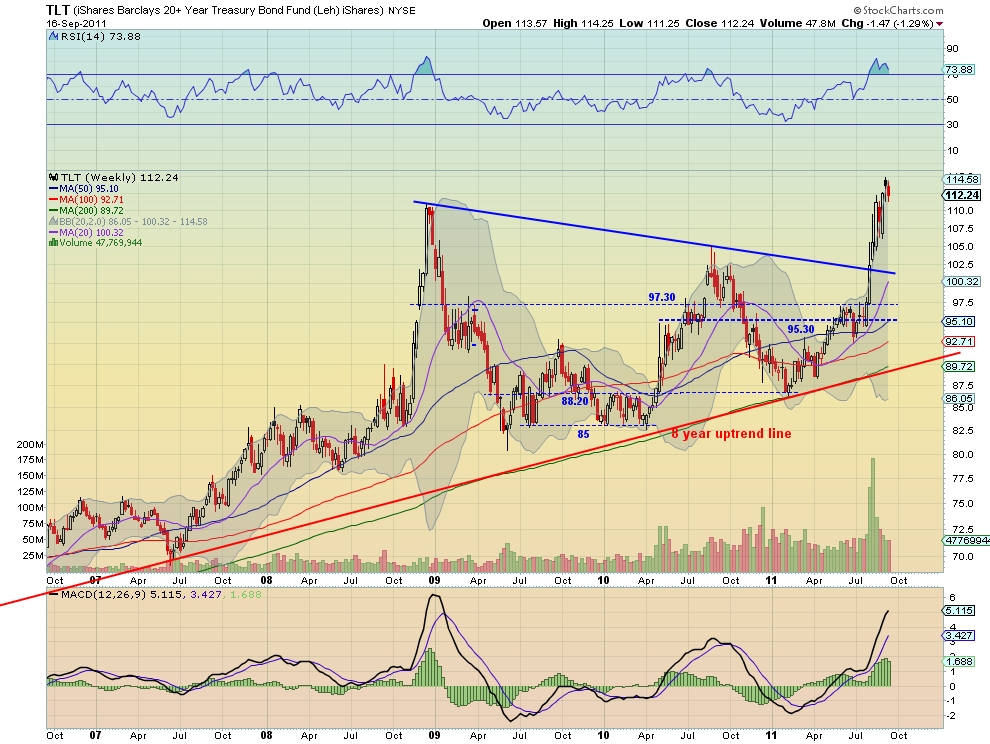
US Treasuries, as measured by the ETF $TLT, held the gap higher this week. The weekly chart shows the gap filled from the previous week with a Relative Strength Index (RSI) that is working off an overbought condition and a Moving Average Convergence Divergence (MACD) indicator that is starting to fall. The charts set up for the $TLT to pullback next week. There is support at 109.30 and a gap at 108.98 before stronger support at 106. Consolidation there could lead to the next move higher and completion of the flag target at 120.70 and the symmetrical triangle break at 137. Below it watch out.

SPY Daily, $SPY

SPY Weekly, $SPY

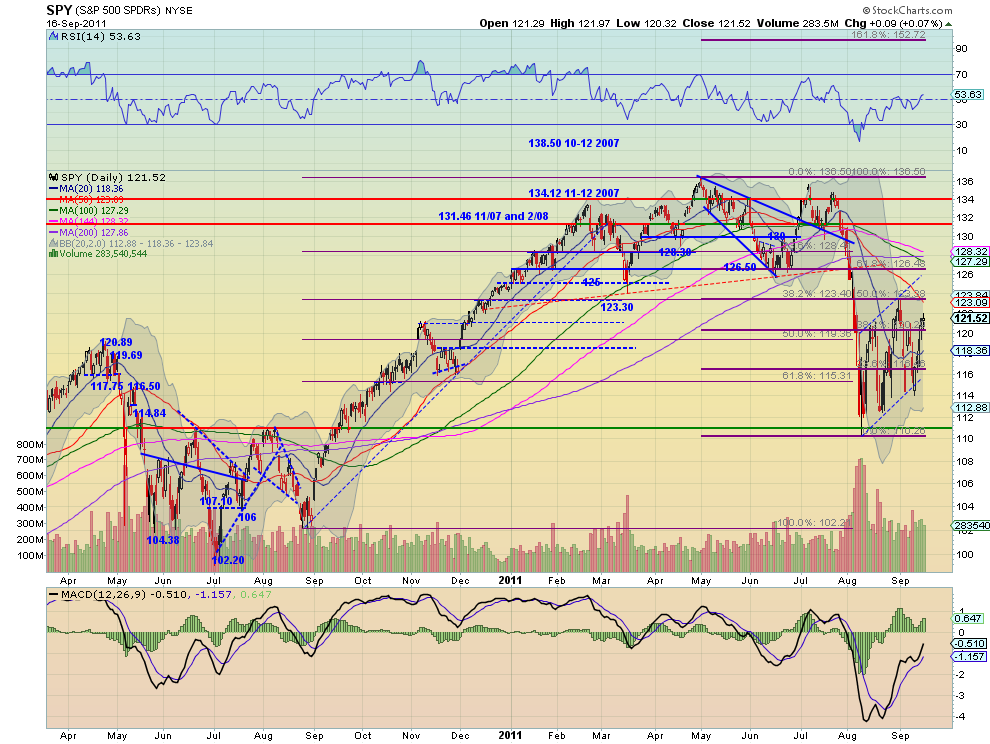
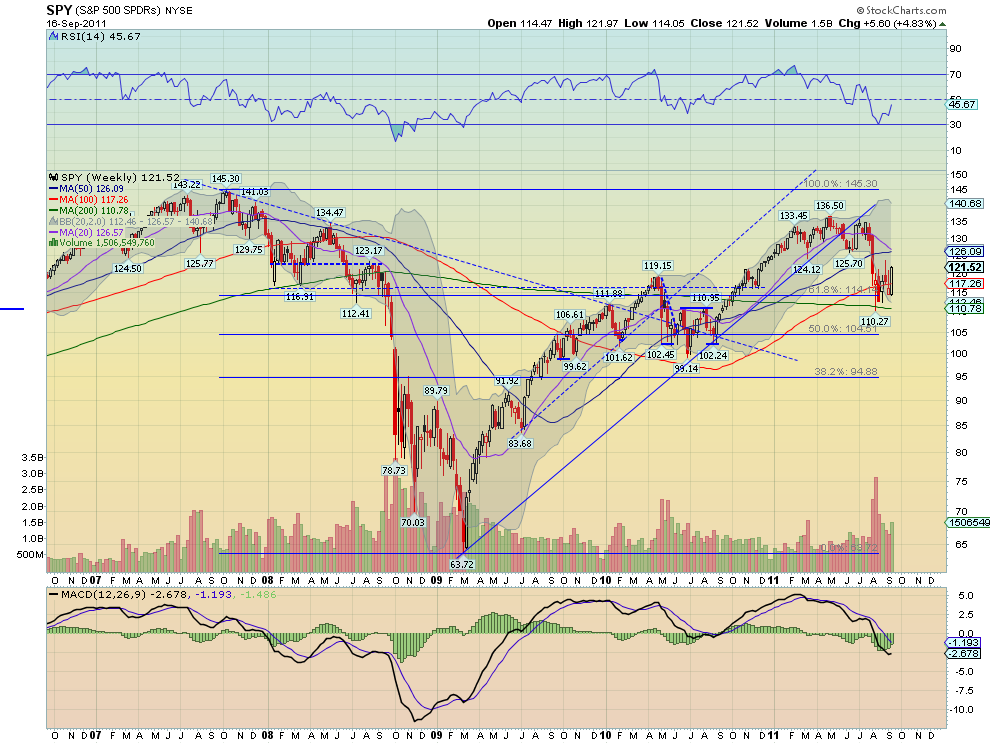
The SPY continued to move higher in the broad flag or channel finishing the week with a long and strong bullish candle on the weekly chart. The RSI on the weekly chart is rising and the MACD is improving, but the 20 week SMA is about to cross down bearishly through the 50 week SMA. On the daily chart the RSI and MACD are both rising as well, but the same weakness of falling SMA’s, all but the 200 day SMA on this timeframe, temper the euphoria. Look for continued upside in the channel next week with a move over 123.40 finding resistance at the top of the channel. Over that and it is time to get bullish. A move lower should find support the flag and channel at 114 before it becomes a screaming short with a target of 95.

Next week looks to bring more consolidation for Gold in a broad range, but with the bias to the down side if forced to pick a break direction. Crude Oil, the US Dollar Index and US Treasuries all also look to be headed lower in the short run. The Shanghai Composite looks to continue lower while Emerging Markets consolidate further. Volatility looks to remain elevated with any break bias to the downside as Equity Index ETF’s SPY, IWM and QQQ are set up to extend their gains. The QQQ is by far the strongest of these index ETF’s and should be watched for broad direction. Use this information as you prepare for the coming week and trade’m well.

See the original article >>

Commodities May be Forecasting Lower Inflation


Inflation expectations impact Commodities. After recent runs higher some of these high flying commodities have been getting hit a bit lately. Some of this would be expected with the run up in US Treasury prices, dropping yields, acting similarly to squelching some inflation expectations. But that aspect may have run its course as Treasuries stall this week. So what do the charts say now about Coffee ($KC_F), Corn ($ZC_F), and Sugar ($SB_F)? And do they give a clue about inflation expectations? Let’s take a look.

Coffee, $KC_F

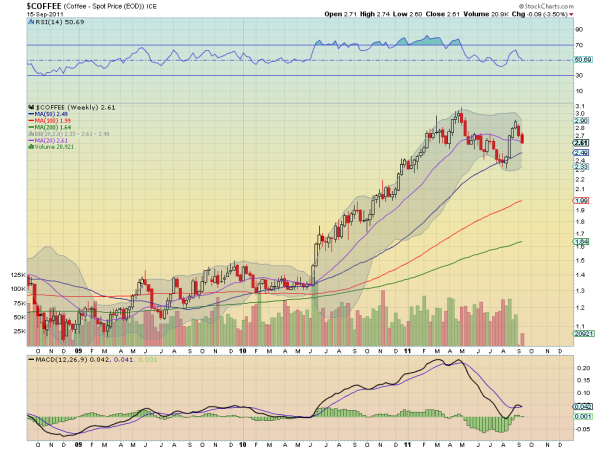
Coffee, $KC_F, had a massive run higher from June 2010 until May of this year. Since it has pulled back and then attempted to move higher again. The weekly chart above shows it now pulling back to the 20 week Simple Moving Average (SMA) at 2.61 as of Thursday close and it is dropping further Friday, at 2.58 as I write this. The Relative Strength Index (RSI) sloping lower and the Moving Average Convergence Divergence (MACD) crossing negative support more downside. Look for a continuation lower that may find support at the rising 50 week SMA, but if not then a target on the Measured Move (MM) to 2.13. Coffee has been inversely correlated to Coffee stock like $GMCR, $CBOU, $SBUX and $PEET so watch them for more upside if the decline continues.

Corn, $ZC_F

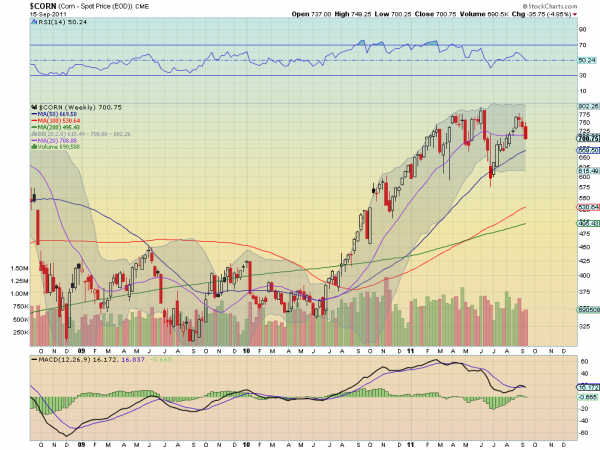
Corn, $ZC_F, had the same run higher that Coffee saw complete with the pullback and push higher again. It also has the acceleration to the downside now, under the 20 week SMA and moving lower Friday at 698 as I write. A push back over the 20 week SMA would help but with the RSI heading lower and the MACD crossing negative it is set up for more downside. A continued fall sees support near the rising 50 week SMA at 663 and below that it has a MM to 556. This same pattern is being played out in the Teucrium Commodity Trust Corn Fund, $CORN, and can be played that way.

Sugar, $SB_F

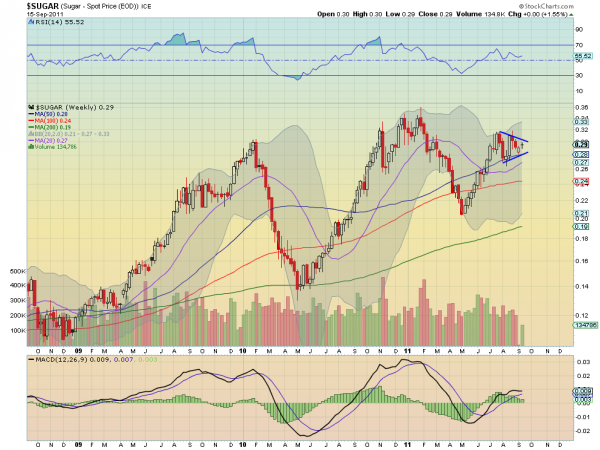
Sugar, $SB_F, had the same run higher from mid 2010 to early 2011 and the pullback and advance, but has been in a tighter symmetrical triangle the last few months. As I write this it is trading at 0.28 which would be close to triggering a break down from the pattern, ad is below the 50 week SMA. The RSI has stalled in the move lower near the mid line and is turning higher for now, but the MACD is fading lower. All the SMA’s are rising though. This looks to go either way. A continued move below 28 triggering the pattern break would see a target of 0.23, under the 20 week SMA but where there is support from April. If the pattern holds the the top rail at 0.30 is resistance and a break above that triggers a target of 0.35, near the previous high from February. This pattern is playing out with the iPath Dow Jones-UBS Sugar Subindex Total Return ETN, $SGG, so it can be played via the equity market as well. In fact, $SGG looks a bit weaker.

Each of these commodities is set up to continue lower, despite the stall and now move lower in US Treasuries. This could be a signal that inflation expectations are moderating. Only time will tell.

Copper Says the Markets Still Suck….Everywhere


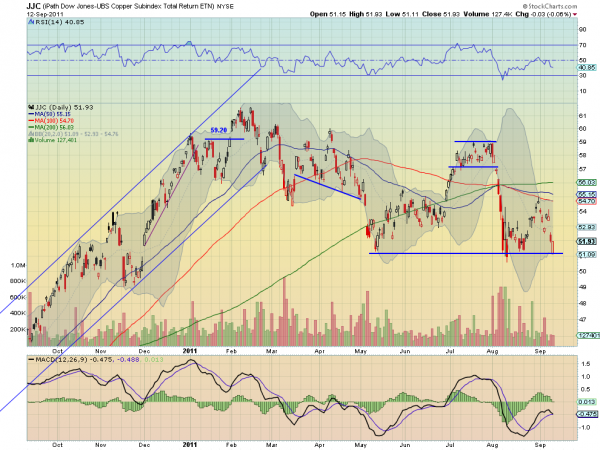
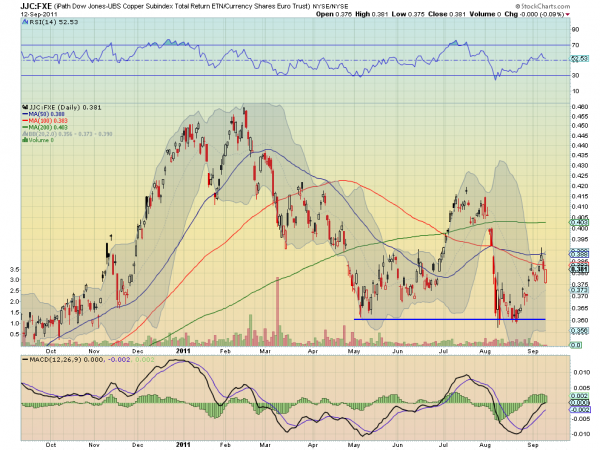
Many use Copper as a tell on the future direction of the market. So what does Copper say about the current market? Using the iPath Dow Jones-UBS Copper Subindex Total Return ETN, $JJC, it is not a pretty picture. The chart below shows that it is testing support at 51 for the fourth time

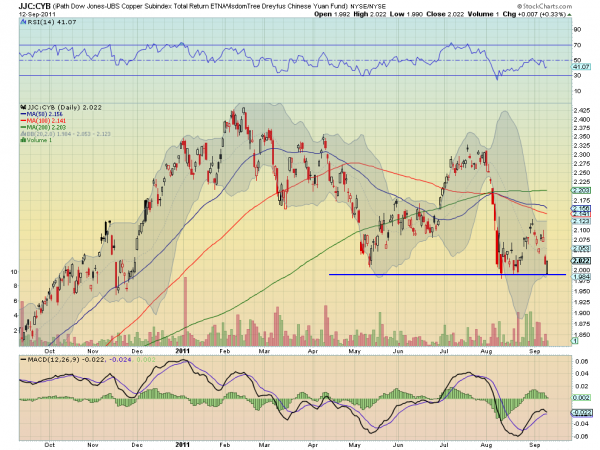
since May. And as it does the Relative Strength Index (RSI) has rejected at the mid line and is heading lower and the Moving Average Convergence Divergence (MACD) is about to cross negative. Translation: On support but set up to go lower. But the US is not the only place in the world that uses Copper. China is supposed to be a growth engine. What doe Copper look like priced in Yuan? The ratio chart below translates the $JJC into Yuan using the WisdomTree Dreyfus

Chinese Yuan Fund, $CYB. This is also testing support, with deteriorating technicals. Hard to say that the Chinese are drag the world out of the economic morass from looking at the demand for Copper in Yuan. But what about that block of people in Europe working and trading together as an economic unit? The ratio chart below of the $JJC against the the Currency Shares Euro trust, $FXE, translates Copper into Euro. Although it has been in an uptrend for two weeks and now holding above the gap support at about 0.375, the RSI and MACD are pointing to a move lower. Perhaps it will also move back to test support at 0.36. Nothing strong about that.


The Week Ahead: Can Doom and Gloom Save the Market?


As often happens, strong bearish sentiment helped boost the market all week, but it’s best to wait to buy until a pullback occurs, which could come as early as mid-week, writes MoneyShow.com senior editor Tom Aspray.

The stock market got very close to the key levels in the major stock ETFs Monday, and then spent the rest of the week rebounding. This was in spite of very little in the way of positive news, either on the US economy or the Euro debt crisis.

As this sampling of financial headlines reflects, there was little to cheer about:
  • Europe Lending Woes Deepen
  • Economy Clips Factories
  • Greek yields off the scale as 3-year bond hits 172%
  • Number of Americans in poverty at highest in 50 years
Some of the Euro pain was lessened last Thursday, after the world’s central bankers moved to offer unlimited dollar funding through the end of the year. This helped the hard-hit European banks, especially those in France, to rebound.

The news on our economy was not a big help. Retail sales were flat and Best Buy (BBY) reported 30% drop in income for the second quarter. Retail sales were hurt by the several days lost because of Hurricane Irene.

A recent survey of economists by The Wall Street Journal sees a 1 in 3 chance the US will slip into a recession. They also put even odds that the euro would breakup.

The Conference Board was even more negative on the economy, as they see a 45% chance that there will be a recession.
chart
Click to Enlarge

The Michigan Consumer Sentiment Index, released last Friday, shows a slight pickup from August’s dismal numbers. This chart from the Business Insider shows that consumer sentiment is already at levels seen in past recessions.

By the time this index drops below 60, GDP has already turned negative. While almost all economists are still downgrading their GDP forecasts to the 2% to 2.5% range, few are negative.

In light of all this, most were surprised that the Spyder Trust (SPY) was up 4.8% for the week, while the tech heavy PowerShares QQQ Trust (QQQ) led the way with a 6.4% gain.

Clearly, sentiment has shifted—the Investors Intelligence survey of newsletter writers shows that only 35.5% are bullish, compared with over 57% in early April. Also, 40.9% who are bearish, which is not far from the 47.2% level that was recorded near the March 2009 lows.

Another reading of sentiment comes from the option activity. Option expert Larry McMillan reports that put/call ratios have turned positive, as too many are buying puts in expectations of another sharp market decline.

Therefore, stock investors will be helped by an increased feeling of pessimism about the stock market and the economy. As I discuss further below, there has been some technical improvement.

The IMF meeting may set the tone for Monday’s opening. Tuesday, we get the housing starts as well as the start of the FOMC meeting. Wednesday’s existing-home sales numbers are likely to have much less impact than the FOMC announcement in the afternoon.

A clear majority of economists expect the Fed to do something. The prevailing choice is what is being referred to as “Operation Twist,” where the Fed exchanges shorter-dated Treasuries for bonds in an effort to drive down long-term rates.

However, the dramatic rally in the US bond market suggests this already may be priced in.

WHAT TO WATCH

One of last week’s casualties was the euro. Watch it closely this week, because a further break could exacerbate the Eurozone problems. Gold had another sharp setback last week, but finished the week strong and well off the lows.

The stock-market rally last week clearly improved the technical outlook, as many of the major averages came very close to key support on last Monday’s opening. Further strength is needed this week to signal a rally above the prior highs, which would likely stop out a few of the short positions.

After the current rally runs its course, the following pullback will be important. It will give us a better idea of whether a test of the August lows lies ahead.
chart
Click to Enlarge

S&P 500
 
The Spyder Trust (SPY) made it up to $121.97 on Friday, which was just below the prior closing high. Traders likely have stops now above $123.51.

The upper boundary of the flag formation (line a) and the 61.8% Fibonacci retracement resistance is at $126.85. A daily close above this level will suggest that the August lows will hold.

Monday’s low at $114.05 briefly violated the lower support from the flag formation (line b) at $114.38. There is short-term support now at $119, with stronger levels in the $116 to $116.60 area.

The number of advancing issues was strong last week, as the S&P 500 A/D line has moved slightly above its downtrend (line c). It needs to rally higher to suggest that a short-term uptrend is in place.

It is important that key support (line d) holds on any correction.

Dow Industrials
 
The Spyder Diamonds Trust (DIA) dropped below support at $109.18 on Monday, down to a low of $108.15, before reversing to the upside. The next level of resistance to watch is between $115.30 and $117.03, which was the high of the previous rebound.

The 50% retracement resistance stands at $117.78, with the trendline resistance (line 3) at $118.60.
 
First support for DIA is now at $113, with stronger levels in the $109.90 to $112 area.

The Dow Industrials A/D closed for one day below the long-term uptrend (line h) before reversing. It closed Friday just barely above the near-term resistance. A move well above the prior peak will improve the technical outlook.
chart
Click to Enlarge

Nasdaq-100
 
The strength in the PowerShares QQQ Trust (QQQ) got the market’s attention last week, as it gained 6.4%. QQQ was able to close above the 61.8% retracement resistance at $56.07 last Thursday.
In Friday’s article, I took a close look at not only the PowerShares QQQ Trust (QQQ), but also the Select Sector SPDR Technology (XLK), Semiconductor HOLDRs Trust (SMH), and Apple (AAPL). The particularly bullish action in AAPL, a market leader, is a positive for the overall market.

Friday’s high was very close to the start of the next resistance at $56.80 to $57 (line a), with the 78.6% retracement resistance next at $57.71.

There is initial support at $55.20, with stronger support sitting at $54 to $54.50. A close below Monday’s lows of $52.57 would suggest the rally is over.

The Nasdaq-100 A/D line is acting the strongest, as it has convincingly broken its downtrend (line c) and has moved above the prior peak. This is consistent with a bottom formation. This was the only A/D line to hold above the 2011 support.

Russell 2000
 
The iShares Russell 2000 Index Fund (IWM) was up almost as much as the QQQ, but the chart still looks weaker. If we have begun a sustainable new rally, then the small- and mid-caps should eventually start to outperform.

There is next resistance at $72.50 to $73.84, with the major 50% retracement resistance at $74.82. Support now sits at $66.37 to $65.93, which if broken will signal a drop to the major 50% support at $60.54.

The Russell 2000 A/D line continues to look quite weak, as it dropped to new lows before last week’s rebound. It is still well below the previous highs.

Sector Focus
 
All of the major sectors were higher last week, but only technology was able to overcome the previous highs. The Select Sector SPDR Utilities (XLU) was a bit lower Friday, but it still looks like one of the strongest sectors.

For a healthy market, we need more than just these two sectors to push prices higher. It is possible that the Select Sector SPDR Consumer Staples (XLP) and Select Sector SPDR Health Care (XLH) will be able to breakout above the previous highs.

Oil
 
November crude oil held up well last week, and has reached the apex of its triangle formation. Therefore, an upside breakout above the resistance at $90.52 would be suspect.

The daily chart shows an apparent flag formation, which is likely just a pause in the downtrend. There is initial support now at $85, which is almost $3 below Friday’s close. A daily close below the $83.20 level would be more negative.

Tech Buying Opportunity Ahead


Chart patterns indicate that an upcoming pullback in the tech sector will be well supported, providing a good opportunity to go long select sector ETFs and stocks.

While the S&P 500 and Spyder Trust (SPY) have failed to surpass the 50% retracement resistance from the May highs, the Nasdaq 100 is a different story. Technology stocks have been getting lots of press lately, and many hope that this sector will help turn the market around.

Though the Nasdaq 100 is made up of both technology and biotech stocks, it is the technology space that has been getting the most attention. A closer look at the market internals for the Nasdaq 100, as well as the key chart points and the sub-industry tech groups suggests that we should get a pullback in the next week or so that will provide a better risk/reward entry level for those who are not already long.
chart
Click to Enlarge

Chart Analysis: The daily chart of the PowerShares QQQ Trust (QQQ), which tracks the Nasdaq 100 index, shows that it closed above the 61.8% Fibonacci retracement resistance on Thursday. This suggests that decline from the July highs is over.
  • There is next resistance at $56.80-$57 (line a) with the 78.6% retracement resistance at $57.71
  • The McClellan Oscillator broke its uptrend, line c, on September 1. This is often a negative short-term signal, but the oscillator has been able to hold above the most recent lows
  • There is initial support at $55.20 with stronger support at $54-$54.50
  • The daily uptrend, line b, is now at $53.30
The weekly chart of the Select Sector SPDR – Technology (XLK) shows that there is next strong resistance in the $25.30 area, line e. There is major resistance in the $26.80 area, line d.
  • The weekly relative performance, or RS analysis, broke its major downtrend, line f, in late July
  • As I noted in mid-August, the daily RS analysis was positive and was forecasting the recent strength
  • There was heavy weekly volume on the early-August decline and the weekly on-balance volume (OBV) is still below its weighted moving average (WMA)
  • The daily OBV (not shown) is above its weighted moving average and has just moved above trend line resistance
  • There is initial support now in the $23.80-$24.20 area with more important support in the $23-$23.20 area
chart
Click to Enlarge

The Semiconductor HOLDRs Trust (SMH) has rallied 12.7% in the past seven days from the low at $27.28. It is already close to the 38.2% retracement resistance at $31.16.
  • The more important 50% Fibonacci resistance is at $32.30, which also corresponds to strong chart resistance
  • The daily downtrend, line a, and the 61.8% resistance are in the $33.20-$33.50 area
  • The daily RS has broken its downtrend, line b, consistent with the recent strength. Typically, if this is a major bottom, we should see a pullback in the RS over the next week
  • Volume has been strong over the past week but the OBV is still well below its downtrend, line c
  • There is first good support in the $29.30-$29.60 area with stronger resistance in the $28.40 to $28.60 area
One of the tech sector leaders, Apple, Inc (AAPL), completed its bull flag formation (lines d and e) on Wednesday. As I noted in a recent article on flag formations, the potential upside targets were either at $404.50, which was the recent high, or the 127.2% retracement resistance target of $418.90.
  • The OBV has confirmed the upside breakout, as it moved through resistance, line f, one day ahead of prices. The OBV has longer-term support at line g
  • The weekly OBV (not shown) is positive and above its weighted moving average
  • There is first support for AAPL at $380-$382 and the 20-day exponential moving average (EMA). There is stronger support in the $366-$372 area
  • A close below $355 would call the flag formation into question
What It Means: The positive action in the Nasdaq 100 has turned the focus on the technology and biotechnology areas. A rally back to the +160 level in the McClellan Oscillator (now at +103) could mark a short-term top.

The technical action suggests that the next pullback will be well supported. This should provide a good entry point for those who are looking to establish new long positions in the technology sector. Buying in at current levels seems to carry excessive risk and patience would be warranted.

How to Profit: As previously recommended in the August article, buyers should be 50% long the Select Sector SPDR – Technology (XLK) at $23.57 and 50% long at $23.12, as the low was $22.47. Raise the original stop from $21.74 to $22.84, sell half the position at $25.94 or better, and raise the stop on the remaining position to $23.57.

Those who are not already long XLK could buy at $24.12 with a stop at $22.84 (risk of approx. 5.2%).
For the PowerShares QQQ Trust (QQQ), go 50% long at $54.62 and 50% long at $53.62 with a stop at $49.80 (risk of 7.9%).

For the Semiconductor HOLDRs Trust (SMH), go 50% long at $29.46 and 50% long at $28.78 with a stop at $26.93 (risk of approx. 7.5%).

For Apple Inc. (AAPL), go long at $385.80 with a stop at $357.20 (risk of approx. 7.3%). On a move above $396, raise the stop to $369.30.

TIME FOR A RALLY IN UNLOVED HOUSING STOCKS

by Tom McClellan

Sentiment could not be much worse for the U.S. housing market than it is right now. And why shouldn’t people be pessimistic? All of the governmental efforts to stimulate a housing rebound, so people start thinking that if the government cannot fix it, what can?

Meanwhile, most people are unaware of a major rebound brewing for the home building stocks. That is because most people are not readers of our publications.

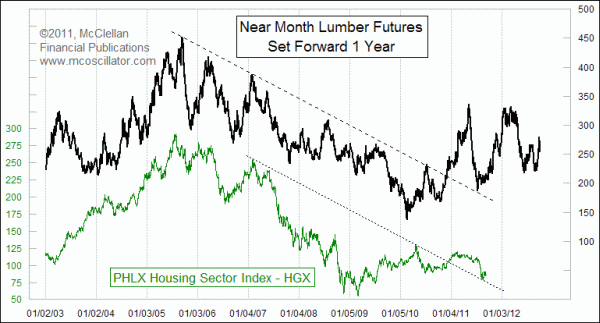
This week, I’m revisiting a topic addressed here before, concerning the way that housing stocks tend to follow in the same footsteps as lumber futures prices. The price plot of lumber futures has been shifted forward in the chart by a year to reveal how the same patterns tend to show up in the PHLX Housing Sector Index HGX about a year later. It is not a perfect correlation; it is merely very good.
Lumber prices leading indicator for housing stocks
A year ago, lumber prices were finishing the bottoming process after pulling back to test the top side of a broken declining tops line. Lumber prices then surged into early 2011, which means that we should expect the HGX to see a similar surge into early 2012.

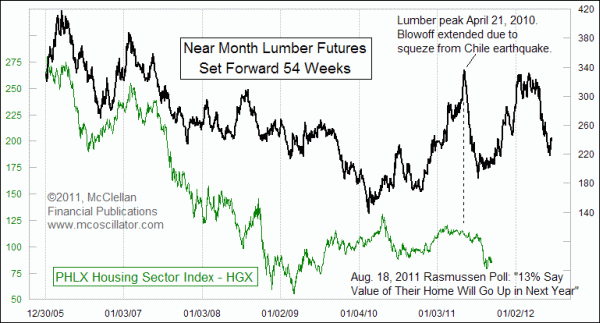
This next chart looks at the same relationship, but zooms in closer.
Lumber's leading indication for housing stocks
One important point to notice is that the lumber price top a year and a half ago was a lot sharper of a blowoff move than what ended up being seen in the HGX’s own topping structure. There is a very good reason for this. At the end of an ordinary up move in lumber prices, the Maule earthquake struck Chile on Feb. 27, 2010. That earthquake shut down lumber operations in that country, disrupting supplies and sending lumber buyers scrambling for alternate sources.

Once the lumber and other markets had a chance to recover, prices normalized and came back down from that sharp blowoff top. The HGX decline in 2011 matched the timing of the lumber decline in 2010, but not the magnitude.

The lessen here is that lumber tends to respond a year ahead of time to the economic forces which will strike the housing market a year later. I liken this to a wave passing under the end of a long pier. The same wave eventually strikes the beach, and so if you know the length of the pier and the speed of the wave, you can know when the wave will hit the beach.

The same economic wave which caused a decline in housing stocks in 2011 had caused a decline in lumber prices a year earlier. Lumber’s price pattern also reflected a temporary anomaly from the Chile earthquake, which was not a factor that affected housing stocks. That’s the hard part with using a leading indication like this, or any of our other Liquidity Wave relationships: one has to figure out which movements are due to economic forces, and which are due to something putting a thumb on the scale.

Lumber’s price rally in late 2010 was not due to any one-time factors like earthquakes, and so it seems much more likely to have its full echo observed in the prices of home builder stocks.

The Coming Age of Defaults

By Guest Author

The Dismal Optimist started out as a simple letter sent out to clients and friends. Without any advertising, its circulation has reached the point where it has outgrown its simple Hotmail format. My daughter CC, who is a designer and art school graduate, has be complaining to me for months that it needed a more professional look. She has redesigned the format and this is the new look.
~~~~

The Coming Age of Defaults

“Some people actually believe government can create jobs by taxing and borrowing from people with jobs and then giving that money to people without jobs. They call this demand stimulus. To make matters worse, other people think these demand-stimulus ideas warrant a serious response.” -Arthur Laffer, Wall Street Journal, Sept 12, 2011

“It’s a good idea to save your money. One day it might be worth something again!” -Alfred E Newman

The Euro – Free At Last?

As I began to write this, the media was reporting that Greece was on the verge of default. I started to write “let’s do it!” Default of one sort or another may be the only way out not just for Greece but for a vast majority of borrowers in the Western world. In my opinion, a Greek default need not bring the end of the euro.

Unfortunately, it now looks like Greece will get bailed again and the country’s default will be put off. All of the top European leadership apparently believes the survival of the euro depends on Greece not defaulting. German Chancellor Angela Merkel, along with French President Nicolas Sarkozy, is doggedly trying to avoid a Greek default. I applaud Merkel’s steadfast backing of the euro concept and European unity. But deep in her East German heart, she doesn’t trust markets or her own electorate for that matter. It’s too bad.

As I look forward, what I see is the coming end of the populist/socialist welfare state. It’s not going to be pretty but depending on the medicine taken, brighter days could lie ahead. The euro crisis is about much more than the euro. Massive unpayable debts and obligations have been accrued by all Western countries and their citizens. Default is the only way out. Investors have to be sure that they are not the ones defaulted on.

The populist/socialist state will need drastic alteration. The bond markets will force this. Intellectually Europe (and to a lesser extent America) is of the left. Barring a massive fiscal conservative sweep in the US 2012 elections, alteration of the populist/socialist welfare state won’t be initiated by politicians. Witness the continued political theater on this subject in the United States. Universal suffrage- based European electorates, along with those of the US and Japan, have voted themselves a cornucopia of welfare benefits. Let the rich pay, we are entitled. The coming demographic tsunami of old people supported by fewer and fewer of their adult children makes this an untenable situation. The days of cornucopia are over.

Dismal vs. Optimist

People have complained that this essay is all “Dismal” and no “Optimist.” Let me set that straight. The long run outlook for humanity (including investors) is bright. While the debt crisis looms and markets are going haywire, globalization and technology will march on as indeed they did even in the dark days of the Depression and WWII. Asia in particular will become a locus of technological progress as millions of Asian scientists and entrepreneurs join the global economy. Smart young Americans and Europeans may migrate to Asia if the US and Asia make the wrong decisions on the debt crisis. In any case American tech firms will become more and more Asian in terms of their own employees and facilities locations.

I have long been a fan of Ray Kurzweil who has written about the law of accelerating returns. Essentially Kurzweil sees technology as accelerating and taking over human evolution. (Kurzweil sees homo sapiens as eventually being replaced by Artificial Intelligence successors. Some people are put off by this. But you don’t have to buy that to accept Kurzweil’s insights on accelerating human progress) The global internet and computer technology links the millions of new minds and entrepreneurs and accelerates progress and technology.

America is renowned for its innovation and technology. If the right decisions are taken as a response to the coming debt crisis, that will continue. Emerging Asia is a growth technology center. Longer run, these are the areas that will reward investors.

What Europe Should Do

Since the beginning of the Greek crisis I have been arguing that Greece, like the American states in the 1840s, should be allowed to default and that the euro would come out of such an event stronger. I have argued that the euro represented a tremendous value-added in both economic and political terms and that the force of history was behind it. Turning the clock back would be a catastrophe.

Unfortunately the Europeans so far have managed to do all the wrong things. Once viewed as the Bundesbank reincarnated, the European Central Bank (ECB) has shed that image and has been buying the bonds of the so-called GIIPS countries (Greece, Italy,Ireland,Portugal and Spain—slightly more polite than PIIGS). Now Europe is in the throes of putting together a second bailout for Greece. The new European bailout fund, the European Financial Stability Facility (EFSF), if it is going to bail out countries, is a giant step in wrong direction. Germany, the strong economic man of Europe, will be turned into an ATM machine. Needless to say, the German electorate is less than overjoyed at this and the German electorate is rebelling.

In the twentieth century, catastrophe was something the Europeans seemed to seek out. In 1909 Norman Angell wrote a book called The Great Illusion in which he argued that war among the European powers was outdated and unthinkable because its cost would be so high. He was dead right. Unfortunately in 1914 Europe went on to have its war anyway and then for good measure went on to have an even worse one twenty years later. It made a special effort to massacre its Jewish population, which was in the vanguard of science and finance. In 1914 Europe (including the UK) ruled the world. By mid-century Europe was a morally and financially bankrupt force. Who is to say the Europeans will not choose catastrophe again?

I know that Milton Friedman and Martin Feldstein, recognized gods in the economic profession and both heroes of mine, predicted trouble for the euro. They assumed a European currency in the absence of European political union would eventually founder. So far they are looking pretty prescient. Nevertheless, perhaps with more hubris than brains, I would argue that the euro can get by the current crisis without taking the step towards further political unification.

Here’s how Europe can do this:

1. Embrace the rule that each member state must be responsible for its own fiscal affairs. No sovereign bailouts. Bailouts are just throwing good money after bad. Let the Greeks and all the others default. Let the markets impose the discipline, not the Germans. The weaker member states will simply have to live within their means. They have been living beyond their means since the euro began. They should not be able to rely on a German ATM machine. Somehow the Europeans have lost sight of the concept of responsibility. In this case, it should be the obligation of each member state to conduct its fiscal policy responsibly. The world and Europe needs the euro. The market has finally learned there is a difference between Greek and German debt, even if they are both denominated in euros.

2. Each country should recapitalize its own banks if these banks cannot raise capital on their own. The IMF and the EFSF should step in and help the weaker countries who cannot afford to fully recapitalize their own banks. The banking system cannot be allowed to collapse. The operative word for Europe should be “T A R P”. Thanks to Basel II which treated each member country’s sovereign debt as a risk free asset, the banks of Europe are stuffed to the gills with European sovereign paper. Basel II provided a perverse set of incentives for the bankers to toss risk analysis to the wind. Along the same lines, stress tests that didn’t haircut sovereign debt are an intellectual fraud and a joke. There is a substantial likelihood that a significant number of European banks are insolvent on a genuine market to market basis. IMF chief Christine Lagarde hit the nail right on the head when she ruffled feathers and called for capital injections into the European banks.

3. No country should be encouraged to leave the euro. But the Greeks and others should be allowed to make that decision on their own. I think they will choose to stay in the euro. For any departing country, this would entail the forced conversion of euros into some kind of devalued new national currency. True this would be a type of default. I just argued default is necessary. But I don’t think any European government has the political will to default on its own citizens in such a manner. The Greeks would burn down Athens. And Greece would still owe its sovereign euro denominated debt, upon which it will default anyway. A Greek departure would engender a bank run of unthinkable proportions in neighboring GIIPS countries. (As it is, I don’t understand with all this talk of weaker countries exiting the euro why any Italian or Spaniard or Greek with a brain would leave his or her euro deposits in one of their national banks.) Greece exiting the euro for a bank depositor means a giant capital loss when his or her deposits are forcibly converted into the new debased currency. Staying in the euro means that Greece and the other weaker countries will have to adjust their wages and prices to more competitive levels. I think this is an easier task than a monetary scorched earth policy that leaving the euro will require. The idea of an independent Greek central bank replacing the ECB is not believable. It will turn into a money printing machine and the new drachma will be avoided by all. Greece is not Argentina. In 2002, Argentina got away with breaking its dollar link and devaluing its citizens’ bank accounts. But Argentina is located at the end of the earth. Its citizens had nowhere to go. And Argentina as a major agricultural country got lucky. China was there to buy its exports. Greece is in Europe. No agriculture. They can’t sell China the Acropolis.

4. Problems with the euro payment system have to be addressed. This problem is described in detail in a recent paper entitled “Europe on the Brink” from the Peterson Institute. According to this report, obligations of over three hundred billion have been incurred by the GIIPS central banks to the German central bank. According to the Peterson report, the ECB has effectively guaranteed these obligations. But this form of backdoor financing for the GIIPS should be ended.

5. The ECB should provide liquidity to the European banking system which will be needed during the turbulent months ahead as Greece and possibly other countries need to restructure their debts. The just announced support for the ECB by other central banks is a positive step towards maintaining a functioning banking system. The ECB will be needed until the sovereign debts are restructured and the banks are recapitalized. Bank liquidity not solvency should be the ECB’s problem.

6. Bloated governments have to be cut and growth oriented supply side policies implemented including tax simplifications and reductions, privatizations and the elimination of regulations. The austerity plan imposed on Greece with its tax increases is already killing growth. Warren Buffet excepted, no sane citizen is going to be happy to pay more taxes to finance a bloated welfare state. Regardless of whether Greece stays in the euro or not, if the Greek government doesn’t implement growth policies the best and the brightest of Greece will emigrate. Greece as a country will be finished.

Investment Survival in a World of Near Term Chaos and Long Term Technological Progress

Investing in the current environment is extremely difficult. Short rates are near zero and returns on cash inflation-adjusted are negative. Extreme volatility has become the new normal. The Fed and other central banks have recklessly thrown caution to the wind with their various quantitative easing programs. And the prospect of global defaults lies ahead. The US and Europe are verging on a new recession. Asia faces inflation and at least a slowdown. There’s no place to hide.

I continue to see recommendations that investors buy emerging market and American tech stocks. The former are located in countries without excessive levels of sovereign debt and with relatively high GDP growth rates. The latter have loads of cash, in some cases pay significant dividends, have come down price and, as I have argued, technology is accelerating. The trouble is that near term—and that means the next year or so at least—nobody can promise that a drop in stocks similar to 2008 cannot happen. Long term investors may be able to ignore a let’s say thirty percent decline in their holdings near term so long as they make some multiple on their money say five years out. But most investors don’t have that kind of staying power. The decline of the populist/socialist state will not be pretty and accompanying defaults may pull markets down all over the world.

I have written extensively on the imperfections of the current dollar based fiat money international monetary system. I view gold as one way to hedge against that system’s eventual downfall. Asian central banks and retail buyers both have discovered gold. Living part time Hong Kong as I do, I detect huge enthusiasm for buying gold among Mainland visitors who come to Hong Kong. Gold recently has run up in a rocket-like manner. No doubt it needs to consolidate near term. Various people have come up with ways of valuing gold including comparing gold with inflation or calculating how much gold would be needed if some version of the gold standard were to be reinstated. I don’t have a formula for calculating the value of gold and I don’t have some kind of target price. Clearly there isn’t enough gold at current prices to support an entire global monetary system and a revived gold standard. Looking at gold that way leads to the conclusion it is substantially undervalued. Gold in my opinion is an alternative currency. So long as the current dollar based fiat money system remains in place, gold remains an important hedge. But what the gold price will do near term is anybody’s guess.

The historian Daniel J Boorstin once said “The greatest obstacle to discovery is not ignorance – it is the illusion of knowledge.” Lots of investment advice is coming from all sides from people suffering from the illusion of knowledge. We are in a difficult period without historical precedent. The illusion of knowledge could be fatal.

-Peter T. Treadway

See the original article >>

Follow Us